Sensitivity to lunar cycles prior to the 2007 eruption of Ruapehu volcano - ULB
←
→
Page content transcription
If your browser does not render page correctly, please read the page content below
www.nature.com/scientificreports
OPEN Sensitivity to lunar cycles prior
to the 2007 eruption of Ruapehu
volcano
Received: 8 June 2017 Társilo Girona1,4, Christian Huber1 & Corentin Caudron2,3,5
Accepted: 27 December 2017
Published: xx xx xxxx A long-standing question in Earth Science is the extent to which seismic and volcanic activity can be
regulated by tidal stresses, a repeatable and predictable external excitation induced by the Moon-
Sun gravitational force. Fortnightly tides, a ~14-day amplitude modulation of the daily tidal stresses
that is associated to lunar cycles, have been suggested to affect volcano dynamics. However, previous
studies found contradictory results and remain mostly inconclusive. Here we study how fortnightly
tides have affected Ruapehu volcano (New Zealand) from 2004 to 2016 by analysing the rolling
correlation between lunar cycles and seismic amplitude recorded close to the crater. The long-term
(~1-year) correlation is found to increase significantly (up to confidence level of 5-sigma) during the ~3
months preceding the 2007 phreatic eruption of Ruapehu, thus revealing that the volcano is sensitive to
fortnightly tides when it is prone to explode. We show through a mechanistic model that the real-time
monitoring of seismic sensitivity to lunar cycles may help to detect the clogging of active volcanic vents,
and thus to better forecast phreatic volcanic eruptions.
The possibility that Moon-Sun gravitational forces can influence terrestrial volcanism has been widely debated
over the last century1–21. The most intriguing debate lies on whether fortnightly tides, a ~14-day amplitude mod-
ulation of the daily tidal stresses that is related to lunar phases, affect volcanic activity or even force eruptions to
occur some specific days instead of others. For example, Johnston and Mauk22 suggested that major eruptions at
Stromboli (Italy) start preferentially close to the fortnightly tidal minima (neap tides), that is, when the moon
phase is close to the first or third quarter. The same correlation with neap tides was reported for five of the
six dome extrusions occurring between 1879 and 1880 in Islas Quemadas volcano23 (El Salvador). In contrast,
Sottili and Palladino24 suggested that the frequency of small explosive events in Stromboli increases during fort-
nightly tidal maxima (spring tides), that is, close to full or new moon. The same correlation with spring tides was
reported for Kilauea (Hawai’i, US), Fuego (Guatemala), Ngauruhoe (New Zealand), and Mayon (Philippines)
volcanoes25–28. On the other hand, fortnightly tidal modulation does not apparently affect the onset of eruptions
at Mauna Loa25,29 (Hawai’i).
The aforementioned studies appear to yield contradictory conclusions as to the nature or existence of correla-
tion between lunar phases (i.e., fortnightly tidal modulation) and volcanic activity. This may be a statistical bias
due to the unknown start time of many historical eruptions, and therefore to the small number of events con-
sidered30. To overcome these limitations, we analyse whether fortnightly tides affect volcanoes by addressing the
following questions: is the persistent seismicity recorded around active volcanic centres sensitive to fortnightly
tidal modulation? If so, can we use this sensitivity to detect when a volcano is in a critical state and prone to erupt?
We tackle these questions by exploring the correlation between lunar phases and seismic amplitude (hereafter
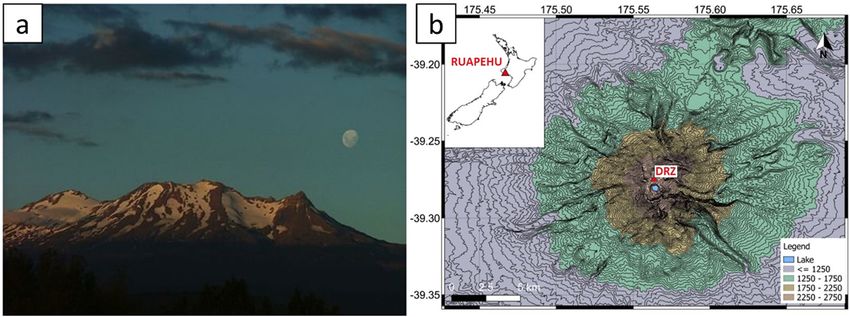
called luni-seismic correlation) at Ruapehu volcano, New Zealand (Fig. 1). In particular, we use data from a seis-
mic station installed at the summit of Ruapehu because: (a) the processes that are more likely to respond to tidal
forcing are expected to take place at shallow levels beneath the volcanic crater5,31, and (b) nearly-continuous data
are openly available for the last 13 years (we use data from 22-February-2004 to 15-November-2016, Geonet-GNS
archive, DRZ station, vertical component32). Ruapehu is a good candidate for this study as it has displayed a broad
1
Department of Earth, Environmental and Planetary Sciences, Brown University, Providence, Rhode Island, USA.
2
Département Géosciences, Environnement et Société, Université Libre de Bruxelles (ULB), Brussels, Belgium.
3
Department of Seismology and Gravimetry, Royal Observatory of Belgium, Uccle, Belgium. 4Present address: Jet
Propulsion Laboratory, California Institute of Technology, Pasadena, CA, 91109, USA. 5Present address: Department
of Geology, Ghent University, Krijgslaan 281 (S8-WE13), Ghent, Belgium. Correspondence and requests for materials
should be addressed to T.G. (email: tarsilo.girona@jpl.nasa.gov)
ScIEnTIfIc ReporTS | (2018) 8:1476 | DOI:10.1038/s41598-018-19307-z 1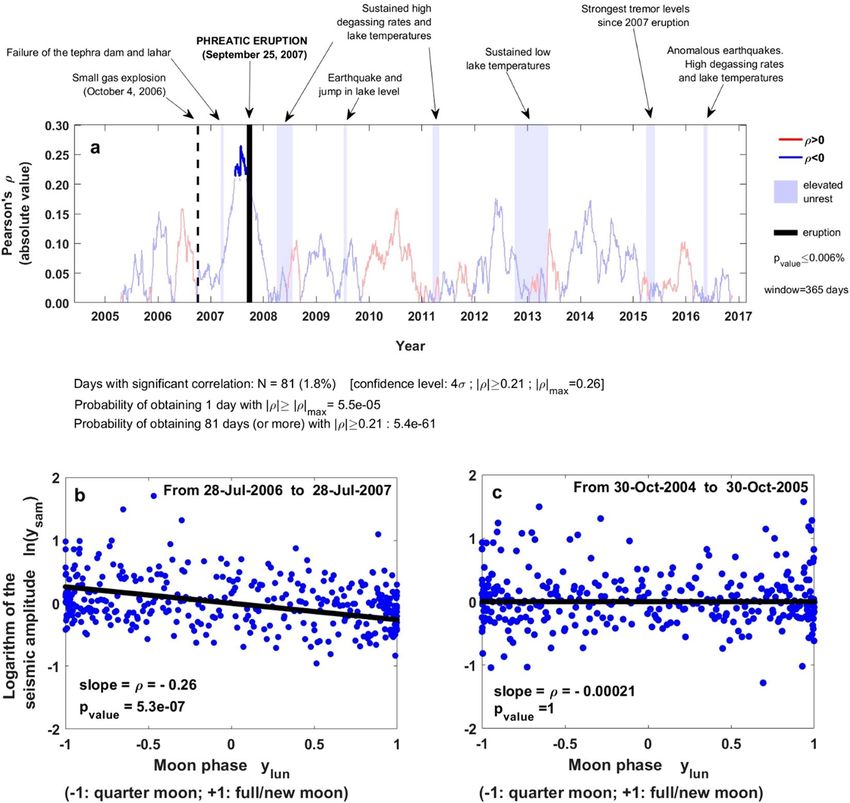
www.nature.com/scientificreports/

                              Figure 1. Ruapehu volcano. (a) Photo of Mt Ruapehu with the Moon in the background; by courtesy of Greg
                              Steenbeeke. (b) Location of Mt Ruapehu and the GeoNet seismic station (DRZ) used in this study. This map
                              was generated with QGIS 2.16.1 (http://www.qgis.org/en/site/), contour lines were extracted from the ASTER
                              Global Digital Elevation Model (GDEM) (ASTER GDEM is a product of NASA and METI; https://asterweb.jpl.
                              nasa.gov/gdem.asp), latitude and longitude are given in degrees, and altitude in legend is given in meters.

                              spectrum of behaviour over the last decade, including several episodes of unrest, periods of quiescence, a small
                              gas explosion (October 4, 2006), and a large phreatic eruption which occurred without warning32,33 (September
                              25, 2007).
                                   The analysis we undertake here consists of five main steps. First, we compute the logarithm of the daily seis-
                              mic amplitude ln(ysam) from the raw seismic data, after applying a 20-day high-pass median filter to remove the
                              influence of potential processes occurring over timescales greater than the average periodicity of spring tides,
                              T = 14.7653 days (i.e., the average time between full moon and the next new moon) (Supplementary Fig. S1).
                              Second, we create a synthetic periodic time series to parameterize lunar cycles: ylun = −cos(2π(t − tlow)/T), where
                              t is time in days and tlow is a reference day of the calendar with neap tide (i.e., quarter moon). With this approach,
                              ylun = 1 during high tides (full or new moon) and ylun = −1 during low tides (quarter moon) (Supplementary
                              Fig. S2). Third, we calculate the Pearson product-moment correlation coefficient (ρ) among different subsets of
                              the time series ln(ysam) and ylun (Supplementary Fig. S3). We use backward windows of 1 year (i.e., >300 data pairs
                              capturing more than 20 spring/neap tides), which allow us to explore the existence of long-term luni-seismic
                              correlation and preserves a statically relevant sample size; the analysis is also performed with backward windows
                              from 100 to 600 days for the sake of comparison. The Pearson coefficient ρ evaluates if two datasets are linearly
                              correlated, such that 0 < ρ ≤ 1 implies a positive correlation between ln(ysam) and ylun, while −1 ≤ ρ < 0 implies a
                              negative correlation; the magnitude of ρ indicates the strength of the correlation between the time series. Fourth,
                              we test if ρ obtained for every moving window is significantly different from zero by calculating the probability
                              pvalue of obtaining by chance the observed (or more extreme) values of ρ. Fifth, we combine a set of Monte Carlo
                              simulations with a binomial test to analyse the likelihood for a stochastic seismic amplitude time series to produce
                              the correlation coefficients observed in the natural data (Supplementary Fig. S4). A detailed explanation of the
                              data processing and analysis can be found in Methods (Sections 1 and 2).
                                   Our study reveals that the 1-year rolling correlation between lunar cycles and seismic amplitude increases dur-
                              ing the ~3 months preceding the phreatic eruption of September 25, 2007 (Fig. 2, Supplementary Fig. S5). During
                              this period, the Pearson coefficient ρ is negative (i.e., daily median seismic amplitude tends to be lower towards
                              full/new moon), its magnitude |ρ| ≥ 0.21, and it is statistically significant at a confidence level of 4-sigma (i.e., the
                              probability of obtaining the observed ρ value -or greater- by chance is lower than 0.006%); the Pearson coeffi-
                              cient reaches a maximum of |ρ|max = 0.26 with confidence level of 5-sigma about 2 months prior to the eruption
                              (Figs 2a,b). Moreover, we find through Monte Carlo simulations that the probability of obtaining by chance 1 day
                              with |ρ| ≥ |ρ|max is ~10−5, whereas the binomial test reveals that the probability of obtaining by chance |ρ| ≥ 0.21
                              over a period extending for ~3 months with a dataset of 12 years is extremely low (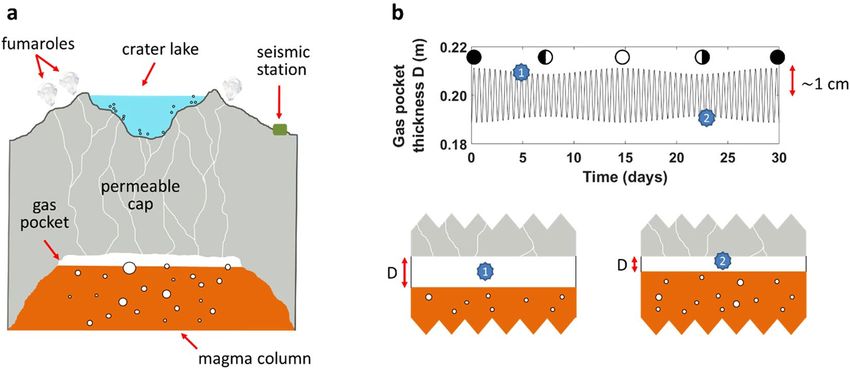
www.nature.com/scientificreports/

                              Figure 2. Luni-seismic correlation at Ruapehu. (a) Pearson coefficient (ρ) for 1-year backward windows.
                              Positive and negative correlations are in red and blue, respectively, shaded regions represent unrest episodes32,
                              and deep blue means pvalue < 0.006%. This plot depicts the case N = 81 days of significant correlation, but we
                              find N = 59–86 days (after repeating the method 500 times) depending on the random values used to replace
                              gaps and spikes (Methods, Section 1). The probability of obtaining by chance N days with significant correlation
                              is therefore in the range ~10−36–10−64 (Supplementary Fig. S5). (b) Logarithm of the daily median seismic
                              amplitude ln (ysam) versus moon phase ylun (t) for the 365 days preceding July 28, 2007; this is the period with
                              maximum correlation obtained. (c) ln (ysam) versus ylun (t) for the 365 days preceding October 30, 2005; no
                              significant correlation exists in that period.

                                  The emergence of long-term (~9–15 months) sensitivity of Ruapehu to fortnightly tides calls for a model to (a)
                              quantify the seismic response of the volcanic system to tidal forcing, and (b) identify the link between luni-seismic
                              correlation and the physical processes that lead to phreatic eruptions (Fig. 3). Based on a recent mechanistic
                              model developed by Girona et al.35,36, we propose that the persistent seismicity recorded around the crater of
                              Ruapehu (i.e., shallow tremor37) is induced by pressure oscillations emerging in gas pockets trapped below the
                              active vent; these pressure oscillations arise in response to two concurrent processes: the permeable flow of gases
                              through the shallowest part of the volcanic edifice and the intermittent supply of volatiles from deeper levels
                              (Fig. 3a). Moreover, we argue that tidal stresses squeeze magma reservoirs, thus inducing harmonic ascent and
                              retreat of magma in the shallow plumbing system1,2,5,6,31 (Fig. 3b). Combining the aforementioned approaches, we
                              generate synthetic tremor signals that are analysed in a similar way as the natural data (see details in Methods,
                              Section 3). Our analysis reveals that, for small tidally-induced ascent/retreat of magma (~1 cm amplitude), the
                              magnitude of the luni-seismic correlation increases when the permeability decreases below a threshold value
                              (Fig. 4). In other words, fortnightly tides can modulate the daily median amplitude of volcanic tremor, but only if
                              the permeability of the shallow volcanic edifice is low enough. For example, using realistic values for the different
                              parameters involved in the model, we find that the Pearson coefficient ρ differs from zero (at confidence level of
                              4-sigma) if the permeability κ is below ~10−9 m2, reaching ρ = −0.34 ± 0.20 when κ = 1.3 ⋅ 10−10 m2 (note that
                              these values of permeability are realistic for shallow volcanic edifices because they are highly-fractured38) (Fig. 4).
                              Our model also suggests that the correlation is negative because the response time39,40 of the volcano to tidal

ScIEnTIfIc ReporTS | (2018) 8:1476 | DOI:10.1038/s41598-018-19307-z                                                                                3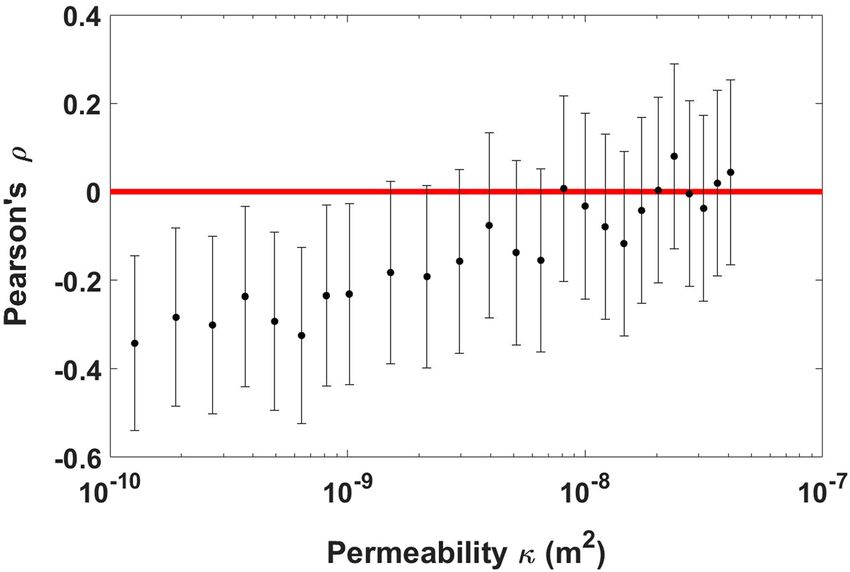
www.nature.com/scientificreports/

                              Figure 3. Fundamentals of our model. (a) Sketch of Ruapehu volcano during quiescence. Tremor-like pressure
                              oscillations emerge spontaneously in subsurface gas pockets due to the intermittent supply of volatiles into
                              the pocket and the transfer of gases through the porous cap35,36. (b) Periodic ascent and retreat of magma due
                              to tidal squeezing of the magma plumbing system1,2,5,6,31; this generates harmonic variations of the gas pocket
                              thickness (D), which in turn affect the amplitude of the seismic signal35,36. Black, white, and half disks represent
                              new, full, and quarter moon, respectively. Numbered blue stars represent a case with thick gas pocket and
                              another case with thinner gas pocket.

                              Figure 4. Pearson coefficient (ρ) between lunar cycles and the modelled seismic amplitude for different values
                              of the cap permeability (κ). Error bars represent four standard deviations of uncertainty (4-sigma confidence
                              level). We use phase shift δ = π (similar results are obtained with π/2 < δ < 3π/2; see Supplementary Discussion
                              and Supplementary Fig. S13) and realistic values for the different parameters of the model35,36 (see details
                              in Methods, Section 3); these values allow generating tremor signals with dominant frequency around 2 Hz
                              (Supplementary Fig. S9), as observed on Ruapehu37.

                              stresses is between ~3 h and ~9 h. In turn, this implies that the magma plumbing system of Ruapehu is predomi-
                              nantly under compression when closer to quarter moon and predominantly under extension when closer to full/
                              new moon (see Supplementary Discussion).
                                  We therefore suggest that Ruapehu was sensitive to lunar cycles during 2006/2007 because the shallow vent
                              was highly clogged, which likely triggered the 25 September 2007 phreatic eruption because it favours the pressur-
                              ization (due to gas over-accumulation) below the active crater33. Vent clogging may be induced by two potential

ScIEnTIfIc ReporTS | (2018) 8:1476 | DOI:10.1038/s41598-018-19307-z                                                                              4
www.nature.com/scientificreports/
mechanisms. First, clogging could occur gradually since the 1995/1996 vent-clearing eruptions due to mineral
precipitation in pore networks33, thus decreasing the permeability of the vent below threshold values since ~June
2006 (i.e., ~15 months prior to the phreatic eruption). In such a case, gradual clogging maybe also triggered
the small 4 October 2006 gas explosion, although no significant luni-seismic correlation could be detected due
to the short time window (~90–120 days since June 2006) and the noisy nature of the data34. Second, clogging
began after the October 2006 gas explosion (~9–11 months prior to the phreatic eruption) due to gravitational
compaction and restructuration of pore networks. In such a case, the small gas explosion was probably triggered
by other processes not related to vent clogging (e.g., infiltration of meteoric water and subsequent expansion of
steam). On the other hand, our model also suggests that Ruapehu is not sensitive to lunar phases since the end
of 2007 because the porous vent is building back and its permeability has remained above threshold levels after
the phreatic eruption. Hence, the unrest episodes detected during the last 10 years were probably not related to
pore clogging of the vent but rather to magma migrations at depth, tectonic processes, or shallower hydrothermal
phenomena.
The response of the seismicity recorded around active craters to repeated and predictable tidal excitations has
the potential to reveal the state of criticality of the shallowest part of a volcano. In particular, our study reveals
that: (a) the persistent seismicity of Ruapehu volcano was not modulated by fortnightly tides over the last 13
years, except for the 9 to 15 months preceding the unpredicted 2007 phreatic eruption; and (b) analysing the cor-
relation between lunar cycles and seismic amplitude offers exciting perspectives to detect the sustained clogging
of gas pathways, and thus to better forecast phreatic eruptions at volcanoes whose shallow magma plumbing sys-
tem is subjected to tidal deformation. Future work should explore whether other volcanoes besides Ruapehu are
sensitive to lunar cycles prior to eruptions, although it is worth highlighting that tidal deformation may be more
prominent in New Zealand volcanoes than in other volcanoes of the world. This is so because ocean-tide load-
ing is larger in New Zealand than in most other places, and its location in mid-latitudes implies that Earth tides
are also strong41,42. The only requirement to apply our statistical approach to other volcanoes is to have mostly
continuous and long-lasting (several years) seismic data recorded nearby volcano craters. Our interpretation of
the luni-seismic correlation is applicable to any volcano with prominent outgassing during quiescence, and thus
when tremor is controlled by the permeable flow of gases through the shallowest part of the volcanic edifice35,36.
Methods
Data Processing. Data processing consists of the following steps:
a) Seismic data are obtained from a permanent short-period seismic station installed on top of Ruapehu vol-
cano (~700 m from the crater lake). In particular, we use the vertical component waveform over a period
spanning from February 22, 2004, to November 15, 2016 (downloaded from the open access Geonet-GNS
archive, ref.32). This time period was selected because the same type of seismometer was consistently used;
we note that the seismometer was destroyed during the 2007 eruption, although it was replaced a few days
later by the same type of sensor.
b) The daily median seismic amplitude ysam (t) is computed through the following standard procedure: we
read files containing velocity data over a duration of 1 day, subtract the mean of the 1-day time series, apply
a high-pass filter (0.1 Hz, butterworth, 4 corners), integrate to obtain the displacement waveform, apply
the same high-pass filter (0.1 Hz) followed by a low-pass filter (40 Hz, butterworth, 4 corners), take the
absolute value of the displacement waveform, calculate the median of the absolute values in every window
of 90 s (our results are essentially the same when using window durations ranging between 30 s and 1800
s; Supplementary Fig. S8), and export the median of all the windows contained in each day (960 windows
when using window durations of 90 s). This procedure, which is repeated for every day of the 12-year
period, allows capturing the persistent seismicity of Ruapehu (i.e., tremor37) by minimizing the potential
contamination due to meteorological perturbations, tectonic earthquakes, or other unwanted non-volcanic
effects. For our analysis, we finally calculate the logarithm of the daily median seismic amplitude ln(ysam).
c) Gaps (e.g., after the phreatic eruption of 2007, which destroyed the seismic station) and spikes (probably
due to storms or electronic problems), which only represent ~5% of the ln(ysam) time series, are replaced
by random values obtained from a normal distribution with the same mean and standard deviation as the
data. The replacement of gaps and spikes allows us to apply a 20-day high-pass median filter to remove
variations of the seismic amplitude occurring in timescales larger than the average periodicity of high tides
(Supplementary Fig. S1).
Data Analysis. The correlation between lunar cycles and seismic amplitude (defined here as luni-seismic
correlation) is analysed as follows:
a) We create a synthetic periodic time series to describe lunar phases (Supplementary Fig. S2):
ylun = −cos(2π(t − tlow)/T), where t is an integer representing time in days, tlow is a reference day of the
calendar with low tide (i.e., quarter moon), and T = 14.7653 days is the average periodicity of high or low
tides (i.e., the average time between a full moon and the next new moon). With this approach, ylun = 1
during high tides and ylun = −1 during low tides. We choose February 28, 2004, as our reference day with
low tide (tlow). Note that we produce a value of ylun per day; the time of the day at which ylun is generated is
the same as the peak of quarter moon on the reference day.
b) We calculate the Pearson correlation coefficient (ρ) with different subsets of the time series ln(ysam) and ylun
(Supplementary Fig. S3). These subsets are backward windows of L days, such that the value of ρ corre-
sponding to a given day is calculated with the L data pairs preceding that day. It is worth noting that: I) ρ
evaluates how well two datasets are linearly correlated, such that 0 < ρ ≤ 1 implies a positive correlation
ScIEnTIfIc ReporTS | (2018) 8:1476 | DOI:10.1038/s41598-018-19307-z 5www.nature.com/scientificreports/
(i.e., ln(ysam) tends to increase with ylun) and −1 ≤ ρ < 0 implies a negative correlation (i.e., ln(ysam) tends to
decrease with ylun). II) The subsets of ln(ysam) and ylun are standardized, i.e., the mean of each time series is
subtracted and the result is divided by the standard deviation. This standardization process does not affect
the value of ρ and makes it match with the slope of the line that best fits ln(ysam) and ylun(t) (Fig. 2b,c). III)
The random values previously added to replace gaps and spikes are not taken into account to calculate ρ.
IV) ρ is calculated for backward windows whose number of gaps and spikes is less than 20% of the number
of days L. V) Larger values of L allow analyzing sustained long-term correlations while ensuring the appli-
cability of statistical methods34. In our analysis we focus on L = 1 year, although the results are similar for
backward window sizes in the range 290–430 days (Supplementary Fig. S6).
c) We test whether ρ obtained for every moving window is significantly different from zero. To do this, we
perform a significance test consisting of calculating the probability (pvalue) of obtaining the observed corre-
lation coefficient (ρ) if the data pairs of a given window are not correlated (null hypothesis); the probability
pvalue is calculated with a two-tailed test (MATLAB algorithm). If pvalue ≤ P, where P is a given threshold val-
ue, the correlation coefficient ρ is said to be statistically significant at a given confidence level. For example,
if pvalue ≤ 0.006% for a given window, the correlation between ln(ysam) and ylun in that window is different
from zero at a confidence level of 4-sigma. In other words, the probability that the seismic amplitude and
lunar cycles can be correlated by chance in that window is lower than 0.006%. Here, we use 4-sigma as
confidence level to reject or not the null hypothesis, a much stricter condition than has been considered
so far in other studies focusing on the influence of moon cycles on volcanic activity (usually 2-sigma or
lower3,20,25).
d) We test the extent to which a stochastic seismic amplitude time series, which is known to be unrelated with
lunar cycles, may give rise to the significant correlation coefficients (ρ) observed in the natural data. In
other words, we quantify whether the values and duration of significant correlation obtained (with
confidence 4-sigma) can be produced with a random seismic amplitude time series. This is done by
following the next steps: I) we compute the number of days N that satisfies |ρ| ≥ |ρsig| with the natural data,
where |ρsig| is the minimum correlation coefficient (in absolute value) from which the level of confidence is
rand
4-sigma. II) We build a random seismic amplitude time series ln(ysam ) with the same mean and standard
rand
deviation as the natural data ln(ysam). III) We calculate the Pearson correlation coefficient between ln(ysam )
and the moon phase time series ylun(t), exactly as we did for the natural data (i.e., for moving windows of
size L and assuming the same gaps and spikes). IV) We repeat the previous step 500 times (Monte Carlo
simulations) to obtain the probability density function of correlation coefficients. For example, for L = 1
year, we obtain a Gaussian probability density function with mean equal to 0 and standard deviation equal
to 0.0659 (Supplementary Fig. S4). V) Using the aforementioned probability density function, we calculate
the probability of obtaining by chance one day with correlation coefficient that is equal or larger than the
minimum significant correlation obtained with the data (in absolute value; |ρsig|). VI) We use the previous
result to perform a binomial test; this test allows us to calculate the probability of obtaining, in the more
than 12 years of data, N days (or more) with correlation coefficient satisfying |ρ| ≥ |ρsig|.
Model. We propose a mechanical model for tremor based on Girona et al.35,36. We use this forward model to
generate synthetic seismic datasets and study the factors that can cause a change in the correlation between lunar
cycles and the observed seismicity.
Mechanical model of shallow tremor. We propose that shallow tremor at Ruapehu arises from pressure oscilla-
tions ΔP occurring in a shallow gas pocket embedded beneath the volcanic crater (called steam zone by other
authors37). These pressure changes ΔP do not result from elastic oscillations of the shallow conduit, but emerge
in response to two concurrent processes: the permeable flow of gases through the shallow cap and the intermit-
tent supply of volatiles from deeper levels. To first order, ΔP beneath volcanic craters is given, in the frequency
domain, by35,36:
Rg Tg
4Γ1Q0π (Γ1 + jω)(1 + e−jωts)
N⁎
ΔP(ω) = 2 − 2
δ( ω ) + 2 2 −j ω t −j ω t ∑ qn e−jωtn
,
πR DM
ω0 ω0 − ω (1 + e s) + jω(Γ + Γ e
1
s)
n =1
(1)
where Rg is the ideal gas constant, Tg is the gas temperature, R is the radius of the uppermost part of the volcanic
conduit, D is the thickness of the gas pocket embedded beneath the crater, M is the molecular weight of water
(H2O is the main component of volcanic gas emissions), Q0 is the mean outgassing flux, δ(ω) is the Dirac delta
function (and thus δ(ω) > 0 for ω > 0), ts is the seepage time (i.e., time required for the gas to pass through the
permeable cap), qn is the mass of gas introduced into the gas pocket at the instant tn (e.g., through bubble bursting
at the top of a fluid-like magma column), N* is the total number of mass impulses (e.g., number of bubbles that
burst at the top of the magma column) occurring in the gas pocket during the simulation time, ω is the angular
frequency, and j is the imaginary unit. The parameters Γ1, Γ, and ω02 are defined as Γ1 = 2μRgTgϕ/[(P0 + Pex)Mκ],
Γ = Γ1 + 2RgTgQ0/[(P0 + Pex)πR2DM], and ω02 = 4P0Rg Tg ϕ/[(P0 + Pex )DMLc], where μ is the gas viscosity, P0 is the
mean pressure in the gas pocket, Pex is the pressure at the exit vent (i.e., hydrostatic pressure at the bottom of the
crater lake), Lc is the cap thickness, and ϕ and κ are the connected porosity and permeability of the cap, respec-
tively. In turn,the mean pressure in the gas pocket (P0) and the seepage time (ts) can be calculated from:
ScIEnTIfIc ReporTS | (2018) 8:1476 | DOI:10.1038/s41598-018-19307-z 6www.nature.com/scientificreports/
2LcμRg Tg Q0
P0 = Pex 1 +
κπR2MPex2 (2)
and
(P0 + Pex )MϕπR2τLc
ts = ,
2Q0Rg Tg (3)
where τ is the tortuosity (i.e., ratio of the actual path length for the gas to escape through the cap to the cap thick-
ness) and the other parameters have been previously defined. The parameters ϕ and κ are assumed to be related
through the following empirical function:
α
ϕ
k = k⁎ ,
ϕ⁎ (4)
where ϕ* and κ* are two constants, and the exponent α ranges between 1 and 25 for common geologic materials
(we use here: ϕ⁎ = 3 ⋅ 10−4, κ* = 10−8 m2, and α = 3; see refs35,36 for details).
By convolving equation (1) with the Green’s function describing the propagation of Rayleigh waves along the
path to the receiver, we can compute the vertical ground displacement that would be recorded at nearby stations.
The vertical component of the ground displacement uz is given, in the frequency domain, by35,36:
Rg Tg (Γ1 + jω)(1 + e−jωts) N⁎
uz (ω) = q e−jωtn
DM ω 2 − ω 2(1 + e−jωts) + jω(Γ + Γ e−jωts) ∑ n
0 1 n =1
2v ω e− 2vωuQr f
× c
2
( ω r
)
π
e vc 4 ,
j +
π r 8 ρ v v
s c u (5)
where vc is the phase velocity (we use vc = 1295(ω/2π)−0.374 m/s), r is the distance from the source to the receiver,
vu is the group velocity (we use vu = 0.73vc), Qf is the dimensionless quality factor (a parameter that accounts for
the attenuation of seismic waves), and ρs is the density of the medium. The parameters vc, vu, Qf, and ρs are related
to the propagation of the seismic waves through the crust and not to the seismic source. The ground displacement
described by equation (5) was shown to explain the main features of shallow volcanic seismicity, particularly
monochromatic tremor as typically recorded around Ruapehu (Supplementary Fig. S9).
Effect of tidal stresses on the parameters of the model. The continuous compressions-extensions induced by tidal
stresses in the shallow crust are thought to squeeze magma reservoirs1,2,5,6,31. This, in turn, is expected to induce
harmonic ascent and retreat of magma in shallow plumbing systems (as sometimes observed in Kilauea1,2,5,6 and
Villarrica lava lakes31), thus changing the thickness of the gas pocket (D) with time. The effect of tidal stresses on
the gas pocket thickness is parameterized with a sum of harmonic time series:
D(t ) = D0 + ∑Di cos(2πt /Ti + δ ),
i (6)
where D0 is the mean gas pocket thickness, the parameters Ti and Di represent the period and amplitude, respec-
tively, of each tidal constituent i, and δ is a phase shift that accounts for the response time of the volcano to tidal
stresses. In particular, δ is the phase of the daily oscillation of the gas pocket thickness at a specific time t and
moon phase, which depends on how the combination of Earth tides and ocean-tide loading in New Zealand
deforms the magma plumbing system of Ruapehu (see Supplementary Discussion). For simplicity, we consider
only the tidal constituents responsible for generating fortnightly tidal modulation, i.e., the principal lunar semi-
diurnal (M2), with periodicity TM2 = 12.42 hours; and the principal solar semidiurnal (S2), with periodicity
TS 2 = 12 hours. We also assume tidal strains to be small and use D M2 = 0.01 m and D S 2 = D M2 /8. With these
values, the gas pocket thickness D(t) reproduces the classic fortnightly spring/neap cycle (Fig. 3b), with maxi-
mum amplitude of the fluctuations on the order of 0.01 m. This amplitude is considered a minimum end-member;
tidally-induced magma level oscillations of up to 30–60 cm were observed sometimes at Halemaumau lava
lake1,2,5,6. Finally, we explore values of the phase shift in the range δ = 0 − 2π. The simple approach used in this
study allows us to analyse how small harmonic variations of the gas pocket thickness due to tidal stresses affect
the amplitude of the synthetic seismic time series. It is worth noting that, as revealed by equation (6), we also
expect semi-diurnal modulation of the seismic amplitude (Supplementary Fig. S10); this has been observed at
Fogo volcano, Cape Verde Republic42, and can be sometimes detected by simple eye inspection at Ruapehu
(Supplementary Fig. S11).
Synthetic data processing. To analyse the correlation between lunar cycles and the logarithm of the modelled
daily seismic amplitude, we proceed as follows:
a) We assign the following realistic values to the parameters of the model: external pressure Pex = 2.06 ⋅ 106
Pa (i.e., atmospheric pressure + hydrostatic pressure of a 200 m water lake, consistent with historical lake
ScIEnTIfIc ReporTS | (2018) 8:1476 | DOI:10.1038/s41598-018-19307-z 7www.nature.com/scientificreports/
depths at Ruapehu43), cap thickness Lc = 10 m (this implies that tremor is sourced beneath the crater lake at
a depth consistent with previous studies44), radius of the shallow magma conduit and cap R = 10 m, mean
thickness of the gas pocket D0 = 0.1 m, mean outgassing flux Q0 = 50 kg/s, volcanic gas temperature
Tg = 900 °C, gas viscosity μ = 10−5 Pas, molecular weight of gas (mostly water vapour) M = 0.018kg/mol,
cap porosity ϕ = ϕ0(κ/κ0)1/α, with ϕ0 = 3 ⋅ 10−4, κ0 = 10−8 m2, and α = 3 (realistic for highly fractured
caps and permeable flow dominated by open cracks and channels35,36), and tortuosity τ ≈ 1. Besides, we
impose the random supply of N* = 1,000 gas bubbles in 90 s of simulation, and we use distance source-re-
ceiver r = 700 m, density of the medium ρs = 3,000 kg/m3, frequency-dependent phase velocity
vc = 1295(ω/2π)−0.374 m/s, group velocity vu = 0.73vc, and dimensionless quality factor Qf = 5. These values
of the parameters generate mean pressures in the gas pocket P0 on the order of 106 Pa (slightly greater than
the external pressure Pex) and tremor signals with dominant frequency around 2 Hz (Supplementary
Fig. S9), as observed on Ruapehu37.
b) For the given mean gas pocket thickness D0 (and for a given value for the phase shift δ), we calculate D at
t = 0 using equation (6). Then, we simulate a 90 s time series of ground displacement uz(t) by calculating
the inverse Fourier transform of equation (5) (details on the calculation in ref.35). This mimics the time
windows that were used in the analysis of the natural data (see 1. Data Processing). Later, we calculate
the seismic amplitude of the 90 s simulation by taking the absolute value of the synthetic displacement
waveform and computing the median. Note that the gas pocket thickness D is assumed to remain constant
during the 90 s simulation because it varies over longer timescales.
c) We repeat the aforementioned calculations after recalculating the gas pocket thickness D over steps of
15 minutes for a duration of t = 1 year (the time step is limited to 15 minutes to make the problem more
tractable in terms of computer run time). This gives a total of 96 seismic amplitudes per day (instead of the
960 values per day that we have with the data), from which we take the median to obtain the daily seismic
amplitude and take its logarithm. We also create a synthetic periodic time series to describe lunar cycles,
exactly as we did to analyse the natural data (see 2. Data Analysis).
d) The procedure described above allows us to generate model data that we can treat statistically to test the
conditions that are required to explain an increase of luni-seismic correlation prior to the 2007 phreatic
eruption of Ruapehu. In particular, we conduct the same statistical analysis as with the natural data, i.e.,
we calculate the Pearson correlation coefficient ρ between the logarithm of the modelled daily seismic am-
plitude and the lunar cycles (Supplementary Fig. S12). This is done for 365 data pairs (1 year of synthetic
data).
e) Finally, we repeat steps b–d with different values of the cap permeability κ and porosity ϕ (related through
equation (4)) to explore how overall cap sealing (e.g., due to pore mineralization or subsidence of the
crater floor after the 2006 gas explosion) affects the luni-seismic correlation. This analysis reveals that the
luni-seismic correlation is significant when the permeability of the cap κ is below a threshold value; and it
is negative as long as the phase shift δ meets π/2 < δ < 3π/2 and hence if the response time of the volcano to
tidal stresses ranges between ~3 h and ~9 h (see Supplementary Discussion and Supplementary Fig. S13).
References
1. Jaggar, T. A., Finch, R. H. & Emerson, O. H. The lava tide, seasonal tilt, and the volcanic cycle. Mon. Weather Rev. March 52, 142–145
(1924).
2. Brown, E. W. Tidal oscillations in Halemaumau, the lava pit of Kilauea. Am. J. Sci. 9, 95–112 (1925).
3. Mauk, F. J. & Johnston, M. J. S. On the triggering of volcanic eruptions by Earth tides. J. Geophys. Res. 78, 3356–3362 (1973).
4. Hamilton, W. L. Tidal cycles of volcanic eruptions: fortnightly to 19 yearly periods. J. Geophys. Res. 78, 3363–3375 (1973).
5. Shimozuru, D. Lava lake oscillations and the magma reservoir beneath a volcano. Bull. Volcanol. 39, 570–580 (1975).
6. Shimozuru, D. Tidal Effects on Hawaiian volcanism, Volcanism in Hawaii. US Geological Survey Professional Paper 1350(2),
1337–1343 (1980).
7. Sparks, R. S. J. Triggering of volcanic eruptions by Earth tides. Nature 290, 448 (1981).
8. McNutt, S. R. & Beavan, R. J. Volcanic earthquakes at Pavlof volcano correlated with the solid Earth tide. Nature 294, 615–618
(1981).
9. McNutt, S. R. & Beavan, R. J. Patterns of earthquakes and the effect of solid earth and ocean load tides at Mount St. Helens prior to
the May 18, 1980, eruption. J. Geophys. Res. 89, 3075–3086 (1984).
10. Rydelek, P. A., Davis, P. M. & Koyanagi, R. Y. Tidal triggering of earthquake swarms at Kilauea volcano, Hawaii. J. Geophys. Res. 93,
4401–4411 (1988).
11. Connor, C. B., Stoiber, R. E. & Malinconico, L. L. Jr. Variation in sulfur sioxide emissions related to Earth tides, Halemaumau crater,
Kilauea volcano, Hawaii. J. Geophys. Res. 93(14), 867–14,871 (1988).
12. Emter, D. In Tidal Phenomena, Bhattacharji, S., Friedman, G., Neugebauer, H. J., Seilacher, A., Eds. (Springer, New York, 1997), pp.
293–309.
13. Neuberg, J. External modulation of volcanic activity. Geophys. J. Int. 142, 232–240 (2000).
14. Kasahara, J., Nakao, S. & Koketsu, K. Tidal influence on the 2000 Miyake-jima eruption and its implications for hydrothermal
activity and volcanism. Proc. Japan Acad. 77, 98–103 (2001).
15. Kasahara, J. Tides, earthquakes, and volcanoes. Science 297, 348–349 (2002).
16. Tolstoy, M., Vernon, F. L., Orcutt, J. A. & Wyatt, F. K. Breathing of the seafloor: tidal correlations of seismicity at Axial volcano.
Geology 30, 503–596 (2002).
17. Sottili, G., Martino, S., Palladino, D. M., Paciello, A. & Bozzano, F. Effects of tidal stresses on volcanic activity at Mount Etna, Italy.
Geophys. Res. Lett. 34, L01311 (2007).
18. Espíndola, J. M., Zamora-Camacho, A. & Jiménez, Z. Some aspects of the seismicity associated with the 1982 eruption of El Chichon
volcano, Chiapas, Mexico. J. Volcanol. Geotherm. Res. 157, 367–374 (2006).
19. van Manem, S. M., Kervyn, M., Blake, S. & Ernst, G. G. J. Apparent tidal influence on magmatic activity at Oldoinyo Lengai volcano,
Tanzania, as observed in Moderate resolution Imaging Spectroradiometer (MODIS) data. J. Volcanol. Geotherm. Res. 189, 151–157
(2010).
ScIEnTIfIc ReporTS | (2018) 8:1476 | DOI:10.1038/s41598-018-19307-z 8www.nature.com/scientificreports/
20. Bhatnagar, T., Tolstoy, M. & Waldhauser, F. Influence of fortnightly tides on earthquake triggering at the East Pacific Rise at 9°50′N.
J. Geophys. Res. Solid Earth 121, 1262–1279 (2016).
21. Wilcock, W. S. D. et al. Seismic constraints on caldera dynamics from the 2015 Axial Seamount eruption. Science 354, 1395–1399 (2016).
22. Johnston, M. J. S. & Mauk, F. J. Earth tides and the triggering of eruptions from Mt Stromboli, Italy. Nature 239, 266–267 (1972).
23. Golombek, M. P. & Carr, M. J. Tidal triggering of seismic and volcanic phenomena during the 1879-1880 eruption of Islas Quemadas
volcano in El Salvador, Central America. J. Volcanol. Geotherm. Res. 3, 299–307 (1978).
24. Sottili, G. & Palladino, D. M. Tidal modulation of eruptive activity at open-vent volcanoes: evidence from Stromboli, Italy. Terra
Nova 24, 233–237 (2012).
25. Dzurisin, D. Influence of fortnightly Earth tides at Kilauea volcano, Hawaii. Geophys. Res. Lett. 7, 925–928 (1980).
26. Martin, D. P. & Rose, W. I. Jr. Behavioral patterns of Fuego volcano, Guatemala. J. Volcanol. Geotherm. Res. 10, 67–81 (1981).
27. Michael, M. O. & Christoffel, D. A. Triggering of eruptions of Mt Ngauruhoe by fortnightly Earth tide maxima, January 1972-June
1974. N.Z. J. Geol. Geophys. 18, 273–277 (1975).
28. Ramos, E. G., de Torres, C. B. & Calderon, A. C. Earth tide influences on the recent activities of Mayon volcano. Phil. J. Volcanol. 2,
172–190 (1985).
29. Gabrieli, A., Wilson, L. & Lane, S. Volcano-tectonic interactions as triggers of volcanic eruptions. Proc. Geol. Assoc. 126, 675–682
(2015).
30. Rydelek, P. A., Sacks, I. S. & Scarpa, R. On tidal triggering of earthquakes at Camp Flegrei, Italy. Geophys. J. Int. 109, 125–137 (1992).
31. Bredemeyer, S. & Hansteen, T. H. Synchronous degassing patterns of the neighbouring volcanoes Llaima and Villarrica in south-
central Chile: the influence of tidal forces. Int. J. Earth Sci. 103, 1999–2012 (2014).
32. Geonet-GNS archive: http://magma.geonet.org.nz/resources/network/netmap.html, DRZ station/Geonet Alert Bulletins: http://
info.geonet.org.nz/blog/volc.
33. Christenson, B. W. et al. Cyclic processes and factors leading to phreatic eruption events: insights from the 25 September 2007
eruption through Ruapehu Crater Lake, New Zealand. J. Volcanol. Geotherm. Res. 191, 15–32 (2010).
34. Schönbrodt, F. D. & Perugini, M. At what sample size do correlations stabilize? J. Res. Pers. 47, 609–612 (2013).
35. Girona, T., Caudron, C. & Huber, C. Origin of the shallow seismicity preceding volcanic eruption. In review (2017).
36. Girona, T., Caudron, C. & Huber, C. Shallow seismicity at open-vent volcanoes, Abstract [Final paper number: V43A-3137]
presented at 2016 Fall Meeting, AGU, San Francisco, Calif., 12–16 Dec (2016).
37. Hurst, A. W. & Sherburn, S. Volcanic tremor at Ruapehu: characteristics and implications for the resonant source. N.Z. J. Geol.
Geophys. 36, 475–485 (1993).
38. Jaupart, C. & Allègre, C. Gas content, eruption rate and instabilities of eruption regime in silicic volcanoes. Earth Planet. Sci. Lett.
102, 413–429 (1991).
39. Jupp, T. E., Pyle, D. M., Mason, B. G. & Dade, W. B. A statistical model for the timing of earthquakes and volcanic eruptions
influenced by periodic processes. J. Geophys. Res. Solid Earth 109, B02206 (2004).
40. Tolstoy, M. Mid-ocean ridge eruptions as a climate valve. Geophys. Res. Lett. 42, 1346–1351 (2015).
41. Goring, D. G. & Walters, R. A. Ocean-tide loading and Earth tides around New Zealand. N. Z. J. Mar. Freshwater Res. 36, 299–309
(2002).
42. Ray, R.D., & Sanchez, B.V. Radial deformation of the Earth by oceanic tidal loading. NASA Tech. Memo TM-100743, Goddard Space
Flight Center, Greenbelt, MD, United States, p. 50 (1989).
43. Custodio, S. I. S., Fonseca, J. F. B. D., d’Oreye, N. F., Faria, B. V. E. & Bandomo, Z. Tidal modulation of seismic noise and volcanic
tremor. Geophys. Res. Lett. 30, 1816 (2003).
44. Christenson, B. W. Convection and stratification in Ruapehu Crater Lake, New Zealand: implications for Lake Nyos-type gas release
eruptions. Geochem. J. 28, 186–197 (1994).
45. Hurst, A. W. Shallow seismicity beneath Ruapehu Crater Lake: results of a 1994 seismometer deployment. Bull. Volcano. 60, 1–9
(1998).
Acknowledgements
Authors thank GNS Science for the availability of their data (raw data are openly available in the Geonet-GNS
archive [http://magma.geonet.org.nz/resources/network/netmap.html, DRZ station]). Authors also thank Greg
Steenbeeke for allowing us to use his photo of Ruapehu (Fig. 1a). T. Girona would like to thank F. Schwandner
and E. Llewellin for discussions and comments on the topic of this paper. T. Girona and C. Huber were supported
by National Science Foundation CAREER Grant (1454821). T. Girona is currently supported by an appointment
to the NASA Postdoctoral Program at the NASA Jet Propulsion Laboratory, administered by Universities Space
Research Association under contract with NASA. C. Caudron is supported by an FNRS postdoctoral grant.
Author Contributions
T.G. and C.H. conceived the project. C.C. led the processing of the data, T.G. led the analysis of the data, and T.G.
and C.H. led the theoretical analysis. T.G., C.H. and C.C. wrote the manuscript, designed figures, and discussed
the model, results, and conclusions.
Additional Information
Supplementary information accompanies this paper at https://doi.org/10.1038/s41598-018-19307-z.
Competing Interests: The authors declare that they have no competing interests.
Publisher's note: Springer Nature remains neutral with regard to jurisdictional claims in published maps and
institutional affiliations.
Open Access This article is licensed under a Creative Commons Attribution 4.0 International
License, which permits use, sharing, adaptation, distribution and reproduction in any medium or
format, as long as you give appropriate credit to the original author(s) and the source, provide a link to the Cre-
ative Commons license, and indicate if changes were made. The images or other third party material in this
article are included in the article’s Creative Commons license, unless indicated otherwise in a credit line to the
material. If material is not included in the article’s Creative Commons license and your intended use is not per-
mitted by statutory regulation or exceeds the permitted use, you will need to obtain permission directly from the
copyright holder. To view a copy of this license, visit http://creativecommons.org/licenses/by/4.0/.
© The Author(s) 2018
ScIEnTIfIc ReporTS | (2018) 8:1476 | DOI:10.1038/s41598-018-19307-z 9You can also read