TOOL FOR RAPID ASSESSMENT OF CITY ENERGY - BOGOTÁ, COLOMBIA
←
→
Page content transcription
If your browser does not render page correctly, please read the page content below
TOOL FOR RAPID ASSESSMENT OF CITY ENERGY – BOGOTÁ, COLOMBIA

                                                              1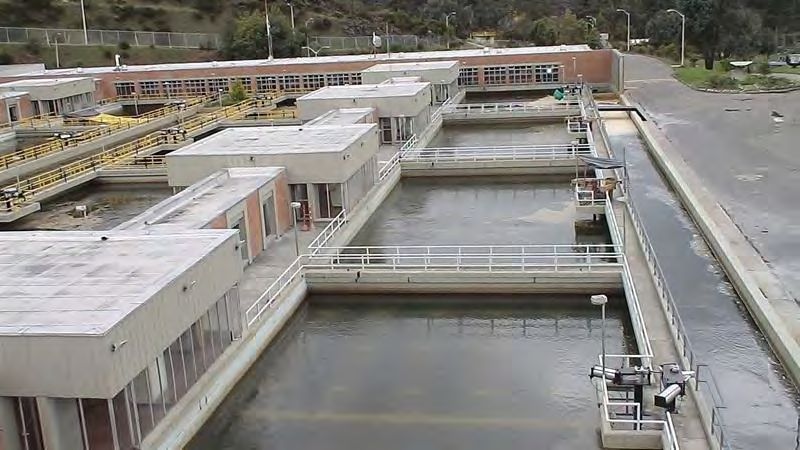
(Disclaimer)
                   Table of Contents

                    Executive Summary / 1
                      Methodology / 6
                      Background / 9

                Bogotá Sector Diagnostics / 13
                     Power Sector / 14
                    Urban Transport / 17
                    Street Lighting / 26
                    Water Sector / 29
                    Solid Waste / 36
                 Municipal Buildings / 39

        Energy Efficiency Recommendations / 41
                     Street Lighting / 42
Active Water Leakage Detection and Pressure Management / 44
               Awareness Raising Campaign / 45

                      Annexes / 48

                                                              TRACE (Tool for Rapid Assessment of City Energy) was
                                                              developed by ESMAP (Energy Sector Management Assistance
                                                              Program), a unit of the World Bank, and is available for
                                                              download and free use at: http://esmap.org/TRACE.

                                                                                                                         1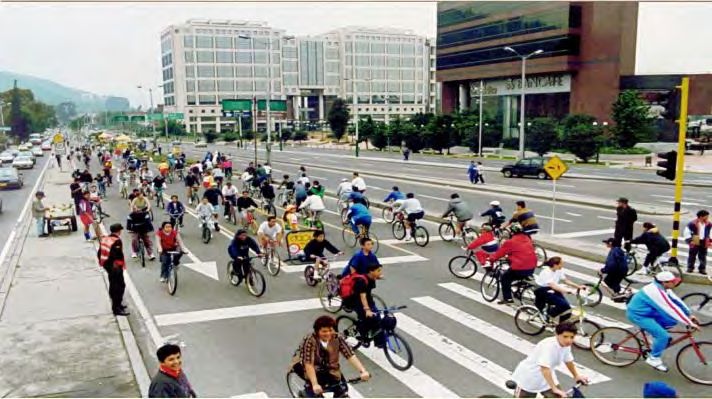
1
Executive Summary                                                                many cities around the world, the six TRACE sectors are under municipal
                                                                                 jurisdiction, however, in LAC, city authorities sometimes have only a
This report, supported by the Energy Sector Management Assistance                limited degree of influence over sectors such as transport, electricity,
Program (ESMAP), utilizes the Tool for the Rapid Assessment of City              water, and sanitation.
Energy (TRACE) to examine urban energy use in Bogotá, Colombia. This
study is one of three that were requested by the cities, and undertaken in       In consultation with local authorities in Bogotá and based on sector
2013 by the World Bank’s Latin America and the Caribbean (LAC) Energy            analyses carried out by local consultants, a number of recommendations
Unit (the others being León and Puebla in Mexico), with the intention of         were generated through the TRACE analysis to help the municipality
beginning a dialogue on energy efficiency potential in municipalities in the     improve the efficiency of energy use in the provision of urban services.
Region. The implementation of TRACE in Puebla and León contributed to            The three sectors identified in Bogta with the highest savings potential
the development of the urban energy efficiency strategy by the Mexican           and where the local administration has a significant degree of control are:
Secretary of Energy (SENER).                                                     public transport, street lighting, and potable water. A summary of all six
                                                                                 sectors that were evaluated are discussed below along with the principal
The Tool for Rapid Assessment of City Energy (TRACE) is a simple and             recommendations.
practical tool for conducting rapid assessments of energy use in cities. The
tool helps prioritize sectors with significant energy savings potential, and     Overview of energy use in Bogotá
identifies appropriate energy efficiency (EE) interventions across six
sectors - transport, municipal buildings, water and wastewater, street           Two-thirds of the overall energy consumption related to TRACE areas is
lighting, solid waste, and power & heat. In many cities around the world,        used by public and private transport, while almost one third by the power
these six sectors are often managed by the city government, and as such          sector. The rest of two percent is divided between street lighting (one
local authorities have a large degree of influence over public utility           percent), water sector and municipal buildings. Since the Municipality of
services. TRACE is a low-cost, user-friendly, and practical tool that can be     Bogotá did not provide the fuel consumption related to waste collection
applied in any socioeconomic setting. It allows local authorities to get a       and management, the energy analysis pertaining to public utility services
rapid assessment of their city’s energy performance, and to identify areas       under the city government did not include solid waste sector. As
where a more in-depth analysis is warranted. The TRACE tool includes             elsewhere in the world, the transport sector requires a large amount of
approximately 65 specific energy efficiency interventions, based on case         energy to fuel private vehicles and buses operating in the city. Assuming
studies and best practices around the world. The TRACE tool is targeted          the data on water sector energy consumption is accurate, the relatively
primarily at local authorities and local public utility service companies, but   low level can be explained by the fact that water delivery is largely
it could also be useful for state or federal authorities in order to increase    gravitational from elevated reservoirs, and the fact that only 25 percent of
their knowledge on how to make municipalities more energy efficient by           the wastewater in Bogotá receives primary treatment. More than a third
developing EE strategies.                                                        of the electricity consumption in Bogotá is used by the residential sector,
                                                                                 while industry accounts for 32 percent and commercial sector for 26
Because the TRACE assessment is rapid, there are limitations in the depth        percent. The street lighting and municipal buildings sectors require about
of the analysis. Recommendations made by TRACE should therefore be               5 percent of overall electricity consumption.
viewed as an indication of what could be done to improve the city’s
energy performance and reduce their energy expenditures. The tool does
not currently assess the residential, industrial, or commercial sectors. In

                                                                                                                                                                1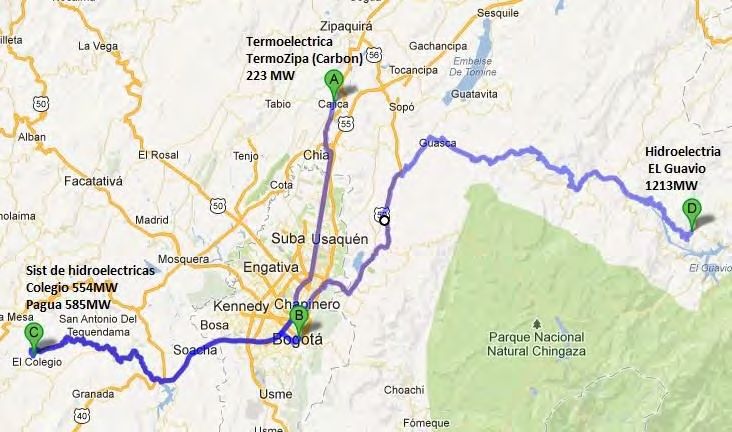
Public Transport Development - Continue expanding the BRT network and
                                                                               the integration of BRT buses with SITP and traditional buses.
                                                                               Non-motorized Transport Modes - Expand the cycling lanes and pedestrian
                                                                               network in order to encourage NMT as both feeder systems for public
                                                                               transport and as options for short trips.

                                                                               STREET LIGHTING – In the last year, local authorities in Bogotá have been
                                                                               working on an initiative to improve street lighting in the city by replacing
                                                                               old mercury bulbs with more energy efficient sodium vapor and LED
                                                                               lamps. Overall, there are approximately 330,000 street lamps in Bogotá,
                                                                               with 100 percent coverage, including in low-income neighborhoods.
                                                                               Despite good street lighting coverage, the quality of service is not always
                                                                               good. Although the energy consumption per kilometer of lit streets is low
TRANSPORT - A pioneer in sustainable transport initiatives in Latin            (11,672 kWh), public lighting requires a large amount of electricity, which
America, Bogotá developed a Bus Rapid System in 2000, which has                translates into high costs to the city. A large project replacing 33,000
become a model for the country, region, and world. In addition to the BRT      sodium vapor bulbs with LEDs is expected in the near future, an initiative
system known as TransMilenio, the public transport network includes the        that is expected to reduce energy consumption by 30 percent and
integrated public transport system (SITP) and traditional buses. 43 percent    enhance the quality of street lighting in the city. The tender for the first
of the daily commutes in Bogotá are made by public transport. However,         LED lamps is under way and the first batch of 11,000 highly energy
in recent years, the quality of public transport service has declined due in   efficient bulbs should be implemented by 2015. In the short- to medium-
large part to traffic congestion. Currently, city managers are stepping up     term, there are several interventions that can be done to improve the
efforts to expand the BRT network and modernize the SITP fleet, and            efficiency of public lighting:
integrate TransMilenio with SITP buses. There are over 1,500,000 cars in       •Procurement Guide for New Street Lights - Produce a specific
Bogotá, which makes private transport energy intensive, thereby                procurement guide for public lighting and choose an efficient solution
contributing to traffic congestion and pollution in the city. Although the     based on modern, efficient technology when replacing the lights.
city has undertaken some initiatives meant to reduce the use of cars, such     •Street Lighting Timing Program - A light dimming program allows street
as pico e plata (restricting both private and public vehicles based on the     lights to be adjusted for specific needs in a particular area, according to
last digits of the license plate), private transport has continued to          varying weather and/or activity levels (more light is needed in the
increase. The city has a good non-motorized transport (NMT) network,           evenings when people are out than in the early morning hours when there
including 376 kilometers of bike lanes. However, not all of them are in        is less activity on the streets).
good shape, and some are not interconnected. The city is currently             •Street Lighting Audit - Conduct an audit of all street lamps in the city.
expanding its NMT network by building bike lanes and bike stations where       •Street Lighting Retrofit - Undertake the renovation of street lamps with
people can rent or park their bicycles. City managers are also planning to     more efficient technology that can deliver the same lighting levels with
further integrate NMT with the broader public transport system. Some of        lower energy consumption, reducing associated carbon emissions and
the energy efficiency initiatives that could be considered by the local        operational expenditures. The cost of LED technology has fallen to the
authorities include:                                                           point that it is the optimal choice today for street lighting, but the
                                                                               financial savings depends on the vintage and efficiency of existing lighting.

                                                                                                                                                               2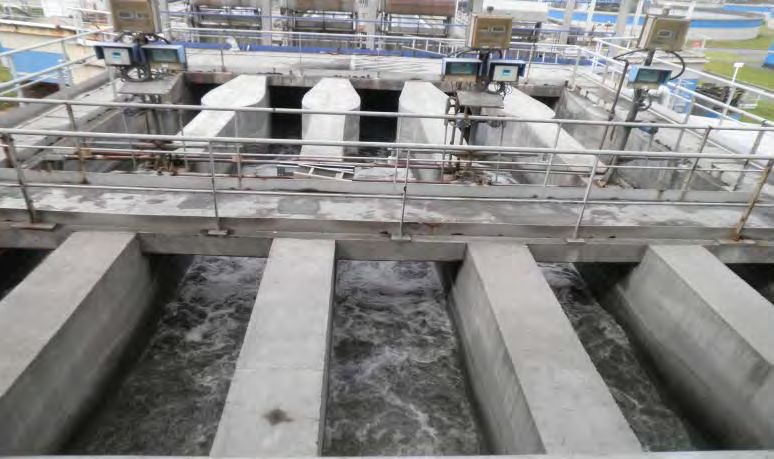
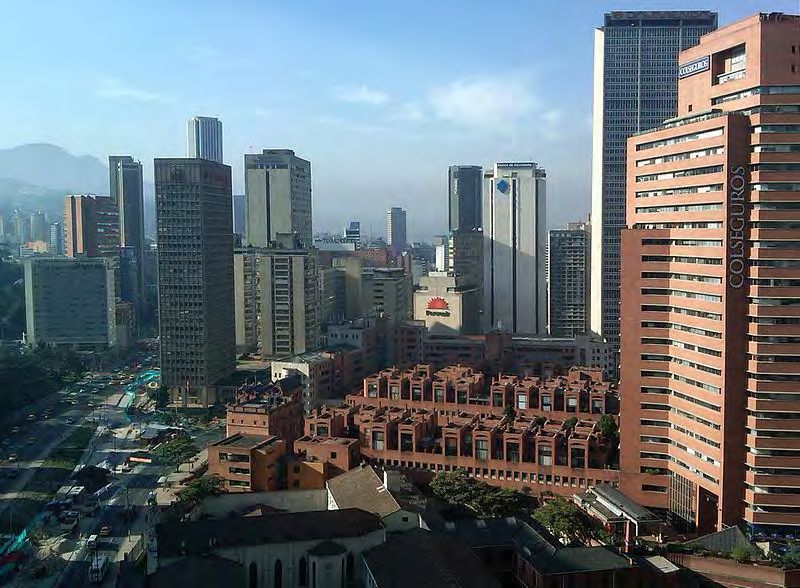
WATER SECTOR - The water and sanitation is managed by a public                 capita, Bogotá compares favorably to other cities in the TRACE database
company under the local government. The water comes through a                  with similar climate. The city is also performing well in terms of overall
gravitational system from the rivers in the mountains, thus requiring small    losses in the system. Similar to water and solid waste, the power service is
energy for pumping and treatment activities. With 100% water coverage          stratified according to the location of the customer’s residence and
in the city, Bogotá has a total of 1.8 million water connections, of which     income, with rich communities subsidizing the electricity bills of lower-
1.6 million in the residential sector. Annually, more than 477 million cubic   income consumers.
meters is produced, of which only 273 million cubic meters is actually sold
to the customers (the rest being lost or not billed). On average, the city     SOLID WASTE - The solid waste sector in Bogotá is managed by both
uses 93.98 liters per capita per day. The water sector in Bogotá is one of     private and public companies. Bogotá generates 6,732 tons of waste daily,
the most efficient in the TRACE database, recording 0.23 kWh/ cubic            which represents 322 kg of solid waste per capita, a figure that places
meter, one of the lowest energy consumptions for treating potable. The         Bogotá in the middle of the TRACE database compared with cities with a
TRACE analysis did not consider the energy used for irrigation and             similar Human Development Index. Like many cities in the region, Bogotá
stormwater management, as it took into account only electricity                does not have a selective collection system, and only 5.5 percent of solid
consumed for municipal water and wastewater. In the future, the local          waste in the city is recycled. As in the water sector, higher-income groups
government and the water utility company should join efforts to reduce         subsidize the waste collection tariffs for low-income communities.
some of the 35 percent losses in the system, which occur mainly due to         Recently, the city replaced some of the waste trucks with more efficient
old, poorly insulated pipes. The high-income communities subsidize the         vehicles. Today, 30 percent of the new waste fleet runs on natural gas,
water tariffs for low income groups. Only 25 percent of the wastewater is      and some comply with Euro 4 emission standards. The landfill, located 20
treated, while the rest is discharged into the rivers, thus increasing water   kilometers from the city, is one of the largest of its kind in Latin America,
pollution. The city is addressing this issue through the construction of new   and is equipped with a leachate treatment plant and biogas collection
wastewater treatment capacity that will provide 100 percent treatment by       facilities managed by third parties. Under the Basura Cero program (Zero
2018. The energy consumption for treating wastewater should also               Waste), the city is undertaking an ambitious initiative to reduce the
increase, from the existing 0.05 kWh/cubic meter related to the 25             amount of waste dumped at the landfill by 2025 with a major increase in
percent of the wastewater treated, to approximately 0.3 kWh/cubic meter        recycling.
in the future. The energy efficiency measures recommended by TRACE to
improve the water sector include:                                              MUNICIPAL BUILDINGS - The municipal buildings stock comprises 1,664
Active Leak Detection Program - Implement a program to identify and            buildings, including 734 educational units, 91 public offices, and 172
repair leaks in the water system.                                              healthcare facilities, in addition to a number of sports and cultural offices.
Pressure Management - Enforce a program that could help reduce the             The municipal facilities are managed by each of the 20 sub-districts in the
treatment and pumping costs by minimizing the required delivery                city, under the coordination of the Municipality of Bogotá. However, as in
pressure and leakages in the water pipes.                                      many cases worldwide, the city does not have reliable data on the overall
                                                                               floor space and energy consumption of municipal buildings. Due to mild
POWER SECTOR – The power sector in Bogotá is managed by the local              climate, the buildings do not require heating or cooling. According to the
electricity provider, Codensa, a joint venture between the public and          TRACE analysis performed on a sample of six public offices, the energy
private sectors. Electricity is produced by a network of hydropower plants     consumption of 98 kWh of electricity per square meter is higher than
located outside the city with an overall installed capacity of 2,575 MW.       some of the cities in the TRACE database. The city could improve the
There are nearly 1.8 million households with power connection in Bogotá.       efficiency of the municipal buildings sector by employing a few easy,
With a primary electricity consumption of 1,217 kWh of electricity per

                                                                                                                                                                3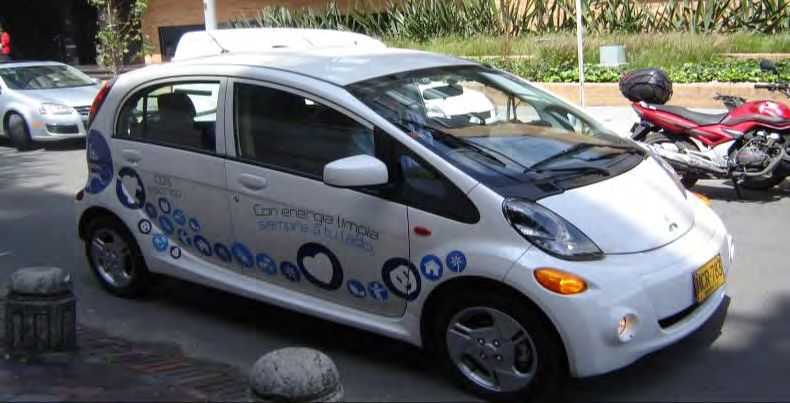
accessible measures, such as a benchmarking program, in addition to
some retrofits.

The matrix below presents the public utility sectors identified by TRACE
with the highest energy saving potential and the interventions local
authorities should consider undertaking in order to reduce consumption
and improve overall efficiency of the city. These interventions can be
implemented over one or two years, and would require upfront
investments between US$100,000 and US$1 million.

                                                                           4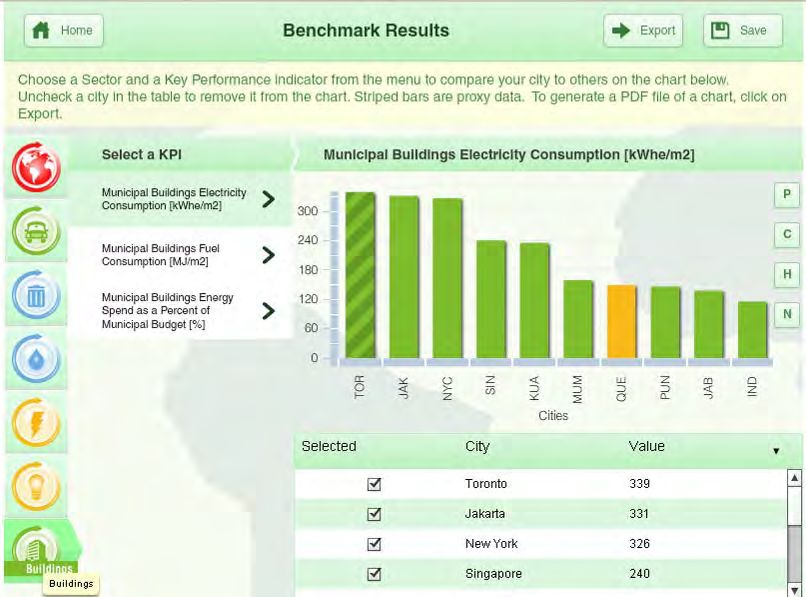
Matrix with energy efficiency priorities and proposed programs
         PRIORITY 1                          Energy spending in the sector           Potential savings
        Public Transport                            $917,935,197                      $165,000,000
                                                                              Energy
                                               Responsible                                      Time of
                                                                     Cost     savings
                                                Institution                                 implementation
                                                                             potential
                                              Department of
                                                                     $$$       ***               > 2 years
1. Public Transport Development               Transportation
         PRIORITY 2                          Energy spending in the sector           Potential savings
        Private Transport                           $1,390,516,286                    $295,000,000
                                                                              Energy
                                               Responsible                                       Time of
                                                                     Cost     savings
                                                Institution                                 implementation
                                                                             potential
2. Non-Motorized Transport Modes                   City             $$$          **             > 2 years
         PRIORITY 4                          Energy spending in the sector          Potential savings
         Street Lighting                             $32,850,000                       $6,800,000
                                                                              Energy
                                               Responsible                                       Time of
                                                                     Cost     savings
                                                Institution                                 implementation
                                                                             potential
3. Street Lighting Audit and Retrofit         City/Codensa           $$         ***             1-2 years
4. Procurement Guide for New Street Lights    City/Codensa           $          ***              < 1 year
5. Street Lighting Timing Program             City/Codensa            $        ***               < 1 year

         PRIORITY 5                          Energy spending in the sector           Potential savings
         Potable Water                               $12,415,011                       $1,390,000
                                                                              Energy
                                               Responsible                                       Time of
                                                                     Cost     savings
                                                Institution                                 implementation
6. Active Leak Detection & Pressure                                          potential
Management                                      Acueducto           $$$         ***             > 2 years
         PRIORITY 5                          Energy spending in the sector          Potential savings
          City Authority                                 N/A
                                                                              Energy
                                               Responsible                                       Time of
                                                                     Cost     savings
                                                Institution                                  implementation
                                                                             potential
7. Awareness Raising Campaign                      City               $         **              1-2 years

                                                                                                              5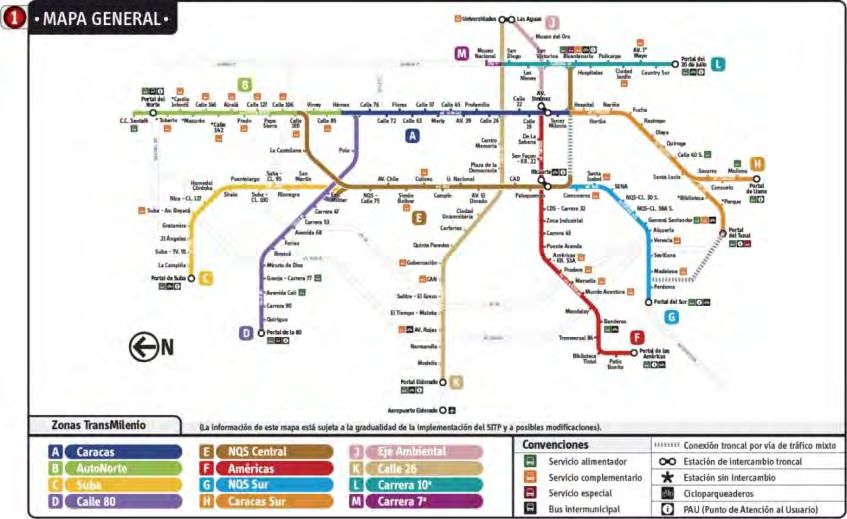
Methodology                                                                      higher the number of cities in the database, the more reliable and
                                                                                 representative the final results will be.
The Tool for Rapid Assessment of City Energy (TRACE) helps prioritize
sectors with significant energy savings potential, and identifies                3. Assessment and Ranking of Individual Sectors
appropriate energy efficiency (EE) interventions across six sectors -            During the initial city visit, a number of meetings and interviews are
transport, municipal buildings, water and wastewater, street lighting, solid     conducted to collect additional data across city departments and
waste, and power & heat. It consists of three principal components: (i) an       agencies, augmenting benchmarking results with contextual
energy benchmarking module which compares key performance                        information. At the end of the first phase, a prioritization process takes
indicators (KPIs) among peer cities (ii) a sector prioritization module          place to identify sectors with the greatest technical energy savings
which identifies sectors that offer the greatest potential with respect to       potential. Energy costs are also weighed, as is the ability of city
energy-cost savings, and (iii) an intervention selection module which            authorities to control or influence the outcome. Priority sectors are
functions like a “playbook” of tried-and-tested energy efficiency                reviewed in detail in the second phase.
measures. These three components are woven into a user-friendly
software application that takes the city through a series of sequential                                 The main frame of TRACE
steps: from initial data gathering to a report containing a matrix of first-
order energy efficiency recommendations tailored to the municipality’s
individual context, with implementation and financing options. The steps
in the TRACE analysis are as follows:

1. Collection of Candidate City Energy Use Data
TRACE contains a database of 28 key performance indicators (KPIs)
collected from 80 cities. Each of the data points that make up these
KPIs is collected for the municipality prior to the application of the tool
and, as TRACE is launched, this collection of information will grow with
current and reliable data.

2. Analysis of City Energy Use Against Peer Cities
The performance of a city is compared with a range of peer cities—
selected by the city based on population, climate, and human
development—to determine their performance in each of the six sectors
(3-6 KPIs per sector). The benchmarking process provides an overview of
energy performance so that the city can assess its relative rankings against
peer cities in each sector. The Relative Energy Intensity (REI), or in simpler
terms the percentage by which energy use in a particular sector could be
                                                                                 4. Ranking of Energy Efficiency Recommendations
reduced, is calculated using a simple formula. The formula looks at all of
                                                                                 TRACE contains a playbook of over 60 tried and tested energy
the cities that are performing better on certain KPIs (e.g., energy use per
                                                                                 efficiency recommendations in each of the sectors. Some examples
street light), and estimates the average improvement potential. The
                                                                                 include:

                                                                                                                                                              6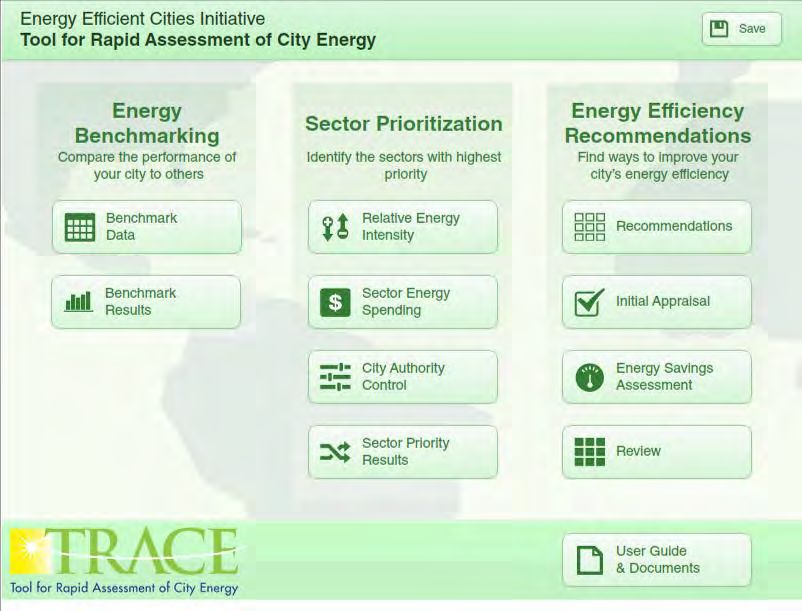
Buildings | Lighting Retrofit Program cost), with an additional filter that enables the user to sort
Organizational Management | Energy Efficiency Task Force, recommendations based on the speed of implementation.
Energy Efficient Procurement Recommendations in each priority sector are quantitatively and
Power & Heat | Solar Hot Water Program on Buildings qualitatively evaluated based on key data, including institutional
Public Lighting | LED Replacement Program for Traffic Lights requirements, energy savings potential, and co-benefits. The
Transport | Traffic Restraint in Congested Urban Areas, City Bus recommendations are supported by implementation options, case studies,
Fleet Maintenance and references to tools and best practices.
Waste | Waste Management Hauling Efficiency Program
Water & Wastewater | Pump Replacement Program 5. Report Preparation and Submission
A Final City Report incorporates the various sections outlined above along
The TRACE Benchmarking Module with the review of the findings and recommendations by city authorities.
The intention of the TRACE report is to identify, together with the city,
high-priority and near-term actions to improve the energy efficiency and
overall management of municipal services.
The report includes:
City background information, such as city contextual data, key city
development priorities, energy efficiency drivers, and barriers.
An analysis of the six sectors, including a summary of the
benchmarking results.
A summary of sector prioritization based on the city’s objectives.
A draft summary of recommendations provided in the City Action
Plan.
An Annex including more in-depth information on energy efficiency
options and best-practice case studies.
The limitations of TRACE
The fact that TRACE is simple and easy to implement, also means that
there are limitations with respect to the depth of analysis. For example,
the tool may identify Street Lighting as the a priority sector in terms of
potential energy savings, but it does not go into city specific details on the
Recommendations are then assessed based on five different factors: required costs to undertake street lighting rehabilitation projects. Thus,
finance; human resources; data and information; policy, regulation and even if the energy savings potential is assessed to be high, the costs may
enforcement; and assets and infrastructure. This step helps cities better be even higher, and an investment in the sector may not be warranted.
assess potential measures that are within its capacity to implement Similarly, although TRACE specifically focuses on the service areas that fall
effectively. TRACE then allows recommendations to be plotted on the within the purview of local authorities, the tool cannot factor in the
basis of two attributes in a 3x3 matrix (energy savings potential and first institutional and legislative mechanisms that may be needed to
implement specific energy efficiency specific recommendations.
7The TRACE assessments have been very relevant in cities in
Eastern Europe and CIS countries, where most of public utility services are
under the city government and thus the local public administration has a
high-degree of control over the TRACE sectors. In other parts of the world,
such as in Latin America, there is less municipal control over the TRACE
sectors, either because they are managed at a state or federal level, or
because the service is provided under contract by a concessionaire. In
2013, TRACE was implemented in seven largest cities in Romania where
important utility services, such as public transport, district heating, street
lighting but also municipal buildings are under the local government. In
some cases, even if operation and maintenance of a certain sector is
outsourced to a private concessionaire (as it is the case of street lighting),
the municipality owns the related infrastructure and can make decisions
over the sector. In Romania, the TRACE studies helped the local
authorities and national government prepare local energy efficiency
measures to be implemented with support from funds from the European
Union, with the scope of reducing greenhouse gas emissions (GHG) and
energy related costs, as part of Europe 2020 Strategy with the objective of
reducing GHG emissions by 20 percent over the next few years.
8Background country’s GDP is contributed by services, 37.8 percent by industry, while
agriculture accounts for only 6.6 percent. Colombia has been struggling to
A middle income country and the third largest economy in Latin America, overcome poverty, with almost one-third of the population living below
Colombia is located on the northwestern coast of South America, the poverty line. The country is part of the CIVETS group of six leading
bordering Panama in the northwest, Venezuela and Brazil in the east, emerging markets that includes Indonesia, Turkey, Egypt, Vietnam, and
Ecuador and Peru in the south, the Pacific Ocean in the west, and the South Africa. Colombia has a Free Trade Agreement with the United
Caribbean Sea in the north. One of the 17 mega bio-diverse countries in States, and has signed or is negotiating similar accords with a number of
the world (it ranks first in bird species), Colombia is spread over 1.1 million European and Asian states.
square kilometers, and is home to 47 million people (2014 estimate). It is
the third most populous country in Latin America (after Mexico and According to official estimates, the most populous cities in
Brazil), and home to the second largest number of Spanish speakers in the Colombia are the following:
world (after Mexico).
City 2010
The country has a diverse geography that comprises six natural Bogotá 7,776,845
regions, including mountains, plains, sea & ocean, islands, and coastal Medellín 2,441,123
areas. Colombia has a tropical climate along the coastlines and eastern Cali 2,344,734
plains, and cooler weather in the east. Most urban centers are located in Barranquilla 1,212,943
the highlands of the Andes Mountains, the Amazon rainforest, tropical Cartagena 990,179
grasslands as well as on the Pacific and Caribbean coasts. Cúcuta 643,666
Soledad 599,012
A constitutional republic comprising 32 departments and the Ibague 548,209
capital district of Bogotá, Colombia has experienced armed conflict since Bucaramanga 527,451
the mid-1960s involving the government, paramilitary, crime-syndicates, Soacha 500,097
and left-wing guerilla groups who are fighting to increase their influence
over the country’s territory. The conflict reached its peak in the 1990s, Located in the central part of Colombia on the Bogotá River, at 2,640
and has decreased considerably since the year 2000. meters above sea level, Bogotá is the capital of the country and also the
capital of the department of Cundinamarca. One of the largest cities in
th
In 2012, Colombia’s Human Development Index was 0.719. Latin America and the 30 biggest in the world, Bogotá has a population
According to the World Bank GINI index, the income inequality ratio in of around 7.6 million (according to official figures in 2012), an increase of
Colombia in 2010 was 55.6 (where 0 is perfect equality and 100 is perfect 10 percent compared to the 2005 census. The city is spread across roughly
inequality). The country’s economy relies heavily on natural resources (oil, 1,600 square kilometers, with a density of approximately 4,800
gas, coal, minerals, agriculture, forestry), in addition to chemicals, food inhabitants per square kilometer. The metropolitan area comprises
processing, health related products, textiles, and electronics, as well as several localities with a total population of 10.7 million. Bogotá has
military and metal products. Colombia is the world’s fourth largest coal several airports, including the El Dorado International Airport, which is the
exporter and the fourth largest oil producer in Latin America. Real GDP principal hub for domestic and international flights.
has increased by 4 percent annually in the past several years, continuing a
decade of strong economic performance. Today, 56 percent of the The city has a subtropical highland climate, with an average
temperature of 14.5°C. The driest months are December, January, July,
9and August while the rainiest months are April and May, and from Bogotá is the key economic and industrial center of Colombia,
September through December. The warmest month is usually March, and one of the major destinations of the imports of capital goods,
when the temperature can reach 20°C. While temperatures are fairly accounting for 26 percent of the national GDP. The local economy relies
consistent throughout the year, weather conditions are unpredictable and predominantly on the service sector and real estate activities (15 percent),
can change radically during the course of a single day, due to the El Niño followed by commerce (13 percent), and industry (12 percent). Other
and La Niña phenomena. important sectors are financial services, healthcare, construction, and
telecommunications. The unemployment rate is 9.5 percent.
The city comprises some 20 localities or districts which form an
extensive network of neighborhoods, including: Usaquén, Chapinero, Population density in Bogotá
Santa Fe, San Cristóbal, Usme, Tunjuelito, Bosa, Kennedy, Fontibón,
Engativá, Suba, Barrios Unidos, Teusaquillo, Los Mártires, Antonio Nariño,
Puente Aranda, La Candelaria, Rafael Uribe, Ciudad Bolívar, and Sumapaz.
One-quarter of the municipal area is rural. Most of the high-income
communities are located in the northern and northeastern parts of the
city, close to the foothills of the Eastern Cordilliera. Most of the rural
communities are based in the south, home to some of the poorest
districts.
Rural and urban areas in Bogotá
Often referred at as the Athens of South America, Bogotá is home to a
large number of universities and libraries, and has an extensive
educational system of primary and secondary schools and colleges.
National Legislative Framework on Energy Efficiency
The electricity sector in Colombia was liberalized in 1994, and is divided
into four branches: power generation, transmission, distribution, and
retail/trade. The Public Service Law (L-142, 1994) liberalized the sector
and opened it to competition in the four branches. The Ministry of Energy
and Mines (MEM) is responsible for sector planning and policy. The
The highest population density is in the south and southwest, where most Regulatory Commission for Energy and Gas (CREG) is responsible for
low-income communities live. Conversely, the northern area, which is the setting electricity and gas tariffs and regulating the respective markets.
home to the wealthiest groups, has the lowest density. The industrial and The electric system is operated by an independent agency that is
commercial areas, as well as the financial district, are located in the responsible for managing the electricity grid and power plants. All power
northern and downtown areas. producers must sell energy on the market.
10The country’s National Development Plan for the period 2010- Energy production in Colombia from 1970s to 2000s
2014 requires the government to prepare an action plan to implement the
Rational and Efficient Use of Energy Program (PROURE) aimed at reducing
energy consumption by 3 percent and promoting the use of renewable
1
energy. The action plan includes a number of measures, such as
development of energy projects from non-conventional sources,
reduction of energy losses, incentives for employing clean technologies,
and the efficient use of energy in various sectors (e.g., commercial,
residential and transport).
The country has received support from international
organizations to develop and improve energy efficiency legislation, such
as the low carbon strategy (supported by USAID, UNDP, and the World
Bank) and sustainable building codes (with support from the IFC). Natural gas is used mostly by the residential sector (for cooking water
heating), in addition to power generation and transport.
Energy production in Colombia has increased over that last two
decades, especially for oil and coal. Oil production increased from 60,000 Share of total primary energy supply in 2009
to 80,000 ktoe between the late 1990s and 2005, while coal production
doubled during the same period of time. The country imports refined oil
products, since internal refining capacity is insufficient to cover domestic
demand. Oil accounts for the largest share of total energy supply,
followed by natural gas and hydropower. The transport sector is the
largest energy consuming sector, and largest consumer of petroleum
products (gasoline and diesel).
Electricity generation expanded in the past decade from 41,278 GWh in
2000 to almost 57,000 GWh in 2010.
1
National Development Plan 2010-2014
11Electricity generation in Colombia between 1998 and 2010 Electricity generation by source between 1998 and 2010
Almost two-thirds of the country’s installed power capacity is based on
Transmission and distribution losses amounted to 18.5 percent in 2009, a
hydro, 31.5 percent on fossil fuel (natural gas, coal, oil), and 4.4 percent
on small power plants consuming a range of fuels. 65 percent of electricity decrease from the 2005 peak of 21.2 percent.
generation is from hydropower plants and 20 percent from natural gas
plants. Natural gas for electricity production has gone up over the past Percentage of losses in the electrical system
two decades following several dry years that severely impacted
hydropower production. The government has been encouraging power
generation “firm” energy sources that are less affected by the weather,
including fossil fuels, and renewables (geothermal and biomass). A
degasification terminal for Liquefied Natural Gas is currently being built in
Colombia so as to increase the consumption of natural gas in the country
to meet growing energy demand.
12Local Initiative Regarding Energy Efficiency in Bogotá The Level of Authority of Federal Government and Local
Authorities regarding Public Utility Services
The Bogotá Development Plan “Bogotá Humana” aims to improve human
development in the city, giving priority to the children and adolescents. Public services in Bogotá are managed by a combination of Federal and
The plan focuses on three objectives: reducing segregation and Municipal oversight.
discrimination; responding to climate changes and securing water; and
defending and strengthening the public sector. Transport - This sector is managed by the city government through the
Department of Transportation. Some of the large projects require
The strategy related to climate change emphasizes the promotion of financial support from the national government.
public transport, expanding non-motorized transport modes, and Waste - The local government coordinates solid waste collection and
increasing the use of renewable energy. Additionally, the Plan includes a management activities. The national government is responsible for
series of actions to promote the efficient use of natural resources, hazardous and biological wastes.
including the reduction in the generation of solid waste generation and Water - The water sector is managed by a company under the city
the increase in recycling, and increasing the efficiency of urban services. government. However, water policies and tariffs are established at the
local and national level.
Power – The power sector is managed by the local electricity provider,
Codensa, a public-private entity. Electricity tariffs are set at the national
level by the Regulatory Commission for Energy and Gas (CREG).
Street Lighting - The street lighting system in Bogotá is operated by
Codensa, the electricity company, with supervision from the local
government. Codensa also owns the street lighting infrastructure.
Municipal Buildings - Municipal buildings in Bogotá are managed by the
20 local districts authorities.
13Bogotá Sector Diagnostics
14Electricity is produced by a network of three power plants
Power Sector The electricity provider in Bogotá is Codensa, a public- located outside the city with an overall installed capacity of 2,575 MW.
private company whose major stakeholder is Edensa, a One of the facilities comprises two hydro-plants, Colegio and Pagua,
public entity with shares held by the municipal government. The other respectively, located along the Bogotá River, with an installed capacity of
important stakeholder is the Italian power group, Enel. 1,139 MW. Termozipa is a coal power plant located in municipality of
Cajica, about 40 kilometers far from Bogotá, and has an installed capacity
As of 2012, there were 1,769,398 households with power of 223 MW. Finally, the Guavio hydropower plant is 180 km northeast of
connections. The amount of electricity consumed in Bogotá accounts for Bogotá, and has an installed capacity of 1,213 MW. During El Nino events,
approximately 15 percent of the total electricity produced in Colombia. which reduce rainfall, the city is susceptible to power shortages because
of the high dependence on hydropower plants. Such situations have
prompted the country to establish a premium payment system for “firm”
energy producers, which largely benefits fossil fuel plants.
Energy consumption in Bogotá 2012
Map of the three main power plants generating energy for Bogotá
Sources: UPME and SIU
In 2012 the total electricity in the city amounted to 9,194 GWh. Overall,
electricity accounts for up to 17 percent of the total energy used in the
2
city.
The largest amount of electricity goes to residential sector (40.2 percent),
followed by commercial (31.6 percent), industry (22.2 percent), public
2
Cuadernos de Fedesarrollo, #45 - July 2013 offices (3.4 percent), and street lighting (2.3 percent).
153
(26.4 percent). The municipal government consumes 5.1 percent of the
electricity in the city.
With a primary electricity consumption of 1,217 kWh per capita,
Bogotá compares favorably to other cities in the TRACE database with a
similar climate. For example, Bogotá ranks similarly on the indicator with
Tunis and Sydney; it has a primary electricity consumption level almost
half that of Sao Paulo, and three times less than Cape Town or Budapest.
Primary electricity consumption per capita
Electricity consumption in the city has gradually increased over the past
decade, rising from 6,751 GWh in 2002, to 8,455 GWh in 2008, reaching
9,081 GWh in 2011. Consumption in the industrial sector dropped slightly
from 2008 and 2009, as some factories moved out of the city to take
advantage of lower land and operational costs. Consumption in the
commercial sector went up as a result of an increase in the number of
supermarkets and shopping malls in the city.
Electricity consumption in Bogotá in 2012
During the hot season between November and February, the city requires
more energy for cooling. Conversely, when the weather is colder, some
heating is required. In addition, more electricity is used during Christmas
and summer holidays. The main explanation for the relative low energy
consumption per capita in Bogotá is the temperate climate. Also, the
altitude of Bogotá at 2,640 meters above sea level reduces the need for
air conditioning.
The technical losses in the transmission and distribution network
are 8.39 percent, a figure that places Bogotá in the lower half of the
TRACE database compared to cities with a similar Human Development
The largest share of electricity in Bogotá is consumed by the residential 3
sector (36.3 percent), followed by industry (32.2 percent) and commerce Análisis de la situación energética de Bogotá y Cundinamarca Estudio
Fedesarrollo EEB
16Index (HDI). The losses are half those of some Eastern European cities, before reaching the subsidy limit. Those living below 1,000 meters (who
such as Iasi, Timisoara, and Craiova in Romania or Banja Luka in Bosnia presumably need more air conditioning) have a limit of 170 kWh per
and Herzegovina, and almost four times lower than in Mexico City. With month. People in the medium-high income group pay the tariff in full. The
respect to commercial losses, Bogotá has the third lowest level among city high and highest socio-economic strata pay 20 percent more in their
in the TRACE database with a similar HDI, with 1.31 percent, after Tbilisi tariffs to compensate for the subsidies to poor communities. 78 percent of
and Bangkok. the users belong to the medium-low to lowest income groups. The
average monthly consumption for the residential sector is approximately
Percent Total T& D Loss 207 kWh, which varies by income group. For example, high income
consumers use about twice as much electricity on average as low-income
consumers (kWh 337 kWh vs. 152 kWh).
Urban Transport
According to official data, 38 percent of the 9,169 Gg of CO2-equivalent in
greenhouse gas emissions in the city in 2008 were produced by the
4
transport sector. Other largest polluters in the city are solid waste sector
and construction industry (ceramic and cement).
Electricity tariffs in Bogotá are differentiated according to the type of user. The public transport system in Bogotá is managed by the Secretary of
In 2012, the commercial sector paid 286 pesos (US$0.15) per kWh of Mobility, the local transport authority of the city. The urban transport
electricity, almost same price as industry (298 pesos/kWh). Public offices system in Bogotá is composed of three main networks: TransMilenio,
pay more, i.e., 336 pesos (US$018) per kWh. For the residential sector, which operates the Bus Rapid Transit system (BRT), the integrated public
electricity and water services are stratified based on the location of the transport system (SITP), and traditional bus service. In addition, there are
household and income. Thus, wealthy communities subsidize the energy nearly 50,000 taxis in Bogotá operated by private companies.
and water bills of low-income communities. Bogotá is divided into six
socio-economic "estratos" (strata). People living in the highest, high and Between 2003 and 2011, about 25 percent of the total public
medium-high strata bear the subsidies for the other three groups, i.e., transport fleet was taken off the road in an attempt to reduce the number
lowest, low, and medium-low. of older and polluting vehicles. While the number of buses was reduced
from nearly 20,000 to 14,694, the BRT fleet has almost tripled.
People in the lowest strata receive a 60 percent subsidy, while
those in the low group receive 40 percent. People in medium-low income TransMilenio is based on a BRT network with high-capacity buses
group receive a 15 percent subsidy. The subsidies come with some operating on dedicated bus lanes. The buses are managed by private
consumption limits. Once people exceed the limit, they must pay the full
rate. For instance, subsidies for households located at 1,000+ meters in 4
Regional Inventory of GHG Cundinamarca y Bogotá - PRICC 2008
altitude have a maximum monthly electricity consumption of 130 kWh
17concessionaires under the supervision of the local transport authority. concessionaires cannot cover the operational expenses, the Municipality
According to the city managers, currently there are 1,600 BRT buses that of Bogotá finances the difference from the local budget.
can carry between 160 and 260 passengers each. TransMilenio was the
first BRT project in Colombia, and has been developed in three stages. The BRT system in Bogotá
system in Bogotá was launched in December 2000, initially with 41
kilometers of dedicated bus lanes, covering Avenida Caracas and Calle 80.
The second stage was completed in December 2012, expanding the
network by 36 kilometers, from Avenida 26 to Calle 10. With 12 lines
totaling 112 km on dedicated bus lanes and 115 stops, the BRT system in
Bogotá has become the largest such system in the world. Meanwhile,
more lanes were built on Avenida 26 covering 14 kilometers of network
from the airport to the city center, and an additional 7.7 kilometers on
Avenida 10 crossing the city from south to north. In addition to buses, the
system includes a number of pedestrian bridges, walkways, bike lanes, Source: www.sibrtonline.org
and docking stations. Electronic bulletin boards in the main bus stations
provide real time information on bus schedules and routes. The In addition to BRT, the TransMilenio network includes the "feeders",
occupancy ratio of BRT buses is 40 percent during off-peak hours and buses that connect residential areas to BRT bus stops. Currently, there are
consistently reaches 100 percent during peak hours. approximately 500 feeders operating on 90 routes connected to BRTs.
Overall, the TransMilenio network covers 663 kilometers.
The development of the BRT system was a large, ambitious
project whose total costs amounted to 2,528,501 million pesos Feeders operating in Bogotá
(approximately US$ 1.4 billion). The World Bank is financing integrated
mass transit systems that include BRT in selected medium-sized and large
cities in Colombia, building on the experiences of TranMilenio. The goal is
to improve mobility along the most strategic mass transit corridors,
provide better access by the poor through feeder services and fare
integration, and build greater institutional capacity at the national and
local levels to improve urban transport policies, urban planning and traffic
5
management.
Source: www.sibrtonline.org
Under the BRT system in Bogotá (and other cities in Colombia
where it is being developed), concessionaires purchase the buses and take
The second public transport network in Bogotá, the SITP, is operated by
care of operational and maintenance aspects, while the government is
private companies. The SITP fleet comprises of regular buses of different
responsible for the maintenance of roads and infrastructure. Passengers
capacities, from 19 to 80 people. People pay for the trip by an e-ticket,
pay for trips using electronic cards. If the money collected by BRT
and SITP operators are paid per passenger. The revenues are managed by
5
the city authorities to cover operational costs (including bus and e-
Source: http://documents.worldbank.org/curated/en/docsearch/report/60813 ticketing operators). Similarly to the BRT system, if ridership revenues are
18not sufficient to cover operational costs, the difference is made up by the However, the project has not proven to be very successful so far. Taxi
city. In addition, the City is considering providing subsidies to SITP users as companies complain that people cannot recognize the electric vehicles
a way of boosting ridership. because they are painted in a different color (blue) than regular cabs
(yellow). Also, there are only a few charging facilities available to taxi
Map of TransMilenio as of 2012 drivers.
Electric Vehicle in Bogotá
The trip by BRT bus is 1,400 pesos (US$0.73) during off peak hours and
The traditional public transportation system is an old network that has
1,700 pesos (US$0.95) in peak hours. Passengers who use traditional
been operating in Bogotá for decades. It is made of nearly 15,000 buses
buses pay around 1,400 pesos per trip. Taxis charge a minimum of 3,500
owned and operated by 66 private companies. Traditional buses cover 508
pesos (US$1.84) per trip.
routes in the city. There are generally no designated bus stops, thus
vehicles can stop whenever passengers request. Trips are paid by cash on
According to the TRACE analysis, 43 percent of the commuters
the bus. This system is quite inefficient, as buses often are old, require a
use public transport for their daily commutes. This percentage places
large amount of fuel, and operate at low average speeds. However, in the
Bogotá in the high end of the TRACE database with comparable cities.
future the city plans to replace the traditional bus system with the SITP,
Thus, more people use buses in Bogotá than in Tallinn, Ljubljana, or
which would remove old and highly-polluting buses from the roads.
Shanghai, but fewer than in Casablanca, Cape Town, or Mexico City.
There are almost 50,000 taxis in the city operated by private
There are approximately 7.7 million trips taken by all means of
companies. Most of the cars are seven years or older. The City issues the
transportation in Bogotá each day. Roughly 38 percent of the population
taxi authorization and sets the tariffs. Since 2003, the number of taxis in
in Bogotá and surrounding districts rely on traditional buses; 19 percent
Bogotá has been limited to 50,890. Currently, a pilot project of 50 electric
use private cars, 16 percent use TransMilenio, 7 percent rely on taxis; 6
taxis operated by private companies is under way. Codensa, the electricity
percent on bicycle; and 4 percent on motorcycles.
company, is providing the energy charging infrastructure. Some tax
exemptions are offered to taxi companies that use electric vehicles.
19Public Transport Mode Split The cameras are connected to the police system, for security purposes.
Operators sitting in the control room can communicate with drivers in real
time, monitor the bus speed, and instruct drivers to speed up or
slowdown in order to improve traffic flow.
Transport monitoring center
Nearly 1.6 million daily trips are taken on BRT buses. The BRT capacity has
increased steadily, from 700,000 passengers per day in 2003, to 1,672,000
6
passengers by 2011. Since it became operational in December 2000,
more than 4 billion people have used the BRT system, with an average of
nearly 200,000 passengers during rush hour.
Transport modes in Bogotá and surrounding districts
With an energy consumption of 0.64 MJ/passenger-kilometer, the public
transport system in Bogotá is quite energy intensive compared to cities
with similar Human Development Index. Bogotá ranks at the higher end of
the TRACE database, with energy consumption comparable to Jakarta and
Tehran. The city requires twice as much energy per passenger-kilometer
as Belgrade and fifty percent more than Johannesburg, but is more energy
efficient than Cebu, Mexico City, or Tbilisi.
Energy consumption public transport - MJ/passenger-km
BRT buses are equipped with GPS systems. TransMilenio monitors the
buses from a control center through 600 cameras installed across the city.
6
Técnica de Transmilenio. http://www.sibrtonline.org/es/fichas-
tecnicas/transmilenio/6
20must spend twice as much time in transit as those who drive private cars
(77 minutes vs. 40 minutes).
Currently, city authorities in Bogotá are in the process of
integrating TransMilenio and the SITP systems. This should reduce the
number of public transport vehicles in Bogotá, with high capacity buses
replacing some of the most highly-polluting traditional buses. With the
goal of improving traffic flow in the city, the local administration is
considering adjusting the work schedule for public offices and schools to
reduce traffic during rush hour. City managers are also contemplating
offering discounts to those who travel during off-peak hours.
TransMilenio lines - phases I, II & III
For the indicator of meters of road of high capacity transit, Bogotá
performs well, thanks to the lengthy BRT network. With 118.4 meters per
1,000 people, Bogotá ranks fourth in the TRACE database among cities
with a comparable Human Development Index, behind three cities in
Romania.
During the 2000s, people were very satisfied with the BRT service.
However, in recent years the quality of the services has declined. As traffic
has increased, especially in the evening, people must spend long hours on
the bus to get home. Traffic congestion in the city has resulted in the
average travel speed dropping from 27 km/hour to 19.3/hour for public
transport, and from 31 km/hour to 23 km/hour for private cars. The
average travel time has also increased, from 51 minutes per trip in 2002 to
65 minutes in 2011. BRT buses operate with an average speed of 26
km/hour, higher than other buses. Local studies reveal that public The BRT system in Bogotá has provided the foundation for the country’s
transport is more utilized by low income communities, while taxis and sustainable transport framework (National Policy on Urban Mass
private cars are more prevalent among high income communities. For Transportation Systems). The country’s national development plan for the
example, more than 65 percent of the highest socio-economic group and period 2010-2014 seeks to promote public transport and simultaneously
more than half of high income communities rely on private cars. discourage the use of private automobiles. The Inter-American Developing
Conversely, 60 percent of the lowest socio-economic stratum, more than Bank (IDB) is providing support to the implementation of the Strategic
55 percent of the low income group, and over 40 percent of the mid-low Public Transportation Systems (SETP) aimed at enhancing efficiency,
income communities rely on public transport. More than 12 percent of the affordability, quality, safety, and environmental sustainability of public
wealthiest communities in Bogotá travel by taxis, as opposed to only a few
percent among poor communities. In addition, people who ride buses
217
transport, and helped replicating the BRT in Cali. Similar BRT transport develop its first light rail network (ligeros) to operate in the northern,
systems were developed in Bucaramanga, Medellin, Barranguilla, western, and southern neighborhoods. The total cost of the project is
Cartegena, and Pereira with financial support from the World Bank. A estimated at US$2.2 billion; 70 percent of the money is to come from the
special unit within the ministry of transport, the Urban Mobility and national budget. The engineering design is estimated at US$27.8 million,
Sustainability, was created in 2012 to monitor the implementation of the with US$16.67 million in loans from the World Bank. Construction is
SETP program across the country. The national government has joined expected to start in 2015, and the first network to operate in Suba, a
efforts with local authorities to promote Integrated Mass Transport neighborhood of one million people in northern Bogotá, beginning in
Systems in cities with 600,000+ inhabitants, and Strategic Public Transport 2018. Three private companies have submitted proposals to build and
8 12
Systems in cities with a population between 250,000 to 600,000 people. operate the future light rail system under a concession contract. So far,
Currently, the World Bank is providing US$350 million financial support to two of the proposals have received the green light from the city
Colombia for the National Urban Transport Program (NUTP) that provides authorities to move forward with the feasibility study.
support to a new efficient transport system in seven cities, including
Bogotá. First metro line in Bogotá
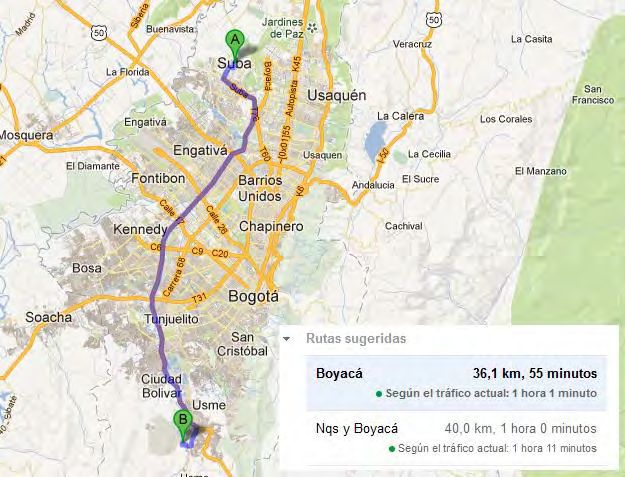
Currently, the city is focusing on a new BRT line, which should
cover 35 kilometers on Avenida Boyacá crossing the city from south to
north. The estimated value of the project is 1,563,488 million pesos
(approximately US$860 million). The new routes will bring the total BRT
9
related investments to 4,091,989 million pesos (around US$2.2 billion). In
addition to dedicated road infrastructure, the upcoming BRT project will
include new bus stops, pedestrian crossing bridges, and a number of bus
stations. Once the new lanes are complete, the system will be able to
serve nearly 2 million passengers per day.
Both the 2006 Mobility Plan and the TransMilenio development
plan outline several forward-thinking initiatives to enhance public
transport in the city, including a new metro, cable cars, and light rail
10, 11
connecting Bogotá to surrounding districts. The city is preparing to A feasibility study is under way to assess the development of 2.8
kilometers of cable car system in Cuidad Bolivar, a 700,000 neighborhood
7
http://www.iadb.org/es/proyectos/project-information-page,1303.html?id=CO- in the hilly area, that will connect it to TransMilenio in the Tunal area. The
L1091 overall cost of the project is estimated at 250 billion pesos (US$125
8
National Development Plan 2010-2014 “Prosperidad Para Todos”, Sector million).
Transporte
9
National Development Plan - Documento CONPES 3737 - Política Nacional de
Currently, the city is testing electric buses on feeder routes. A
Transporte Urbano Masivo
pilot project of 200 hybrid buses with a capacity of 80 people has recently
10
Transmilenio S.A & Alcaldia de Bogotá, Junio de 2011 - Plan marco 2010
11 12
Plan maestro de movilidad para Bogotá, Secretaria de Transito y Transporte, http://www.metroenBogotá.com/documentos-oficiales/se-destraba-la-
2006 construccion-de-la-primera-linea-del-metro-para-Bogotá
22started operating (April, 2014). Some of the feeder operators plan to Private vehicle split in 2011
approach city managers about switching to electric trolleybuses beginning Type of Private Vehicle Quantity %
in 2015.
Automobile 839,799 58%
Electric bus test drive in Bogotá Motorcycle 269,452 19%
Jeep 161,860 11%
Small Trucks 160,855 11%
Other 23,095 2%
Total 1,455,061 100%
The number of automobiles more than doubled from 2002 to 2011, from
350,000 to almost 840,000 units. At the same time, the number of
motorcycles increased from 16,397 to nearly 270,000 units. A survey
conducted in Bogotá and surrounding districts in 2012 showed that in the
northern part of the city every other person owns a car, i.e., the
“motorization rate” is more than 450 vehicles per 1,000 people. The
Private Transport motorization rate is lower in the southern and western neighborhoods at
around 150 cars per 1,000 people.
As in many cities around the world, traffic in Bogotá has deteriorated due
to the large increase in the number of private vehicles. As a result of Number of cars per 1,000 people
economic growth and a rise in individual income, an increasing number of
city residents have been able to purchase low-cost used vehicles, many of
them imported.
According to official statistics, in 2011 there were a total of
1,572,700 vehicles in Bogotá. 92 percent were private, 7 percent were
13
buses, and one percent municipal vehicles. As of 2011, there were
1,455,061 private vehicles registered in the city, of which 58 percent were
automobiles and 19 percent were motorcycles.
13
SDM - Movilidad en Cifras 2011
Local authorities in Bogotá have adopted several policies aimed at
reducing traffic and greenhouse gas emissions. Since 1998, the Pico y
Placa system (peak and license plate) restricts both private and public cars
23You can also read