Top-down control of saccades requires inhibition of suddenly appearing stimuli
←
→
Page content transcription
If your browser does not render page correctly, please read the page content below
Attention, Perception, & Psychophysics
https://doi.org/10.3758/s13414-020-02101-3

Top-down control of saccades requires inhibition of suddenly
appearing stimuli
Christian Wolf 1       &   Markus Lappe 1

# The Author(s) 2020

Abstract
Humans scan their visual environment using saccade eye movements. Where we look is influenced by bottom-up salience and
top-down factors, like value. For reactive saccades in response to suddenly appearing stimuli, it has been shown that short-latency
saccades are biased towards salience, and that top-down control increases with increasing latency. Here, we show, in a series of
six experiments, that this transition towards top-down control is not determined by the time it takes to integrate value information
into the saccade plan, but by the time it takes to inhibit suddenly appearing salient stimuli. Participants made consecutive saccades
to three fixation crosses and a vertical bar consisting of a high-salient and a rewarded low-salient region. Endpoints on the bar
were biased towards salience whenever it appeared or reappeared shortly before the last saccade was initiated. This was also true
when the eye movement was already planned. When the location of the suddenly appearing salient region was predictable,
saccades were aimed in the opposite direction to nullify this sudden onset effect. Successfully inhibiting salience, however, could
only be achieved by previewing the target. These findings highlight the importance of inhibition for top-down eye-movement
control.

Keywords Eye Movements: Mechanisms . Eye movements and visual attention

What we see is highly influenced by where we look. Where                    of visual selection (Bisley & Mirpour, 2019; Gottlieb et al.,
we direct our gaze and/or our attention can be stimulus driven              1998; Ptak, 2012; Thompson & Bichot, 2005). For example,
or driven by behavioral goals and learned reward contingen-                 neurons in LIP respond more strongly if a sudden onset stim-
cies (for reviews, see Awh, Belopolsky, & Theeuwes, 2012;                   ulus is brought into their receptive field compared with a con-
Corbetta & Shulman, 2002). Salient stimuli that suddenly ap-                tinuously displayed stimulus (Gottlieb et al., 1998), and neu-
pear in the periphery can cause an orienting response (Posner,              rons in FEF respond more strongly to stimuli flashed in tem-
1980) and are particularly successful in capturing gaze and                 poral isolation compared with stimuli flashed in close tempo-
visual attention (Enns, Austen, Di Lollo, Rauschenberger, &                 ral proximity (Joiner et al., 2017).
Yantis, 2001; Ludwig & Gilchrist, 2002; Yantis & Jonides,                      Distractors presented along with the designated target can
1984). This is also reflected in the firing rate of neurons in the          also influence saccade target selection. In these cases, eye
lateral intraparietal area (LIP; Gottlieb, Kusunoki, &                      movements land at intermediate locations, a phenomenon re-
Goldberg, 1998; Kusunoki, Gottlieb, & Goldberg, 2000) and                   ferred to as global effect (Findlay, 1982; for reviews, see Van
frontal eye fields (FEF; Joiner, Cavanaugh, Wurtz, &                        der Stigchel & Nijboer, 2011; Vitu, 2008). The global effect
Cumming, 2017), areas which are said to combine informa-                    can be observed when target and distractor are presented in
tion about salience and relevance, thus acting as a priority map            close spatial proximity (Walker, Deubel, Schneider, &
                                                                            Findlay, 1997). Actual endpoints depend on the relative sa-
                                                                            lience of target and distractor (Deubel, Wolf, & Hauske, 1984)
Electronic supplementary material The online version of this article
                                                                            and on saccade latency: Early saccades are biased by the pres-
(https://doi.org/10.3758/s13414-020-02101-3) contains supplementary
material, which is available to authorized users.                           ence of the distractor to intermediate locations, whereas long-
                                                                            latency saccades are accurate (Coëffé & O’Regan, 1987;
* Christian Wolf                                                            McSorley & Findlay, 2003; Ottes, Van Gisbergen, &
  chr.wolf@wwu.de                                                           Eggermont, 1985). The fact that the contribution of salience
                                                                            to saccade target selection strongly depends on the timing of
1
    Institute for Psychology, University of Muenster, Fliednerstrasse 21,   the saccade is also reflected in a finding by Donk and van
    48149 Münster, Germany                                                  Zoest (2008): In an array of vertical (or horizontal) lines,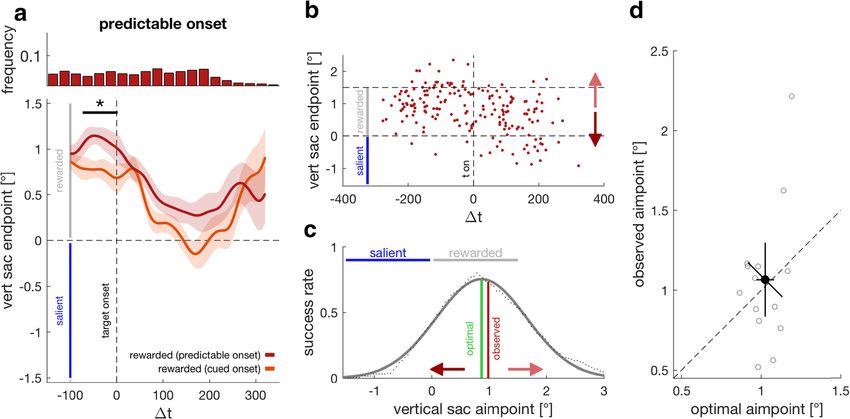
Atten Percept Psychophys

two lines deviated from the cardinal axis. One of these two         consisting of a high-salient and a low-salient region (see
singletons was defined by a small the other by a large orien-       Fig. 1). The dependent variable in all experiments was the
tation contrast. Participants had to make an eye movement to        vertical saccade endpoint on that luminance bar. Whereas
the more salient singleton as defined by the orientation con-       the locations of the three fixation crosses were the same for
trast. The proportion of correct selection was highest for short-   every trial in every experiment, the luminance bar could
latency saccades and decreased with latency, highlighting that      appear to the left or right of the last fixation cross. The
salience has the strongest impact on early responses.               high-salient region could be in the upper or in the lower
    When salience and behavioral goals compete for oculomo-         half of the luminance bar. Saccades into the low-salient
tor control, early saccades are biased towards salience, and        region were rewarded in selected conditions.
long-latency saccades are biased towards behavioral goals              The planning hypothesis would predict that successful
(Ghahghaei & Verghese, 2015; Ludwig & Gilchrist, 2002;              top-down control of eye movements depends on the time
Salinas et al., 2019; Schütz, Trommershäuser, &                     given to plan a saccade, whereas the inhibition hypothesis
Gegenfurtner, 2012; van Zoest, Donk, & Theeuwes, 2004).             would state that successful oculomotor control depends on
Schütz et al. (2012) measured saccade endpoints to a periph-        the temporal difference between stimulus onset and re-
erally appearing stimulus consisting of a salient and a             sponse and thus on how long the salient and to-be-
nonsalient but rewarded region. Early saccades were biased          inhibited region was previewed. Because multiple saccades
towards salience, and the strength of this bias depended on the     can be planned in parallel (McPeek, Skavenski, &
physical salience of the target. With increasing latency, sac-      Nakayama, 2000; McSorley, Gilchrist, & McCloy, 2020;
cade endpoints showed a dynamic transition from the salient         McSorley, McCloy, & Williams, 2016; Quaia, Joiner,
towards the rewarded region. This transition from bottom-up         FitzGibbon, Optican, & Smith, 2010), using saccade se-
to top-down eye-movement control was interpreted in terms           quences allowed us to independently manipulate the time
of the time it takes to integrate information about value into      given to saccade planning as well as the temporal onset of
the saccade plan (Ghahghaei & Verghese, 2015; Schütz et al.,        the vertical bar and thus the onset of the to-be-inhibited
2012). However, at the same time that value information is          salient region. We used saccade sequences rather than a
integrated, an orienting response to the salient region must be     single saccade with a timed go cue, because presentation
inhibited. Therefore, the same transition would be expected if      of such a go cue would have either required another visual
the time course is determined by the time it takes to success-      onset or an event in another modality (e.g., auditory cue),
fully inhibit a response towards the salient region.                either of which might confound saccade behavior (e.g.,
    The aim of the present work is to dissociate these two          Vidal, Desantis, & Madelain, 2020).
possibilities and reveal whether the transition from bottom-           In Experiment 1 (sudden onset), every saccade target
up to top-down eye-movement control is determined by de-            (i.e., fixation crosses and luminance bar) only appeared
liberate planning and integration of top-down information or        after the previous target had been fixated (see Fig. 1a).
by inhibiting responses to salient stimuli. The first three ex-     The aim of this first experiment was to replicate the dynam-
periments (Experiment 1: sudden onset, Experiment 2: con-           ic transition from bottom-up to top-down saccade control
tinuous display, Experiment 3: cued onset) directly focus on        (Schütz et al., 2012) using saccade sequences instead of
this question. In two further experiments, we investigate how       single reactive saccades. Thus, we expected short-latency
responses to suddenly appearing salient stimuli can be suc-         saccades to be biased towards salience, whereas long-
cessfully inhibited—first, whether inhibition can be achieved       latency saccades should be directed towards the low-
when the onset of a salient target is fully predictable             salient region when this region is associated with a reward.
(Experiment 4: predictable onset) and, second, whether suc-            In Experiment 2 (continuous display), all targets were
cessful inhibition depends on the quality with which a periph-      continuously displayed throughout the trial once the first
eral target can be previewed (Experiment 5: preview quality).       saccade target was fixated (see Fig. 1b). The aim of this
In the last experiment (Experiment 6: blank onset), we test         experiment was to show that the transition to top-down
whether the reappearance of a salient stimulus can bias sac-        control does not necessarily depend on whether participants
cade endpoints, although it had been previewed beforehand.          initiate a quick or a slow oculomotor response (thus, wheth-
                                                                    er the fixation duration on the last fixation cross is short or
                                                                    long), but that it depends on how long the target can be
Experiments 1–3: The transition to top-down                         previewed. If this were the case, we would expect saccade
control requires inhibition                                         endpoints to be directed towards the low-salient region
                                                                    when this region is associated with a reward. This should
In all experiments, participants had to make a sequence of          be true for all fixation durations.
four saccades. The first three targets were fixation crosses,          In Experiment 3 (cued onset), all fixation crosses and the
whereas the last target was a vertical luminance bar                outline of the low-salient region (a black frame) were shown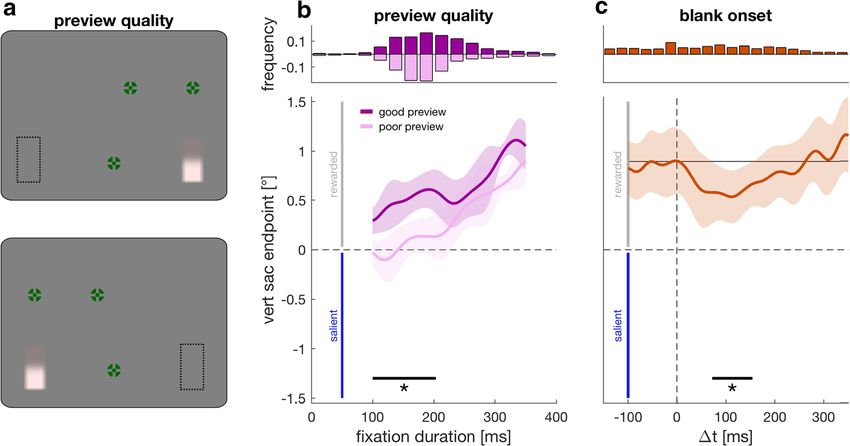
Atten Percept Psychophys

               a          trial start      sequence: 1st target       2nd saccade target       3rd saccade target            final target

           sudden onset

               b
           continuous

                                                                                                                                                unflipped
               c
           cued onset

                                                                                                                                                flipped
                           Time

Fig. 1 Trial procedure for Experiment 1 (sudden onset; a), Experiment 2          fixated the upper right fixation cross. c In Experiment 3 (cued onset),
(continuous display; b) Experiment 3 (cued onset; c). Participants started       participants knew the location of the rewarded region as soon as the
trials by fixating a central cross and pressing the space bar (first column).    sequence targets appeared (second column) by means of two cues, but
Then, participants made saccades to a sequence of four targets: three            they did not know the location of the salient region, which could appear
fixation crosses and one vertical luminance bar. The luminance bar               above or below. A first cue was shown when participants initiated a trial
consisted of two regions: a high-salient region that was brighter than           (first column) and signaled whether the rewarded region will be up (dot
the background, and a low-salient region slightly darker than the back-          above cross) or down (dot below cross) relative to the vertical midline of
ground. In conditions with reward, participants received a reward when           the last fixation cross. The second cue (columns two and three) was the
they managed to look at the low-salient region. Whereas the three fixation       outline of the rewarded region. The outline cue ensured that a saccade into
crosses in the sequence were always at the same location, the luminance          the low-salient region could be planned before the luminance bar ap-
bar could appear left or right from the last fixation cross with the rewarded    peared. The first cue was added to additionally ensure that performance
region being either up or down. Red dashed circles and red arrows denote         was not limited by peripheral location discrimination performance. The
the current gaze location and saccades and were not displayed during the         luminance bar could either appear vertically centered with the last fixation
experiment. a In Experiment 1 (sudden onset), the next target was only           cross (unflipped) or the high-salient region appeared on other side of the
displayed once the previous target was foveated. b In Experiment 2 (con-         low-salient region (flipped). (Color figure online)
tinuous display), all sequence targets were shown once participants

throughout the trial once participants fixated the first saccade                 Methods
target (see Fig. 1c). The luminance bar itself only appeared
after fixating the last fixation cross, and the high-salient region              Participants
could appear above or below the low-salient region. Thus, in
rewarded trials of Experiment 3, participants knew throughout                    Participants were undergraduate students of the University of
the trial where they want to saccade to, and had sufficient time                 Muenster and were reimbursed with 8€/h or course credit.
to integrate that information into the saccade plan. However,                    Additionally, participants could receive a reward depending
they did not know the location of the high-salient region until                  on their individual performance. Every trial with reward could
the luminance bar appeared. We expected that saccades initi-                     provide nine score points, and 100 score points were convert-
ated shortly after the onset of the luminance bar would be                       ed in 0.1€ at the end of the experiment. Twenty-four individ-
biased towards salience, whereas late saccades would be suc-                     uals participated in the cued onset experiment (mean age = 24
cessfully directed towards the low-salient region (inhibition                    years, age range: 18–30 years, 20 females), of which 12 (mean
hypothesis). In contrast to that, the planning hypothesis would                  age = 25, age range: 22–30 years, three males) also participat-
predict that in conditions with reward, endpoints should be                      ed in the sudden onset and continuous display experiment.
directed towards the low-salient region—independent of the                       Participants of all experiments provided written informed con-
temporal relationship between saccade onset and target onset.                    sent before testing. Experiments were approved by the ethics
Atten Percept Psychophys
committee of the Department of Psychology and Sport Every trial of both respective sudden onset conditions re-
Sciences of the University of Muenster (Proposal No. 2018- quired participants to make four saccades (see Fig. 1a).
18-ChW) and were conducted in accordance with the decla- Participants were instructed to successively look at the three
ration of Helsinki. fixation crosses and the luminance bar in the prescribed order.
They were not told to look at any particular region of the
luminance bar, but before performing the rewarded condition,
Setup and stimuli
they were informed that they could obtain a reward by looking
at the low-salient region.
Stimuli were presented on an Eizo FlexScan 22-inch CRT
Participants started every trial by fixating a central cross
monitor (Eizo, Hakusan, Japan) with a resolution of 1,152 ×
and simultaneously pressing the space bar. After trial start, the
870 pixels, a refresh rate of 75 Hz, and an effective display
central cross disappeared, and another fixation cross (first sac-
size of 40.7 × 30.5 cm viewed from 67 cm distance. Stimulus
cade target) appeared at the upper right corner of the screen
presentation was controlled via the Psychtoolbox (Brainard,
(+14° to the right and +6° up relative to screen center). This
1997; Kleiner, Brainard, & Pelli, 2007) in MATLAB (The
first saccade target turned green once it had been fixated and
MathWorks, Natick, MA, USA). Eye position of the right
the second saccade target (fixation cross) appeared horizon-
eye was recorded at 1000 Hz using the EyeLink 1000 (SR
tally centered and 6° up from the screen center. Once this
Research, Ontario, Canada) and the EyeLink Toolbox
second target had been fixated it turned green and the third
(Cornelissen, Peters, & Palmer, 2002).
saccade target (fixation cross) appeared horizontally centered
All stimuli were presented on a uniform gray background.
and 6° down from the screen center. Likewise, the third sac-
In every saccade sequence, all targets but the last were fixation
cade target turned green once it had been foveated. The lumi-
crosses consisting of a combination of bull’s eye and cross
nance bar appeared 14° left or right from the last fixation cross
hair (Thaler, Schütz, Goodale, & Gegenfurtner, 2013) with a
with the high-salient region pointing up or down. It appeared
diameter of 0.5°. In all experiments, fixation crosses turned
with an onset delay of 0, 100, 200, 300 or 400 ms after gaze
from black to green once they had been looked at. The final
arrived at the last fixation cross. These onset delays were
target was a vertical bar covering 1° in width and 3° in height.
introduced to sample a broader range of reaction times.
The bar consisted of two vertical parts of equal size: a high-
Thus, both conditions contained 40 trials of every onset delay,
salient and a low-salient region. The high-salient region was
and trials with different onset delays were randomly inter-
clearly brighter than the background, whereas the low-salient
leaved. The vertical center of the luminance bar was aligned
region was only slightly darker than the background (see Fig.
with the vertical center of the last fixation cross. The lumi-
1). In conditions with reward, participants received a reward
nance bar and all three green fixation crosses disappeared
for saccades to the low-salient region. The transition from
100 ms after the luminance bar had been foveated or after
target to background and from high-salient to low-salient re-
the overall trial duration of 5 s was exceeded.
gion was smoothed by means of a cumulative Gaussian with a
In conditions with reward, feedback was provided at the
standard deviation of 1/12° to prevent a sharp edge contrast.
end of each trial. Participants received nine score points for
successfully looking at the rewarded region, otherwise, zero.
Design and procedure This and their overall score (e.g., “+9|459”) was displayed at
the final target location. Feedback was written in black, unless
Experiment 1 (sudden onset) Experiment 1 consisted of two participants exceeded a time constraint of 5 s for the whole
conditions recorded in separate blocks: one condition with and trial (red) or skipped a fixation cross (blue). Trials in which
one condition without reward. In the condition with reward, one or more of the three fixation crosses was skipped (3.98%)
participants received a reward for a saccade to the low-salient or in which the luminance bar was not foveated within the 5 s
region. Both blocks contained 200 trials and were recorded in time constraint (additional 0.23%) were not considered for the
different sessions. To prevent a transfer of learned reward final analysis.
relationships (e.g., Anderson, Laurent, & Yantis, 2011) or a
transfer of top-down strategies to the unrewarded condition, Experiment 2 (continuous display) Like Experiment 1, the
the unrewarded condition was always recorded in the first continuous display experiment consisted of two conditions
session. It was recorded together with the unrewarded condi- (unrewarded and rewarded), which were recorded in different
tions of Experiments 2 and 3. In the second session, every blocks and contained 200 trials each (see Design and
participant completed the rewarded conditions of the three Procedure section of Experiment 1). Instructions were identi-
experiments in three different blocks. The order in which cal to instructions for Experiment 1. After starting a trial, the
blocks of the three experiments were recorded was balanced first saccade target (upper right fixation cross) appeared. It
across participants but consistent for the two sessions of every turned green once it was fixated, and, unlike Experiment 1,
individual. all subsequent fixation crosses and the luminance barAtten Percept Psychophys
appeared (see Fig. 1b, second panel). Feedback was provided onset and target onset was taken as saccade latency
in the rewarded condition, identical to Experiment 1. We (Experiment 1) or Δt (Experiment 3), respectively. Fixation
discarded 4.29% of trials because a fixation cross was skipped durations (Experiment 2) were calculated as the temporal dif-
and additional 1.02% of trials because the time constraint was ference between the offset of the saccade foveating the final
exceeded. fixation cross and the onset of the subsequent saccade
directing gaze to the luminance bar. An online criterium to
Experiment 3 (cued onset) Experiment 3 consisted of two detect saccade offsets and endpoints (10 frames on the target
conditions: unrewarded and rewarded. Both conditions were ±0.5° tolerance) was used to provide feedback. Conclusions
split into two blocks of 200 trials each. For the first half of did not change with the saccade offset criterion used.
participants, it was recorded in different sessions (see Design Endpoints were referenced to the vertical center of the last
and Procedure section of Experiment 1). For the other half of fixation cross, with positive values (−1.5°) indicating a response towards the high-salient region.
tion was always recorded first, whereas the order of the re- For trials of Experiment 3 in which the location of the salient
maining two blocks was balanced across participants. region was vertically flipped (see Fig. 1c), values between 0°
Instructions were identical to Experiments 1 and 2. Each block and 1.5° denote the low-salient region, whereas values be-
contained 20 trials for every combination of the five different tween 1.5° and 3° denote the high-salient region.
onset delays and the two vertical bar positions (flipped vs. To analyze endpoints over time, we used a cluster-based
unflipped). Trials within one block were randomly permutation approach, because dividing the data into bins did
interleaved. not allow to perform adequate statistics due to the variability
Two cues validly indicated the location of the low-salient across participants. Cluster-based permutation testing is suc-
region (see Fig. 1c): (i) a dot presented for 250 ms above or cessfully used in EEG where the data contain one time series
below the initial fixation cross indicated whether the low- per trial (Maris & Oostenveld, 2007). Recently, an equivalent
salient region was up or down relative to the last fixation method was introduced for behavioral data with one data point
cross, and (ii) the outline of the low-salient region, a black per trial (van Leeuwen, Smeets, & Belopolsky, 2019). Here,
frame, was displayed once gaze was at the upper right fixation we used the method introduced by van Leeuwen et al. (2019):
cross. The first cue was added to make sure performance was The data were first temporally smoothed for every individual;
not limited by peripheral location discrimination performance. second, a weighted time series was constructed that takes the
The second cue (outline) appeared together with the second contribution of every individual into account, and third, a
and third saccade target and was displayed until the luminance cluster-based permutation test was performed.
bar appeared. The purpose of this second cue was to allow The data were smoothed using a Gaussian kernel of 16 ms
planning a saccade towards the low-salient region before the width at a 1 ms resolution. For every time point of the
appearance of the luminance bar. The luminance bar appeared smoothed data, two conditions were compared (or one condi-
after foveating the last fixation cross with an onset delay of 0, tion against a baseline) using a t test. Clusters were defined as
100, 200, 300, or 400 ms. adjacent time points showing a significant difference between
In order to avoid any implicit cue on the location of the conditions with the cluster strength corresponding to the sum
high-salient region, the high-salient region could appear above of the t values in the cluster. A cluster-based permutation
or below the low-salient region. Therefore, the last fixation approach was performed to determine cluster significance:
cross was vertically centered with the vertical bar like in all For every permutation, the labels assigning trials to conditions
other experiments (unflipped), or it was vertically centered were randomly shuffled. The permuted data was smoothed,
with the outer edge of the low-salient region (flipped). and the weighted statistics yielded the strongest cluster
Feedback was provided in the rewarded condition. We indexed by the highest sum of t values. The cluster strength
discarded 4% of trials because a fixation cross was skipped of the original, nonpermuted data (sum of t values) was then
and an additional 4.68% of trials because the 5 s time con- compared against the cluster-strength distribution of the stron-
straint was exceeded. gest cluster for every permutation. Any cluster in the
nonpermuted data with a cluster strength larger or equal to
Data analysis the 95th percentile of the permuted distribution was consid-
ered a significant cluster. The p value of a nonpermuted cluster
We measured eye movements of the right eye with a sampling is then given by 1 minus the percentile of the nonpermuted
rate of 1000 Hz. Saccade onsets and offsets were defined off- cluster in the permuted distribution (van Leeuwen et al.,
line using the EyeLink 1000 algorithm, which uses a combi- 2019). We used 10,000 permutations for every test. For every
nation of velocity (30°/s), acceleration (8,000°/s2) and motion comparison, we report the p value, the cluster strength of the
(0.15°) threshold. The temporal difference between saccadeAtten Percept Psychophys
nonpermuted data (t) and the 95th percentile of the permuted In Experiment 2, we measured the same sequence with all
distribution, which is the critical t value (tcrit). targets being continuously displayed throughout the trial (see
Fig. 1b). Figure 2b shows vertical endpoints as a function of
the fixation duration on the final fixation cross (i.e., the
Results fixation before the saccade to the target area was made; see
individual data in Supplemental Fig. S2). Again, without re-
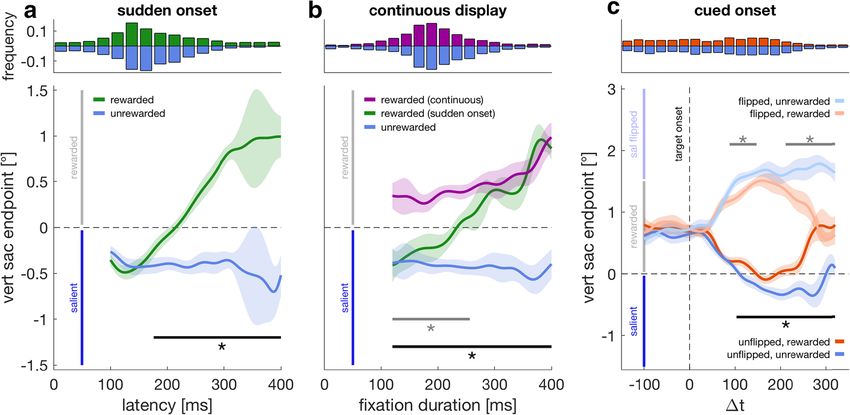
In Experiment 1, we aimed to replicate the dynamic transition ward, endpoints were biased towards salience throughout the
from salience to reward in a saccade sequence instead of a whole time course (blue). With reward, endpoints were biased
single reactive saccade. In this experiment (see Fig. 1a), the towards the rewarded region for all fixation durations (120–
next target in a sequence only appeared once the previous target 400 ms, purple line) and were different from endpoints with-
had been fixated. The lower panel in Fig. 2a (see individual data out reward (p < .0001, t = 2419, tcrit = 148.7). Thus, there was
in Supplemental Fig. S1) shows vertical saccade endpoints as a no transition from salience to reward. To ensure that this was
function of saccade latency (i.e., saccade onset relative to target due to the continuous presence of the target throughout the
onset) when the low-salient region was rewarded (green) or not trial and not an artifact of plotting endpoints as a function of
(blue). Whereas without reward endpoints were always biased fixation duration instead of latency, we also plotted the data
towards salience, endpoints in the reward condition critically from the rewarded sudden onset condition, with 0 ms onset
depended on saccade latency: Early saccades were biased by delay as a function of fixation duration (see green data in Fig.
salience, later saccades were biased by reward. The two time 2b). With reward, vertical endpoints in the continuous and
courses differed significantly for latencies of 176 ms or longer sudden onset condition differed significantly for fixation du-
(p < .0001, t = 1554, tcrit = 147.2). rations below 257 ms (p < .0001, t = 624.09, tcrit = 183). Thus,
Fig. 2 Vertical saccade endpoints (lower panels) for Experiments 1, 2, 3 of plotting endpoints as a function of latency versus fixation duration. The
with reaction time or fixation duration histograms (upper panels) for the horizontal black line denotes a significant difference between the
respective conditions in the panel below. a Experiment 1 (sudden onset). rewarded and unrewarded condition of Experiment 2, the gray line rep-
Vertical saccade endpoints as a function of saccade latency when resents a significant difference between rewarded conditions of
participants received a reward for looking at the low-salient region Experiment 1 and Experiment 2 and (c) Experiment 3 (cued onset).
(green) or not (blue). The horizontal dashed line indicates the center of Vertical endpoints relative to target onset in the rewarded (orange) and
the luminance bar with positive values ( −1.5°; vertical blue line) the salient region was flipped. Before target onset (Δt < 0), the outline of
marking the high-salient region. Data are smoothed weighted averages, the low-salient region was displayed as a cue. Confidence intervals of all
with shaded regions being 95% confidence intervals (van Leeuwen et al., depicted end-point time courses are a weighted statistic that take into
2019). The solid horizontal black line and asterisk indicate a significant account the individual weight given to each time point in the two condi-
cluster in the respective time window. b Experiment 2 (continuous dis- tions as well as the difference between two conditions across time for
play). Vertical endpoints in the rewarded (purple) and unrewarded (blue) every participant (van Leeuwen et al., 2019). Consequently, when com-
conditions as a function of the fixation duration on the final fixation cross. paring two conditions, both confidence intervals are identical. All error
Green data are vertical endpoints from the rewarded sudden onset condi- bars result from comparing a rewarded with the corresponding unreward-
tion with 0 ms onset delay (a) expressed as a function of fixation duration. ed condition, unless the sudden onset data in b, which results from a
The comparison between rewarded continuous display and rewarded sud- comparison with the rewarded continuous data. (Color figure online)
den onset shows that the difference between experiments is not an artifactAtten Percept Psychophys
we observed a transition in vertical endpoints from salience to not (see Fig. 2b). More importantly, when participants had
reward when the target suddenly appeared before the saccade sufficient time to plan a saccade to the low-salient rewarded
was initiated, but not when the target was continuously region, an unpredictable onset still temporarily biased end-
displayed throughout the sequence. points towards salience (see Fig. 2c).
Experiments 1 and 2 differ with regard to two aspects: In Experiment 1 every target appeared once the previous
when the target is continuously displayed (Experiment 2), target had been fixated, and the location of the luminance bar
participants can know at the beginning of the sequence where could not be anticipated before it appeared. Therefore, it is
they want their eyes to land and which location to inhibit. possible that sudden onsets only attracted saccades, because
Neither is possible in Experiment 1. In Experiment 3 we mea- they were relevant for the task. However, this was not the case
sured eye movements in the same saccade sequence when in Experiment 3. In this experiment, all subsequent fixation
participants knew from the beginning where to look, but not crosses and the outline of the low-salient region did not appear
which location to inhibit (see Fig. 1c). Therefore, the outline one after the other, but once the first saccade target was fixat-
of the low-salient (rewarded) region was visible before the ed. Moreover, in Experiment 3 the onset of the luminance bar
luminance bar appeared. However, the salient region could was not relevant to perform the task. This supports the notion
appear above or below. that the onset of a salient stimulus not only affected saccades
Figure 2C (see individual data in Supplemental Fig. S3) when it was task-relevant, but because of its physical salience.
shows vertical saccade endpoints in Experiment 3 as a func- In our experiments, we did not manipulate the relative sa-
tion of the temporal difference between saccade onset and lience of the two regions. Changing, for example, the salience
target onset (Δt). Please note that due to the different onset of the high-salient region would have changed how much
delays, it was possible to initiate a saccade to the luminance early responses in the sudden onset experiment were drawn
bar before it appears (i.e., to the outline of the low-salient towards the salient region (Schütz et al., 2012). Therefore,
region), resulting in a negative Δt. In all conditions, saccades changing the relative salience of the luminance bar would
accurately landed in the highlighted outline when they were have most likely changed the magnitude of the onset
initiated before the target appeared. In contrast, endpoints of effect—that is, how much the two orange curves in Fig. 2c
saccades initiated after target onset strongly depended on the were maximally drawn apart before inhibition became appar-
actual temporal difference between saccade onset and target ent and endpoints were redirected towards the center of the
onset. Shortly after target onset, endpoints were drawn to- rewarded region.
wards salience: Endpoints to flipped (faint colors) and An alternative explanation to actively inhibiting a response
unflipped targets (saturated colors) differed both with reward to the suddenly appearing salient region would be that salience
(orange; p < .0001, 50–260 ms, t = 2129, tcrit = 139.9) and is only briefly presented in the brain and automatically decays
without (blue; p < .0001, ≥42 ms, t = 4549, tcrit = 148.6). In the over time. However, we consider it more likely that a response
unflipped case, endpoints with and without reward differed to the salient region has to be actively inhibited for two rea-
significantly for Δt values above 102 ms (p = .0001, t = sons. The first reason is the recent converging evidence that
767.8, tcrit = 153.3). In the flipped case, we observed two emphasizes the role of active inhibition to prevent attentional
significant time clusters, an early (88–147 ms, p = .0211, t = capture by salient stimuli (for reviews, see Gaspelin & Luck,
177.9, tcrit = 146.8) and a late one (211–320, p < 0.0001, t = 2018, 2019; van Moorselaar & Slagter, 2020). The second
606.5, tcrit = 146.8). Both in the flipped and unflipped case, reason is the observed pattern in our Experiment 3 (cued on-
endpoints were drawn back to the center of the rewarded re- set): In both conditions, saccade responses initiated before
gion. Thus, endpoints were biased towards salience, although target onset were reliably aimed at the center of the low-
participants knew in advance where to look and had sufficient salient (rewarded) region. After target onset, endpoints in the
time to integrate that information into their saccade plan. rewarded condition were first drawn towards salience, but
then regressed back to the center of the rewarded region
Discussion (orange lines in Fig. 2c). This pattern would be consistent with
both automatic decline and active inhibition. However, if this
Experiments 1, 2, 3 were designed to dissociate whether the was caused by an automatic decline, we would have expected
transition from bottom-up to top-down oculomotor control to find the same pattern without a behavioral goal, thus in the
(see Fig. 2a) is determined by the time it takes to integrate unrewarded condition (blue lines in Fig. 2c). Yet this was not
information about behavioral goals into the saccade plan the case: Endpoints after target onset were initially biased
(planning hypothesis) or by the time it takes to inhibit a re- towards salience, but then remained at the salient region and
sponse to a suddenly appearing salient stimulus (inhibition did not return to the center of the low-salient region although a
hypothesis). Our results support the latter. We showed that saccade to that location had already been planned. We take
early responses are not necessarily governed by salience, but this as evidence for active inhibition. In Experiments 4, 5, 6,
that this depends on whether the target can be previewed or we study the requirements and limitations of this inhibition.Atten Percept Psychophys
Experiment 4: Fully predictable onsets bias BF10 values 1 favor the alternative hy-
despite correction pothesis (difference between conditions). The more values
deviate from 1, the stronger the evidence, with BF10 values
What determines whether a response to a suddenly appearing in between 0.33 and 3 being considered inconclusive evidence
salient stimulus can be successfully inhibited or not? In (Jeffreys, 1961).
Experiment 4 (predictable onset experiment), we tested
whether a bias by a suddenly appearing salient stimulus can Results and discussion
be inhibited when the onset is fully predictable. To this end,
we measured a slightly modified version of Experiment 3 in Figure 3a shows endpoints from Experiment 4 (red) compared
which the luminance bar was always vertically aligned with with unflipped trials from Experiment 3 (orange) for the same
the center of the last fixation cross (i.e., unflipped trials only). set of participants (see individual data in Supplemental Fig.
As a consequence, the two cues were informative not only S4). We found one significant cluster from −73 to +2 ms (p =
about the location of the low-salient rewarded region but also .0087, t = 233.5, tcrit = 157.6), highlighting that participants
about the location of the high-salient region. We provided this aimed to saccade to a location further away from the salient
information explicitly to participants before the experiment. If region. The aimpoint (mean vertical endpoint for Δt < 0) was
successful inhibition can be achieved by making the stimulus 1.065° (SD = 0.42°). Endpoints after target onset were differ-
onset fully predictable, we expected endpoints to be centered ent from this initial aimpoint for Δt values >33 ms (p < .0001,
on the rewarded region independent of the temporal difference t = 1305, tcrit = 149.7). Thus, endpoints after target onset were
between saccade and target onset. On the other hand, if inhi- still drawn in the direction of salience. To assess whether this
bition cannot be achieved by onset anticipation, we expected aimpoint adjustment is functional, we compared actual
endpoints after target onset to be biased towards salience by aimpoints with the aimpoint that would have maximized the
the same extent as in Experiment 3. rate of successfully looking at the rewarded region. Therefore,
we shifted the whole end-point distribution of each participant
Methods up or down (see Fig. 3b) and computed the fraction of trials
within the rewarded region (success rate) for every possible
We recorded data of 16 participants (mean age = 24 years, age aimpoint. Success rates over the different aimpoints were
range: 18–30 years, 14 females) for Experiment 4. All partic- fitted with a Gaussian, the mean of which was taken as opti-
ipants also took part in Experiment 3. Twelve participants mal (see Fig. 3c). Observed aimpoints (see Fig. 3d) were not
performed Experiment 4 in one session together with different from optimal aimpoints (1.025°), t(14) = 0.405, p =
Experiment 3 (see Design and Procedure section of .691, BF10 = 0.282.
Experiment 3), the remaining four participants performed In Experiment 4, we asked whether it is possible to prevent
Experiment 4 in a separate session. being biased towards salience when one knows both where to
Experiment 4 consisted of one condition (rewarded) that look and which location to inhibit. To this end, we made use
was recorded in one block containing 200 trials. Trials were of the same two cues used in Experiment 3. But unlike
identical with rewarded unflipped trials (see Fig. 1c) from Experiment 3, both cues were also informative about the sa-
Experiment 3. Thus, in Experiment 4, the center of the lumi- lient region’s location, and we provided this information ex-
nance bar was always vertically aligned with the last fixation plicitly to participants. The results showed that when partici-
cross such that the outline of the rewarded region was also pants know where to look and which location to inhibit, they
informative about the salient region’s location. We provided initially correct for the sudden onset of a salient stimulus, but
this information explicitly to the participants. Like in they cannot prevent being affected by it. This suggests that full
Experiment 3, the luminance bar could appear with an onset knowledge about the onset of a suddenly appearing salient
delay of 0, 100, 200, 300, or 400 ms after the last fixation stimulus is not sufficient for successful inhibition.
cross was foveated. Trials with different onset delays were
randomly interleaved in one block. We discarded trials in
which a fixation cross was skipped (3.97%) or in which the Experiment 5: Preview quality modulates
overall trial duration of 5 s was exceeded (additional 0.25%) the inhibition of salience
for the final analysis.
Data analysis for endpoints over time was equivalent to As an alternative to anticipatory inhibition, it might be that
Experiments 1, 2, 3. We compared observed and optimal successful inhibition requires visual processing of the target in
aimpoints (see Results) using a paired-samples t test, which case performance should depend on how well a target
complemented with the Bayesian equivalent (Wagenmakers can be previewed in the periphery. If this were the case, we
et al., 2017). The Bayesian t test yields a Bayes factor, BF10. would expect that successful inhibition is modulated by howAtten Percept Psychophys
Fig. 3. Experiment 4 (predictable onset). a Vertical saccade endpoints Black dots are the success rate for a given aimpoint and thus for a given
relative to target onset (red). The orange time course represents data from vertical shift of all endpoints. The solid gray line is a Gaussian fit of the
unflipped trials of Experiment 3 from the same set of participants. The success rates over different aimpoints. The vertical red line shows the
upper panel shows a reaction time histogram for the predictable onset data actually observed success rate and aimpoint, whereas the green vertical
below. b Data of one participant. Red dots denote endpoints of individual bar denotes the optimal aimpoint maximizing the success rate and thus the
trials. The aimpoint was defined as the average endpoint before target reward outcome. The optimal aimpoint is defined by the mode/mean of
onset (Δt < 0). Trials with endpoints in between the two horizontal the Gaussian. d Observed against optimal aimpoints. Open circles denote
dashed lines were rewarded. The fraction of rewarded trials yields the data from individual participants, and the filled circle is the group average
success rate. We computed the success rate for different theoretical with 95% confidence intervals of between-participant variability. (Color
aimpoints by shifting all data points up and down (red vertical arrows). figure online)
c Success rate over different aimpoints for the same observer as in b.
well the target can be seen before a response is made. In Trial procedure was identical to the rewarded condition of
Experiment 5 (preview quality experiment) we thus investi- Experiment 2, except for two changes: (i) the overall trial
gated whether inhibition is modulated by visual preview qual- duration was restricted to 2.3 s (instead of 5 s) to have shorter
ity. To test this, we manipulated the eccentricity with which fixation durations, and (ii) the location of the first two saccade
the target can be peripherally inspected during the saccade targets (i.e., the upper two fixation crosses) was changed: The
sequence. This was achieved by changing the location of the vertical position of these first two saccade targets was 3.5°
upper two fixation crosses (saccade target 1 and 2) so that above screen center (instead of 6°). Moreover, the horizontal
luminance bars appearing in one hemifield were closer to position of the second saccade target was horizontally shifted
these two fixation crosses than were bars in the other in the direction of the first saccade target by 2.5°. As a conse-
hemifield (see Fig. 4a). If inhibition is modulated by preview quence, the difference in overall eccentricity between these
quality, we would expect that responses towards the good fixation crosses and the luminance bar became more pro-
preview location are more clearly directed into the rewarded nounced for luminance bars appearing on the right compared
region. This should be particularly pronounced when the fix- with bars appearing on the left (see Fig. 4a). Specifically, the
ation duration on the last fixation cross (equal distance to both overall distance of the upper right fixation cross to the lumi-
locations) is short. nance bar was 9.5° (instead of 12°) if the luminance bar ap-
peared on the right and 29.6° (instead of 30.5°) if the lumi-
nance bar appeared on the left. The distance of the second
Methods saccade target to the luminance bar was 14.9° for a luminance
bar on the right and 19.3° for a luminance bar on the left
We recorded data from a new set of eight participants (mean (compared with 18.4° to both locations in all other
age = 25 years, age range: 20–34 years, one male). Every experiments).
participant completed two blocks of 200 trials each. Each Preview quality would be confounded with saccade direc-
block contained 100 trials with good and 100 trials with poor tion when the good preview target always appeared on the
preview, which were randomly interleaved within a block. In right and the poor preview target always appeared on the left.
both blocks, participants received a reward for saccades into Therefore, the sequence was horizontally mirrored for half of
the low-salient region. the eight participants (Fig. 4a, lower panel). Thus, for theseAtten Percept Psychophys
Fig. 4 Experiment 5 (preview quality; a, b) and Experiment 6 (blank panel: For half of the participants the location of the fixation crosses was
onset; c). a Spatial layout of saccade targets in Experiment 5. Upper horizontally mirrored to prevent a confound between preview quality
panel: Once the first saccade target (upper right fixation cross) was (good vs. poor) and saccade direction of the final saccade (left vs.
fixated, all remaining saccade targets appeared. Like in all other right). b Vertical endpoints as a function of fixation duration for the
experiments, fixation crosses turned from black to green once fixated. good (saturated) and poor (faint) preview conditions. c Vertical endpoints
The location of the first two fixation crosses was changed so that they relative to target reappearance (Δt = 0) after the target was blanked. The
were closer to the final target if the luminance bar appeared on the right solid horizontal line marks the average endpoint for saccades with Δt < 0.
(good preview location) compared with when it appeared on the left (poor Shaded regions represent the 95% confidence interval (van Leeuwen
preview location). The dashed outline corresponds to the target location et al., 2019). (Color figure online)
in bad preview trials and was not displayed during the experiment. Lower
participants the first saccade target always appeared on the temporarily disappears. Can it be maintained? Or does it decay
upper left and not on the upper right, and the second saccade once the target is removed from the screen?
target was shifted 2.5° to the left and not to the right. We
discarded trials in which at least one fixation cross was
skipped (8.81%) or in which the luminance bar was not fixat- Experiment 6: Target reappearances bias
ed within the time constraint of 2.3 s (additional 0.75%). endpoints towards salience
Experiment 6 (blank onset experiment) aimed to test whether
Results and discussion inhibition can be maintained if the target is blanked and thus
reappears shortly before the final response is made. To this
Figure 4b shows vertical endpoints for the good and poor end, the luminance bar could be sufficiently previewed in its
preview conditions as a function of the fixation duration on final location and orientation before the saccade sequence was
the last fixation cross (see individual data in Supplemental carried out. However, in half of the trials, the target was
Fig. S5). For fixation durations below 203 ms, saccades to blanked during the saccade sequence and only reappeared
the side with poor preview quality were further away from when the gaze arrived at the final fixation cross or shortly
the rewarded region than saccades to the side with good pre- after.
view quality (p = .0021, t = 291, tcrit = 144.4).
These results show that saccades to targets appearing in a Methods
hemifield with good preview were more reliably aimed to-
wards the rewarded region. This became evident when the We recruited another new set of 16 participants. Data from
fixation on the final fixation cross was short. The results sug- two of the 16 participants had to be discarded because they
gest that successfully inhibiting the salient region depends on stated after the experiment that they were not able to identify
preview quality and thus that it requires visual processing of the feedback or peripherally identify the orientation of the
the target. In a next step, we wanted to know what happens if luminance bar. The remaining 14 participants (12 females)
inhibition has been successfully established and the target had a mean age of 24 years (age range: 20–30 years).Atten Percept Psychophys
Experiment 6 consisted of 400 trials recorded in two blocks this is only true when a stimulus cannot be previewed and
of 200 trials each. Each block contained 100 trials with blank appears suddenly in the periphery (see Fig. 2b). In this study,
and 100 trials without blank. These two trial types were ran- we show that deliberate planning is insufficient for an early
domly interleaved. Trials without blank were interleaved to transition to top-down control and that the inhibition of sud-
make the blank less predictable and ensure that participants denly appearing salient stimuli is an additionally required sep-
pursued a steady pace in the saccade sequence. In all trials, arate process. Even with sufficient time dedicated to saccade
participants received a reward for saccades into the low-salient planning, the sudden onset of the target biased saccade end-
region. points towards salience (Fig. 2c). The time it takes to fully
The trial procedure of Experiment 6 is graphically depicted suppress the salient region is comparable whether there was
in Supplemental Fig. S6. The vertical bar appeared 1.2 s be- sufficient time to preplan the saccade (Fig. 2c) or not (Fig. 2a),
fore the initial central fixation cross was removed and the suggesting that although target selection is required, the tran-
fixation cross in the upper right appeared. Participants were sition from bottom-up to top-down control will ultimately be
instructed to keep fixating the central fixation cross during that determined by the process of inhibiting the suddenly
time (eccentricity of 15.2°), and the vertical bar was tempo- appearing salient region. Even prior knowledge about both,
rarily removed from the screen in case participants shifted where to look and which location to inhibit, is not sufficient. It
their gaze away from the central fixation cross. As soon as causes an anticipatory compensation but cannot prevent being
the upper right fixation cross had appeared and was foveated, drawn towards salience (see Fig. 3a). Successful inhibition
the other two fixation crosses appeared and remained on the could only be achieved by previewing the target (Fig. 4b).
screen throughout the trial (only changing their color once However, simply blanking the target briefly biased saccade
they had been fixated) endpoints in the direction of salience again, even with a suf-
In half of the trials, the vertical bar was blanked 100 ms ficiently long preview duration (see Fig. 4c), suggesting that
after the upper central fixation cross was fixated, and it inhibition cannot be fully maintained when the target is
reappeared with one of the onset delays also used in blanked. Yet this onset bias appears comparatively small com-
Experiments 1, 3, and 4 (0, 100, 200, 300, and 400 ms) after pared with other conditions in which the target cannot be
the next and last fixation cross was fixated. In the other half of previewed, but where the location of the target and salient
the trials, the bar was not blanked. Trials in Experiment 6 had region are known (see Figs. 2c and 3a).
a time constraint of 3.5 seconds upon appearance of the upper Our participants had to make a sequence of saccades with
right fixation cross. We discarded 3.54% of trials because a the last target being a vertical luminance bar consisting of a
fixation cross was skipped and additional 0.39% of trials be- high-salient and a low-salient region. We used reward to ma-
cause the time constraint was exceeded. nipulate behavioral goals. Without reward (i.e., without a be-
havioral goal), endpoints were aimed at the salient region.
Results and discussion This was also true when the outline of the low-salient region
was shown, and the saccade was already planned (see Fig. 2c).
Figure 4c shows vertical endpoints on the luminance bar rel- This indicates that without a behavioral goal, it is the default to
ative to target reappearance (see individual data in select salience (Schütz et al., 2012; Wolf, Wagner, & Schütz,
Supplemental Fig. S7). The average endpoint for saccades 2019), and this default bias does not decay over time but needs
initiated before target reappearance was 0.9° (SD = 0.52°). to be actively suppressed (Gaspar & McDonald, 2014;
Saccades initiated between 72 and 154 ms after target reap- Gaspelin, Leonard, & Luck, 2015) when salience and
pearance were significantly drawn towards salience (p = .012, behavioral goals compete. In contrast to that, Donk and van
t = 217.08, tcrit = 157.7). Zoest (2008) found that correct saccade selection decreased
Thus, even if the target can be previewed for a sufficient with increasing latency when participants had to select the
duration, but is blanked and thus reappears shortly before the most salient target. However, in their study, two salient targets
final saccade to the luminance bar is made, the reappearance competed (Donk & van Zoest, 2008), and the performance
of salient stimuli biases endpoints, suggesting that inhibition decay might reflect the influence of the second salient target,
cannot be fully maintained. which is exerted at a later time point. This could be reflected in
the timing of the posterior contralateral negativity (PCN), an
event-related potentials related to attention and visual capture,
General discussion which is negatively correlated with target salience (Töllner,
Zehetleitner, Gramann, & Müller, 2011).
Selecting a visual object as a target for attention or an eye In our study, the distractor (i.e., the salient region) was part
movement is determined by bottom-up and top-down factors. of the same object and therefore always appeared in close
Early responses are biased towards salience, and only late spatial proximity to the target. Distractor appearing close to
responses can be governed by top-down control. However, the target can decrease saccade latencies (Briand, Larrison, &Atten Percept Psychophys
Sereno, 2000; Khan, Heinen, & McPeek, 2010; Khan, pattern was taken as evidence that distractors can be proac-
Munoz, Takahashi, Blohm, & McPeek, 2016) and might tively inhibited (for reviews, see Gaspelin & Luck, 2018,
therefore additionally increase the capture by a sudden-onset 2019; van Moorselaar & Slagter, 2020). In contrast to that,
stimulus. On the contrary, a distractor appearing further away in our paradigm, participants were not able to proactively
from a prespecified saccade target can increase saccade laten- inhibit being biased towards the suddenly appearing salient
cy leading to a remote distractor effect (Ludwig, Gilchrist, & region, even when both the location of the intended saccade
McSorley, 2005; Walker et al., 1997). It is possible that our target and the salient location were known in advance (see Fig.
sudden onset manipulation also affected saccade timing. 3a). Yet the fact that endpoints before target onset shifted into
However, our data cannot reveal if onsets increased or de- the rewarded region and away from the salient region shows
creased saccade latencies, especially since we lack an infor- that participants made use of that information. Our results
mative control condition. Sudden distractor onsets can also suggest that sudden onset stimuli cannot be proactively sup-
give rise to saccadic inhibition that is characterized by a dip pressed, but that suppression requires a preview of the target
in the latency distribution around 70–100 ms after distractor as suggested by the process of visual marking (Watson &
onset (Bompas, Campbell, & Sumner, 2020; Bompas & Humphreys, 1997; Watson, Humphreys, & Olivers, 2003).
Sumner, 2015; Buonocore & McIntosh, 2008; Edelman & Visual marking is typically studied using visual search tasks
Xu, 2009; Reingold & Stampe, 1999, 2002). Saccadic inhibi- by delaying the onset of a group of items. It is supposed to aid
tion is thought to arise from competing activation in saccade selection in time by collectively rejecting old items using a
planning areas like the superior collicus (SC; Dorris, Olivier, location-based inhibitory template and thereby increasing
& Munoz, 2007; Meeter, Van der Stigchel, & Theeuwes, search efficiency (Watson et al., 2003). Donk and Theeuwes
2010; White et al., 2013). We did not observe any unequivo- (2001) argued that visual marking can be explained by the
cal evidence for saccadic inhibition in experiments where we abrupt onset of luminance-defined targets, because no such
measured endpoints time locked to a suddenly appearing stim- preview benefit can be found under isoluminant conditions.
ulus. The absence of a clear dip around 100 ms after a sudden Our results are consistent with both viewpoints: The abrupt
onset can have several possible reasons: For example, in our onset of the luminance bar biased endpoints in the direction of
experiments, distractor onset and the potential start of saccade the salient region (i.e., the region with the higher luminance
planning have been separated by up to several seconds. contrast), even when the target location was previewed and
Moreover, saccadic inhibition is typically studied with spatial- this old item was thus not prone to rejection (see Fig. 2c).
ly distinct distractors or changes to the full visual display, However, previewing the luminance bar and the to-be-
whereas in our paradigm, target and distractor were parts of rejected salient region appeared to reduce the bias caused by
the same object. Relatedly, the activation of top-down signals the onset of the luminance bar (Fig. 4b compared with Fig.
in SC is suppressed by sudden distractor onsets, but rebounds 2c).
if the distractor is spatially close to the target (White et al., Preparatory suppression might have been possible if loca-
2013). This suggests that our findings might be restricted to tions were not balanced and participants were given the
sudden onsets close to a prespecified saccade goal, but also chance to learn statistical regularities of target and distractor
render the SC as a possible neural origin. (Ferrante et al., 2018; Wang & Theeuwes, 2018a, 2018b). The
Attention and gaze can be captured not only by suddenly suppression of a distractor might be achieved by different
appearing stimuli but also by other salient targets—for exam- mechanisms and thus reflected in different markers depending
ple, a color or a form singleton (Theeuwes, 1992) or by targets on task, context, and stimulus material (for reviews, see
sharing a feature with a designated target, irrespective of their Chelazzi, Marini, Pascucci, & Turatto, 2019; Noonan,
physical salience (Folk, Remington, & Johnston, 1992; Leber Crittenden, Jensen, & Stokes, 2018). For example, when one
& Egeth, 2006). Recently, it was proposed that these seem- target is preferred over the other based on its location/
ingly opposing viewpoints of either bottom-up or top-down hemifield, a pretarget lateralization in alpha power is observed
capture might be related by a suppressive mechanism (Heuer, Wolf, Schütz, & Schubö, 2017), whereas no alpha
(Gaspelin & Luck, 2018, 2019): salient stimuli have the capa- power lateralization is observed when targets are preferably
bility of capturing attention, but can be voluntarily inhibited. selected because of a feature (Heuer, Wolf, Schütz, & Schubö,
This suppressive mechanism is thought to be reflected in the 2019), although both tasks yield a similar pattern of behavioral
distractor positivity (PD) component of the event-related po- results. A recent study linking ERP markers and single-unit
tential, which can be observed when distractors fail to capture activity in FEF (Cosman, Lowe, Woodman, & Schall, 2018)
attention (Gaspar & McDonald, 2014; Sawaki & Luck, 2010). revealed that FEF activity precedes ERP signals and that FEF,
If a salient item is successfully inhibited as indexed by a PD like LIP (Ipata, Gee, Gottlieb, Bisley, & Goldberg, 2006),
component, then these items cause no preceding attention contributes to target selection and distractor suppression.
shift, which is reflected is the absence of a N2pc component Strikingly, target selection and distractor suppression were
(Gaspelin et al., 2015; Sawaki & Luck, 2010). This ERP achieved by overlapping neural populations. Given theYou can also read