Toronto Region: Integrated Regional Resource Plan - August 9, 2019 - IESO
←
→
Page content transcription
If your browser does not render page correctly, please read the page content below

Toronto Region:
Integrated Regional Resource Plan

 August 9, 2019
Toronto Region
Integrated Regional Resource Plan
This Integrated Regional Resource Plan (IRRP) was prepared by the Independent Electricity
System Operator (IESO) pursuant to the terms of its Ontario Energy Board license, EI-2013-0066.
The IESO prepared the IRRP on behalf of the Toronto Regional Planning Working Group
(Working Group), which included the following members:
Independent Electricity System Operator
Toronto Hydro-Electric System Limited (Toronto Hydro)
Hydro One Networks Inc. (Hydro One)
The Working Group developed a plan that considers the potential for long term electricity
demand growth and varying supply conditions in the Toronto region, and maintains the
flexibility to accommodate changes to key conditions over time.
Copyright © 2019 Independent Electricity System Operator. All rights reserved.
Page ii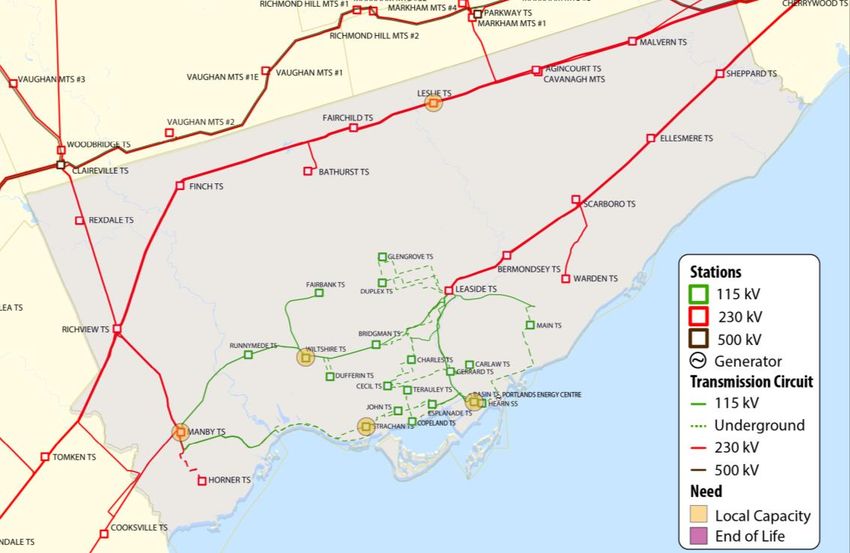
Table of Contents

1. Introduction................................................................................................................. 1
2. Summary of the Recommended Plan ........................................................................... 4
     2.1       The Plan............................................................................................................ 4
3. Development of the Plan ............................................................................................. 7
     3.1       The Regional Planning Process .......................................................................... 7
     3.2       Toronto Region Working Group and IRRP Development ................................... 7
4. Background and Study Scope ...................................................................................... 9
     4.1       Study Scope .................................................................................................... 10
5. Peak Demand Outlook .............................................................................................. 14
     5.1       Demand Outlook Methodology ....................................................................... 14
     5.2       The Outlook for Energy Efficiency ................................................................... 15
     5.3       Outlook for Distributed Energy Resources ....................................................... 16
6. Power System Needs ................................................................................................. 18
     6.1       Needs Assessment Methodology ..................................................................... 18
     6.2       Power System Needs ....................................................................................... 19
           6.2.1    End-of-life Asset Replacement Needs ......................................................... 19
           6.2.2    Supply Capacity Needs .............................................................................. 28
           6.2.3    Load Security Needs .................................................................................. 37
           6.2.4    Load Restoration Needs ............................................................................. 37
           6.2.5    Discretionary Reliability Needs .................................................................. 38
           6.2.6    System Resilience for Extreme Events......................................................... 39
     6.3       Summary of Needs Identified .......................................................................... 40
7. Plan Options and Recommendations......................................................................... 42
     7.1       Evaluating Plan Options for Addressing Needs Identified in Toronto............... 43
           7.1.1    Options for Addressing End of Life Asset Replacement .............................. 44
     7.2       Options for Addressing Supply Capacity Needs .............................................. 51
     7.3       Options for Addressing Regional Supply Capacity Needs ................................ 53
     7.4       Options for Addressing Discretionary Reliability Needs................................... 54
     7.5       The Recommended Plan .................................................................................. 54
           7.5.1    Implementation of Recommended Plan ...................................................... 56

                                                                                                                                        Page iii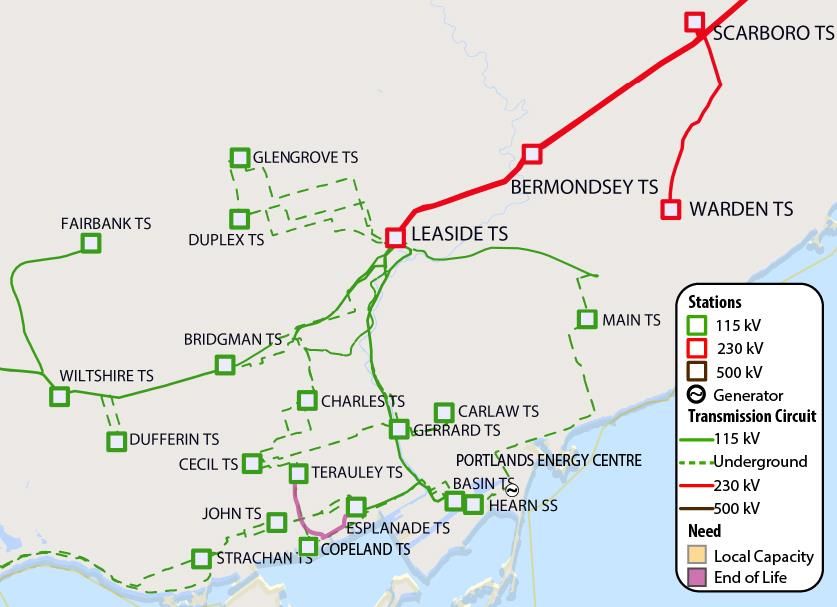
8. Community and Stakeholder Engagement ................................................................ 59
     8.1       Engagement Principles .................................................................................... 59
     8.2       Creating an Engagement Approach ................................................................. 60
     8.3       Engage Early and Often................................................................................... 60
     8.4       Outreach with Municipalities .......................................................................... 61
9. Conclusion ................................................................................................................ 62

                                                                                                                                    Page iv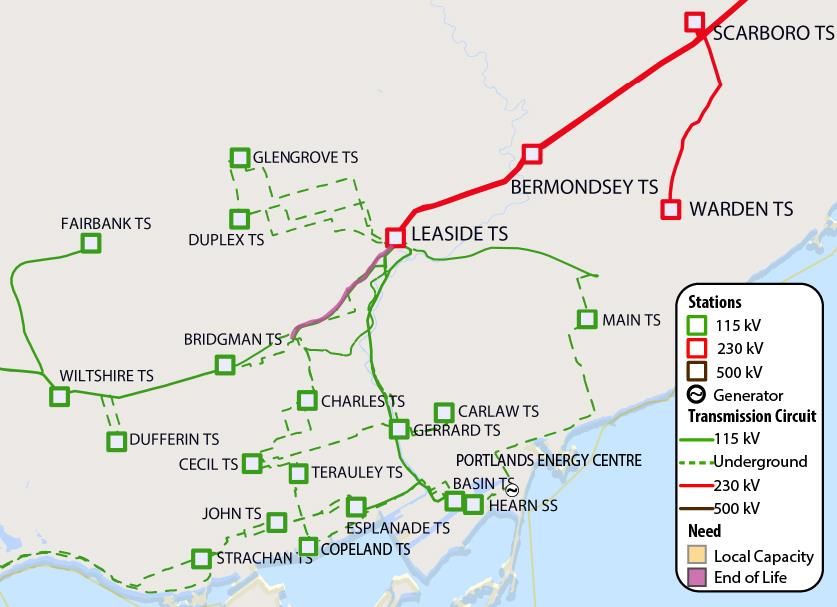
List of Figures

Figure 1-1: Location of the Toronto Region............................................................................... 2
Figure 4-1: The Regional Transmission System Supplying Toronto ..........................................12
Figure 4-2: The Toronto Region Electrical System (Single-Line Diagram) .................................13
Figure 6-1: Leaside to Bloor Street Junction 115 kV Overhead Transmission Lines....................21
Figure 6-2: Leaside to Balfour 115kV Overhead Transmission Lines.........................................22
Figure 6-3: Location of Main TS ..............................................................................................23
Figure 6-4: C5E/C7E 115 kV Underground Transmission Cables ..............................................24
Figure 6-5: Location of Manby TS............................................................................................25
Figure 6-6: Location of John TS ...............................................................................................26
Figure 6-7: Location of Bermondsey TS ...................................................................................27
Figure 6-8: Location of Local (Transformer Station) Capacity Needs ........................................29
Figure 6-9: Demand Outlook for Strachan TS DESNs Compared to Capacity ...........................30
Figure 6-10: Demand Outlook for Basin TS DESN Compared to Capacity ................................31
Figure 6-11: Demand Outlook for Leslie TS Compared to Capacity..........................................32
Figure 6-12: Demand Outlook for Wiltshire TS DESN Compared to Capacity ..........................34
Figure 6-13: Load Restoration Criteria.....................................................................................38
Figure 9-1: IESO Engagement Principles .................................................................................59

                                                                                                                                    Page v
List of Tables

Table 4-1: Summary of Station Facilities (230 kV and 115 kV)...................................................10
Table 4-2: Summary of Transmission Circuits (230 kV and 115 kV) ..........................................11
Table 5-1: Estimated Peak Demand Savings from Codes and Standards ...................................16
Table 6-1: Toronto Region End-of-life Asset Replacement Needs (Near term)...........................20
Table 6-2: Toronto Region End-of-life Asset Replacement Needs (Medium term) .....................23
Table 6-4: Load Security Criteria.............................................................................................37
Table 6-5: Summary of Needs Identified .................................................................................40
Table 7-1: Options for Addressing Leaside Junction to Bloor Street Junction 115 kV Lines ........45
Table 7-2: Options for Addressing Leaside TS to Balfour Junction Transmission ......................46
Table 7-3: Options for Addressing Main TS End-of-life Assets .................................................48
Table 7-4: Summary of Needs and Recommended Actions in Toronto Region .........................57

List of Appendices
Appendix A: Overview of the Regional Planning Process
Appendix B: Peak Demand Outlook for Toronto 2017-2041
Appendix C: Energy Efficiency Forecast
Appendix D: Toronto IRRP Study Results
Appendix E: Station Capacity Assessment
Appendix F: Richview TS to Manby TS Corridor Needs Study
Appendix G: Responses to Public Feedback on Proposed Recommendations

                                                                                                                                   Page vi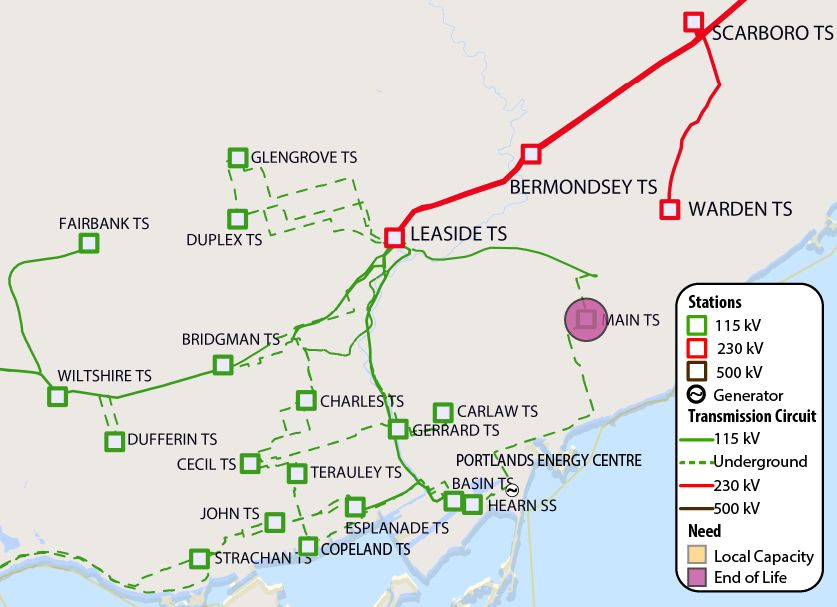
List of Acronyms

       Acronym/
                                            Description
      Alternative
         CHP        Combined Heat and Power

         DER        Distributed Energy Resource
         DESN       Dual Element Spot Network

          DR        Demand Response
          EA        Environmental Assessment
         FIT        Feed-in Tariff
         GTA        Greater Toronto Area

      Hydro One     Hydro One Networks Inc.

         IESO       Independent Electricity System Operator
         IRRP       Integrated Regional Resource Plan

          kV        Kilovolt
         LAC        Local Advisory Committee
         LDC        Local Distribution Company

         LMC        Load Meeting Capability
         LTE        Long-term Emergency Rating

         LTR        Limited Time Rating
         MVA        Mega Volt Ampere

         MW         Megawatt
        NWA         Non-wires Alternative

         OEB        Ontario Energy Board
       ORTAC        Ontario Resource and Transmission Assessment Criteria
         PEC        Portlands Energy Centre

          PV        Photo-voltaic (Solar)

         RAS        Remedial Action Scheme

         RIP        Regional Infrastructure Plan
          SS        Switching Station

                                                                            Page vii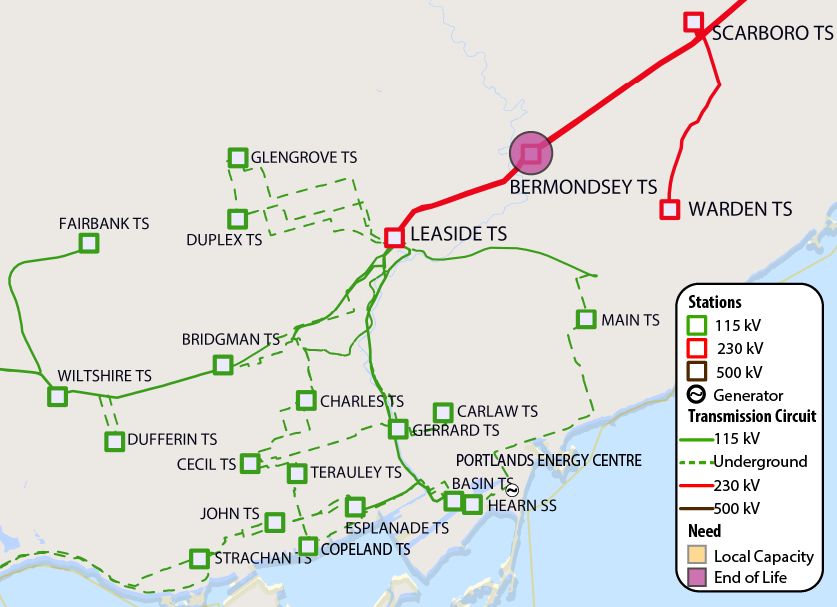
Acronym/
                                      Description
 Alternative
     STE        Short-term Emergency Rating

Toronto Hydro   Toronto Hydro-Electric System Limited
    TPSS        Traction Power Sub-station

     TS         Transmission Station or Transformer Station
Working Group   Technical Working Group for Toronto Region IRRP

                                                                  Page viii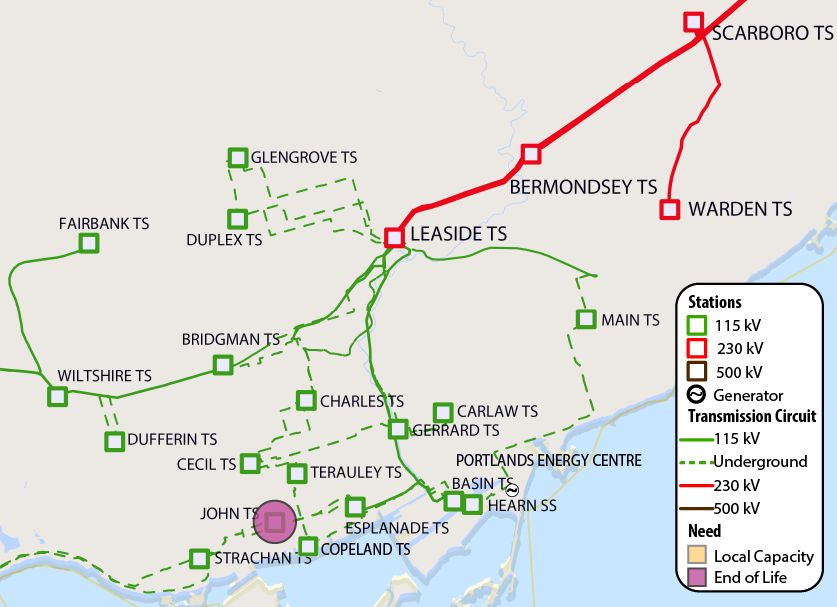
1.       Introduction

This Integrated Regional Resource Plan (IRRP) addresses the regional electricity needs for the
City of Toronto (Toronto region) between 2019 and 2040. 1 This report was prepared by the
Independent Electricity System Operator (IESO) on behalf of a Working Group comprising the
IESO, Toronto Hydro-Electric System Limited (Toronto Hydro), and Hydro One Networks Inc.
(Hydro One).

In Ontario, planning to meet the electrical supply and reliability needs of a large area or region
is carried out through regional electricity planning, a process that was formalized by the
Ontario Energy Board (OEB) in 2013. In accordance with this process, transmitters, distributors
and the IESO are required to carry out regional planning activities for 21 electricity planning
regions across Ontario, at least once every five years. The Toronto region, shown in Figure 1-1,
corresponds with the municipal boundaries of the City of Toronto. Other electricity planning
regions adjacent to the Toronto region include Greater Toronto Area (GTA) West, GTA East,
and GTA North.

1The planning horizon year is 2040: the different time frames within the plan period include the near term (up to five
years out); medium term (six to 10 years out); and long term (11 to 20 years out).

                                                                                                                Page 1 of 62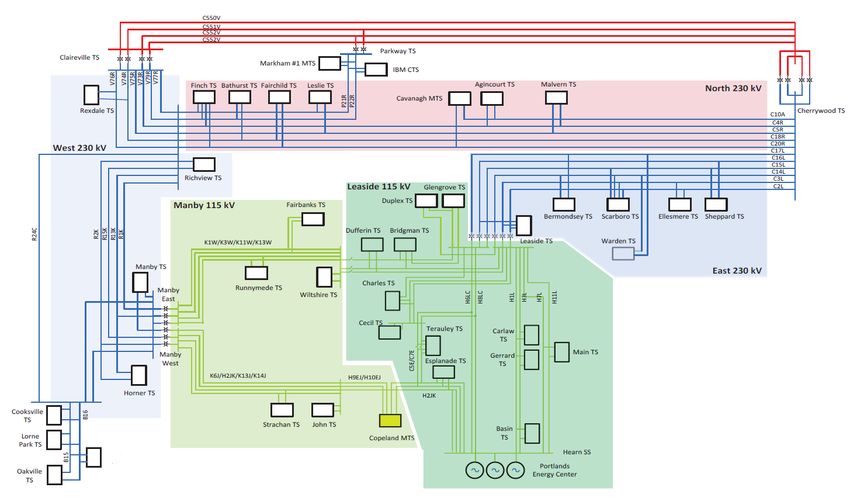
Figure 1-1: Location of the Toronto Region

This IRRP reaffirms the needs and plans previously identified in the Metro Toronto Regional
Infrastructure Plan (RIP) published in January 2016, and the Needs Assessment report
completed in 2017. It identifies new capacity and reliability needs of the electric transmission
system, and recommends approaches to ensure that Toronto’s electricity needs can be met over
the planning horizon. Specifically, the plan recommends approaches for addressing a number of
end of life asset replacement needs and potential longer-term capacity needs to accommodate
growth and city development.

For needs that may emerge in the longer term (11 to 20 years out), the plan maintains flexibility
for new solutions. As the long term needs highlighted by the technical studies are subject to
uncertainty related to future electricity demand and technological change, this IRRP does not
recommend specific investments to address them at this time.

The plan identifies some near term actions to monitor demand growth, explore possible long
term solutions, engage with the community, and gather information to lay the groundwork for
determining options for future analysis. The near term actions recommended are intended to be
completed before the next regional planning cycle, scheduled for 2024 or sooner, depending on
demand growth or other factors that could trigger early initiation of the next planning cycle.

                                                                                              Page 2 of 62
This report is organized as follows:
A summary of the recommended plan for the Toronto region is provided in Section 2;
The process and methodology used to develop the plan are discussed in Section 3;
The context for regional electricity planning in the Toronto region and the study scope
are discussed in Section 4;
The demand outlook scenarios, and energy efficiency and distributed energy resource
(DER) assumptions, are described in Section 5;
Electricity needs in the Toronto region are presented in Section 6;
Options and recommendations for addressing the needs are described in Section 7;
A summary of engagement activities to date, and moving forward, is provided in
Section 8; and
A conclusion is provided in Section 9.
Page 3 of 622. Summary of the Recommended Plan
The recommendations in this IRRP are focused on replacement of assets at their end of life, and
preparing to address local and regional capacity needs emerging in the longer term.
The successful implementation of the recommended actions summarized below is expected to
address the region’s electricity needs until at least the late 2020s.
2.1 The Plan
This plan re-affirms the needs and plans identified in the previous regional planning cycle that
concluded in January 2016, and recommends the actions described below to address the
region’s transmission needs until at least the late 2020s or early 2030s.
The recommendations set forth in this plan are summarized as follows:
Replace end of life overhead line sections H1L/H3L/H6LC/H8LC and
L9C/L12C
The Working Group recommends that Hydro One proceed with planning for the like for like
replacement of these overhead line sections.
Replace end of life transformers at Main TS
The Working Group recommends that Hydro One proceed with planning to replace the existing
transformers with 60/100 MVA transformers.
Continue planning for replacement of C5E/C7E underground transmission
cables
The Working Group recommends that Hydro One continue planning to replace the existing
cables.
Page 4 of 62Continue planning to determine end of life approaches for Manby TS, John
TS, and Bermondsey TS
Manby TS and John TS: The Working Group recommends that detailed planning for end of life
of these assets continue, starting with the RIP. 2
Bermondsey TS: The Working Group recommends that the plan to replace the two end of life
transformers at Bermondsey TS be completed within the scope of the RIP.
Gather information to inform future capacity planning for Basin TS
Since there is currently insufficient information to characterize the needs at Basin TS and inform
specific recommendations in this IRRP, the Working Group proposes that any recommendation
on potential solutions be deferred until the next cycle of regional planning, or earlier, as
required.
Specifically, the Working Group recommends that Toronto Hydro coordinate cont inued
planning activities related to defining the nature, scope and timing of the future capacity need
at Basin TS, and assessment of possible wires and non-wires alternative (NWA) solutions to
address the need.
Proceed with reinforcement of the Richview TS to Manby TS 230 kV corridor
The Working Group recommends that Hydro One proceed with the reinforcement of the
Richview TS to Manby TS 230 kV corridor and begin community engagement, as well as initiate
the environmental assessment (EA).
Keep options available to address long term regional supply capacity needs
For the longer-term regional capacity needs, including the Leaside TS and Manby TS
autotransformers, Manby TS to Riverside Junction lines, and Bayview Junction to Balfour
Junction circuit section, the Working Group recommends that the IESO coordinate continued
planning work and engagement with stakeholders and the community to:
Define and communicate, as soon as practicable, the longer-term capacity needs
2 The RIP is described in S ection 3.1.
Page 5 of 62 Identify opportunities for a range of cost-effective solutions, including NWAs such as
DERs and energy efficiency
Identify potential wires solutions and avoidable costs should these needs be deferred
through NWAs
The information and insights developed through these activities will be used to inform the next
regional planning cycle.
Page 6 of 623. Development of the Plan
3.1 The Regional Planning Process
In Ontario, planning to meet an area’s electricity needs at a regional level is completed through
the regional planning process, which assesses regional needs over the near, medium, and long
term, and develops a plan to ensure cost-effective, reliable electricity supply. A regional plan
considers the existing transmission electricity infrastructure in an area, local supply resources,
forecast growth and area reliability; evaluates options for addressing needs; and recommends
actions to be undertaken.
The current regional planning process was formalized by the OEB in 2013, and is conducted for
each of the province’s 21 electricity planning regions by the IESO, transmitters and local
distribution companies (LDCs) on a five-year cycle.
The process consists of four main components:
1) A needs assessment, led by the transmitter, which completes an initial screening of a region’s
electricity needs;
2) A scoping assessment, led by the IESO, which identifies the appropriate planning approach
for the identified needs and the scope of any recommended planning activities;
3) An IRRP, led by the IESO, which identifies recommendations to meet needs requiring
coordinated planning; and/or
4) An RIP led by the transmitter, which provides further details on recommended wires
solutions.
More information on the regional planning process and the IESO’s approach to regional
planning can be found in Appendix A: Overview of the Regional Planning Process.
3.2 Toronto Region Working Group and IRRP Development
Development of the Toronto region IRRP was initiated in late 2017 with the release of a needs
assessment prepared by Hydro One on behalf of the Toronto Regional Planning Working
Group comprised of the IESO, Toronto Hydro, Alectra Utilities, Veridian Connections (now
elexicon energy) and Hydro One Distribution. The report identified transmission needs that
may require coordinated planning in the Toronto region, with needs limited to the electrical
system within the municipal boundaries of the City of Toronto.
Page 7 of 62Subsequent to the Needs Assessment Report, the IESO prepared a Scoping Assessment
Outcome Report, which recommended that an IRRP be undertaken to address a number of
needs, owing to the potential for coordinated solutions. No sub-regions were identified for the
purpose of carrying out this IRRP. Given the location of the needs identified, the IRRP Working
Group was determined at the scoping assessment stage to include the IESO, Toronto Hydro and
Hydro One. 3
In 2018, the Working Group began gathering data, conducting assessments to identify near term
to long term needs in the area, and recommending actions to address Toronto’s electricity
transmission needs.
3 Distribution system planning does not fall within the scope of a regional planning study , though regional plans may
inform distribution system plans. Distribution system plans are undertaken by local distribution companies and
reviewed and approved by the OEB under a separate process.
Page 8 of 624. Background and Study Scope
This is the second cycle of regional planning for the Toronto region. When the OEB formalized
the regional planning process in 2013, planning was already underway in the Central Toronto
area, a sub-region of Toronto that includes the downtown core. As such, Central Toronto
became one of the Group 1 planning regions, and the first to participate in the formalized
regional planning process.
The first cycle of regional planning for the Toronto region was completed in January 2016 with
the publication of Hydro One’s RIP for the Central Toronto area. Subsequent to the completion
of an IRRP for Central Toronto (in April 2015), the IESO published an update to the IRRP that
accounted for plans to convert commuter heavy rail in the GTA from diesel to electric power.
The second cycle of regional planning for Toronto was initiated by Hydro One in mid-2017.
Following publication of a needs assessment in October 2017, a scoping assessment, released in
February 2018, identified a number of needs requiring further regional coordination, and
recommended that an IRRP for the Toronto region be initiated. No sub-regions within Toronto
were recommended for this IRRP.
Building on past regional studies and taking into account updates to activities, including
investments in electricity infrastructure and Toronto Hydro’s long term outlook for electricity,
this IRRP focuses on:
Identifying recommendations for replacing assets that are reaching end of life
Supporting and enabling growth and planned urban development
Maintaining a high level of reliability performance
To set the context for this IRRP, the scope of the planning study and the area’s existing
electricity system are described in Section 4.1.
Page 9 of 624.1 Study Scope
This IRRP, prepared by the IESO on behalf of the Working Group, recommends options to meet
the regional electricity needs of the Toronto region. Guided by the principle of maintaining an
adequate level of reliability performance as per the Ontario Resource and Transmission Assessment
Criteria (ORTAC), this study recognizes the importance of electricity service to the functioning
of a large urban centre. The Toronto Region Scoping Assessment Outcome Report established
the objectives, scope, roles and responsibilities, and timelines for this IRRP. The plan considers
the long term outlook for electricity peak demand, energy efficiency, and transmission system
capability and transmission asset condition. Options for addressing needs also considered
relevant transmission and distribution system projects and capabilities, community plans, and
distributed energy resources (DERs).
The transmission facilities that were included in the scope of this study are presented in Table
4-1 (stations) and Table 4-2 (circuits).
Table 4-1: Summary of Station Facilities (230 kV and 115 kV)
Leaside 115 kV Manby 115 kV East 230 kV North 230 kV West 230 kV
Basin TS Copeland TS Bermondsey TS Agincourt TS Horner TS
Bridgman TS Fairbanks TS Ellesmere TS Bathurst TS Manby TS3
Carlaw TS John TS Leaside TS4 Cavanagh TS Rexdale TS
Cecil TS Runnymede TS Scarboro TS Fairchild TS Richview TS
Charles TS Strachan TS Sheppard TS Finch TS
Dufferin TS Wiltshire TS Warden TS Leslie TS
Duplex TS Malvern TS
Esplanade TS
Gerrard TS
Glengrove TS
Main TS
Terauley TS
Hearn SS5
4 Includes the step-down transformers and 230/115 kV autotransformers
5 Hearn S witching S tation (S S )
Page 10 of 62Table 4-2: Summary of Transmission Circuits (230 kV and 115 kV)
230 kV 115 kV
C10A C5E K11W
C14L C7E K12W
C15L D11J K13J
C16L D12J K14J
C17L D6Y K1W
C20R H10DE K3W
C2L H11L K6J
C3L H12P L12C
C4R H13P L13W
R1K H14P L14W
R2K H1L L15
R13K H2 L16D
R15K H2JK L18W
R24C H3L L2Y
K21C H6LC L4C
K23C H7L L5D
H8LC L9C
H9DE
Transmission supply is provided to Toronto Hydro from 35 step-down transformer stations that
are supplied by transmission voltages operating at either 230 kV or 115 kV. Toronto Hydro
delivers electricity from these transmission supply points to its customers through its own
electricity distribution system. Eighteen 230 kV step-down transformer stations supply the
eastern, western and northern parts of Toronto (18 of these stations supply 27.6 kV voltage and
two also supply 13.8 kV electricity to the distribution system); and 17 115 kV step-down stations
supply the Central Toronto area (15 at 13.8 kV and two at 27.6 kV on the distribution side). The
supply to these central 115 kV stations comes from two 230 kV/115 kV autotransformer stations
(Leaside TS and Manby TS). The Toronto region also includes the Portlands Energy Centre
(PEC) connected to the 115 kV transmission system (within the Leaside TS sector). The PEC
550 MW combined-cycle power plant plays an important role locally, and for the provincial
electricity system, in providing reliable capacity to meet electricity demand, as well as reactive
power and voltage support. Hearn SS provides 115 kV switching facilities for the Leaside area
and also connects PEC to this system.
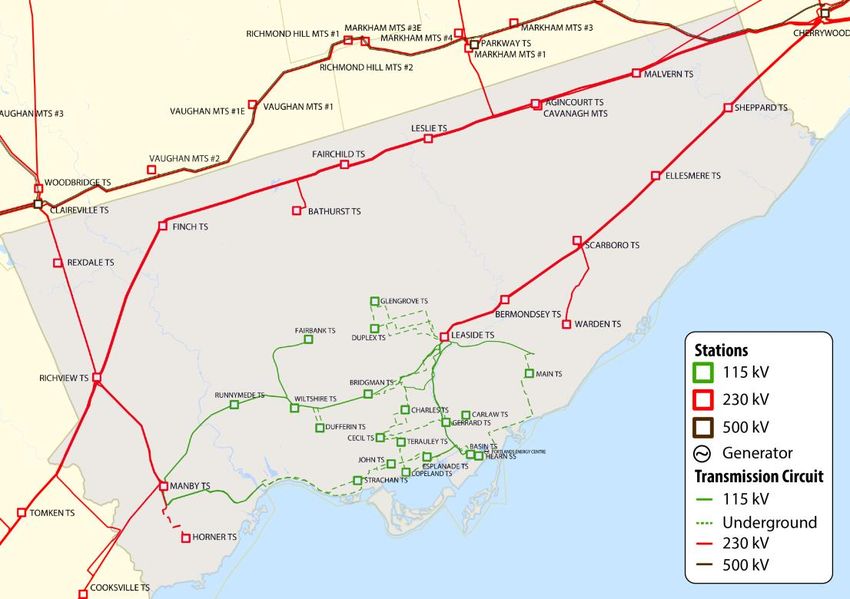
Page 11 of 62The Toronto region and its transmission supply infrastructure are shown in Figure 4-1 (map)
and Figure 4-2 (single line diagram). Transmission circuit nomenclature used throughout this
report (e.g., H1L, H3L, etc.) can be referenced using the single line diagram.
Figure 4-1: The Regional Transmission System Supplying Toronto
Page 12 of 62Figure 4-2: The Toronto Region Electrical System (Single-Line Diagram)
Completing the Toronto IRRP involved:
Preparing a long term electricity peak demand outlook (forecast);
Examining the load meeting capability and reliability of the transmission system
supplying the region, taking into account facility ratings and performance of
transmission elements, transformers, local generation, and other facilities (such as
reactive power devices);
Assessing system needs by applying a contingency-based assessment and reliability
performance standards for transmission supply in the IESO-controlled grid as described
in Section 7 of ORTAC;
Confirming identified end of life asset replacement needs and timing with Hydro One;
Establishing alternatives to address system needs, including, where feasible and
applicable, possible energy efficiency, generation, transmission and/or distribution, and
other approaches such as NWAs;
Engaging with the community on needs, findings, and possible alternatives;
Evaluating alternatives to address near and long term needs; and
Communicating findings, conclusions, and recommendations within a detailed plan.
Page 13 of 625. Peak Demand Outlook
The electricity system needs that are in scope for regional planning are driven by the limits of
the transmission infrastructure supplying an area, which is sized to meet peak demand
requirements (rather than energy demand requirements).6 Peak demand requirements
appearing at the station level are aggregated to understand the limits of the regional
transmission system supplying the area as well as individual stations. Regional planning
typically focuses on the regional-coincident peak demand to assess regional transmission needs,
and individual station peaks to assess local transformer station capacity needs (the demand
outlook is broken down spatially by transformer station, or each dual element spot network
(DESN) that makes up a station7).
Individual stations within the Toronto study area typically experience peak loading at around
the same time (e.g., weekdays, generally between 4 and 6 p.m. in summer, after consecutive hot
days). There is also a high degree of coincidence between when individual stations peak and
when the region peaks.
5.1 Demand Outlook Methodology
Toronto Hydro, in consultation with the Working Group, prepared a peak demand outlook at
the transformer station bus level per IESO requirements for performing this study.
The outlook was developed in two parts:
1. Development of the Gross Peak Demand Outlook (Gross Outlook)
2. Development of the Net Peak Demand Outlook (Net Outlook)
The Gross Outlook recognizes the strengths of different forecasting methodologies for different
time periods. The first 10 years is based upon the linear regression of past peak demands
combined with known load additions and load redistributions. The period beyond 10 years is
6 Peak demand of the electric system is typically measured in terms of megawatts (MW) capacity; energy is the
capacity needed over a period of time, for example, one megawatt used over one hour is a megawatt-hour (MWh).
7 A DES N refers to a standard station layout, where two supply transformers are configured in parallel to supply one
or two medium-voltage switchgear (for example, 13.8 kV or 27.6 kV), which the distributor uses to supply load
customers. This parallel dual supply ensures reliability can be maintained in the event of an outage or planned
maintenance. A single local transformer station can have one, two, or more individual DES Ns.
Page 14 of 62based upon the growth rates predicted from an econometric model that takes population,
employment, and long term weather into account.
The Gross Outlook is a "business-as-usual" peak demand forecast under extreme weather. The
Net Outlook considers load drivers that are over and above those considered in the "business as
usual" Gross Outlook. These "new and emerging" load drivers were:
electric vehicles
electrification of mass transit
fuel switching from natural gas to electric for space heating and water heating
energy storage
The result was a station-by-station outlook of annual peak demand through to 2041. More
details may be found in Appendix B: Peak Demand Outlook for Toronto 2017-2041.
5.2 The Outlook for Energy Efficiency
The outlook for future peak demand savings is based on mandated efficiencies from Ontario
building codes and equipment standards, which set minimum energy efficiency levels through
codes and regulations. To estimate the impact of efficiency codes and standards in the Toronto
region, the peak demand savings for the residential, commercial and industrial sectors were
estimated at the provincial level, compared with Toronto’s station-based peak demand forecast,
and expressed as a percentage of peak demand offset on an annual basis. This estimation took
into account the breakdown of the peak demand at the station of residential, commercial, and
industrial sector demand. Estimated peak demand savings, in MW, were calculated based on
the percentage demand offset and the Demand Outlook described in Section 5.1.
These savings were subtracted from the demand outlook, and this forecast with efficiency codes
and standards was used to test the sensitivity of the need dates as identified by the Net Outlook
described in Section 5.1.
Table 5-1 shows the total peak demand savings attributable to efficiency codes and standards
for the Toronto area, for selected years within the planning horizon.
Page 15 of 62Table 5-1: Estimated Peak Demand Savings from Codes and Standards
Year 2020 2025 2030 2040
Estimated savings (MW) 86 159 242 311
Source: IESO
A more detailed methodology on the outlook for energy efficiency, including assumptions and
a breakdown by station and year, is provided in Appendix C: Energy Efficiency Forecast.
5.3 Outlook for Distributed Energy Resources
In addition to energy efficiency, DERs in the Toronto region have previously offset, and are
expected to continue to offset peak demand. Previous procurements, including the Feed-in
Tariff (FIT) Program, have helped to increase the amount of renewable DERs in Toronto. Other
competitive generation procurements have also resulted in additional DER types, such as
combined heat and power (CHP) projects. 8 The DERs under contract with the IESO include a
mix of solar photovoltaics (PV), CHP, and wind resources.
Further to these, competitive procurement pilots run by the IESO for energy storage resources
have resulted in some energy storage projects in the region, and are supporting efforts to better
understand the barriers related to integration of energy storage into Ontario’s electricity market.
The peak demand impact of DERs that were connected to the system at the time the demand
outlook was produced would be implicitly accounted for in the outlook. Given the difficulty of
predicting where future DERs may be located, and uncertainty around future DER uptake, no
further assumptions have been made regarding future DER growth. Instead of assuming future
DER growth implicitly as a load modifier in the demand outlook, the potential of future DERs
will be considered as potential solution options.
While the FIT Program and other competitive procurements for small-scale generation,
including CHP, have ended, the IESO has been engaged in developing market-based
mechanisms to enable a variety of electricity resources to compete in the electricity market. In
addition, the IESO is engaged in several activities to enable DERs as alternatives to wires-based
solutions. This includes working with other sector participants to identify and overcome
8 S ince the IRRP forecast was developed, contracts for some generators included in the 2017 list have been
terminated.
Page 16 of 62barriers to DER participation and implementation, as many of the issues extend beyond the
IESO’s mandate.
The IESO’s work and other electricity sector initiatives related to DER barriers are expected to
inform ongoing discussions on possible future DER options in Toronto, as per the
recommendations made in this IRRP.
Page 17 of 626. Power System Needs
Based on the demand outlook, system capability, identified end of life asset replacement needs,
and application of provincial planning criteria, the Working Group identified electricity needs
in the Toronto region in the near, medium, and long term.
6.1 Needs Assessment Methodology
ORTAC, 9 the provincial criteria for assessing the reliability of the transmission system, was
applied to assess supply capacity and reliability needs. ORTAC includes criteria related to the
assessment of both the bulk transmission system and local or regional reliability requirements.
See Appendix D: Toronto IRRP Study Results, and Appendix E: Station Capacity Assessment,
for more details.
In applying ORTAC, three broad categories of needs can be identified:
Local Capacity describes the electricity transmission system’s ability to deliver power to
LDCs through regional step-down transformer stations. This is determined by the
Limited Time Rating (LTR) of the station, which is typically determined by the rating of
its smallest transformer(s), under the assumption that the largest transformer is out of
service. 10
Regional Capacity is the electricity transmission system’s ability to provide continuous
supply to LDCs in a local area, which is limited by the load meeting capability (LMC) of
the transmission facilities in the area. The LMC is determined by evaluating the
maximum peak demand that can be supplied to an area accounting for limitations of the
transmission element(s) (e.g., a transmission line, group of lines or autotransformer),
when subjected to contingencies and criteria prescribed by ORTAC. LMC studies are
conducted using power system simulations analysis (see Appendix D, Toronto IRRP
Study Results, for more details). Regional capacity needs are identified when the peak
demand for the area exceeds the LMC of regional transmission facilities.
Load Security and Restoration is the electricity transmission system’s ability to
minimize the impact of potential supply interruptions in the event of a credible
contingency (e.g., a transmission outage considered for planning purposes), such as an
outage on a double-circuit tower line resulting in the loss of both circuits. Load security
9 http://www.ieso.ca/imoweb/pubs/marketadmin/imo_req_0041_transmissionassessmentcriteria.pdf
10 A station’s rating is determined by its most limiting component(s), which may not always be the transformer(s).
Page 18 of 62describes the maximum limit of load interruption that is permissible in the event of a
transmission outage considered for planning. These limits reflect past planning practices
in Ontario. Load restoration describes the electricity transmission system’s ability to
restore power to a transmission customer (e.g., LDC) affected by a transmission outage
within specified time frames. Specific requirements can be found in ORTAC, Section 7,
Load Security and Restoration Criteria.
The plan also identifies requirements related to the end of life of transmission assets. End-of-life
asset replacement needs are identified by the transmitter based on a variety of factors, such as
asset age, condition, expected service life, and risk associated with the failure of the asset.
Replacement needs identified in the near and early medium term time frame typically reflect
the assessed condition of the assets, while replacement needs identified in the longer term are
often based on the equipment’s expected service life. As such, any recommendations for
medium term needs or those farther out reflect a potential for the need date to change based on
priority and/or updates to asset condition.
6.2 Power System Needs
Through the planning studies for the Toronto IRRP, the Working Group identified four main
categories of needs: (1) end of life asset replacement, (2) local transformer station capacity,
(3) regional supply capacity, and (4) load security and restoration. In addition, pursuant to
ORTAC provisions, maintaining a higher level of reliability performance (i.e., above the
minimum standards) was also considered which identified some ‘discretionary’ reliability
needs. 11 The specific needs under each of these categories are explained in the sections that
follow.
6.2.1 End-of-life Asset Replacement Needs
Hydro One identified a number of end of life transmission asset replacement needs for the
Toronto region in the needs assessment phase of this regional planning cycle, with several
needs arising in the near to medium term.
11‘Discretionary’ reliability needs are transmission system issues that are flagged through the application of a
uniform set of planning criteria for all of Toronto’s transmission system (e.g., by applying ‘bulk power system’
criteria to ‘local area’ facilities). This identifies issues that are discretionary in the sense that the reliability
performance of the system complies with the criteria; but may represent opportunities to improve reliability to an
area if cost-effective opportunities are available.
Page 19 of 62Since end of life needs are based on the best available asset condition information at a given
point, the timing of asset replacement can change, as more recent asset condition results become
available. If asset deterioration occurs faster than predicted, need dates may need to be
advanced. As a result, the scope and timing of some of these needs have been updated since the
needs and scoping assessments were completed.
6.2.1.1 Near-term Asset End-of-life Replacement Needs
Three near term asset end of life replacement needs were addressed within the scope of this
plan (Table 6-1). These needs are described further in this Section. The options considered for
addressing these needs are described in Section 7.1.1.
Table 6-1: Toronto Region End-of-life Asset Replacement Needs (Near term)
Facilities Need Expected Timing
Leaside Junction to Bloor S treet
End of life of the approximate 2-km
115 kV overhead transmission lines 2022-2023
overhead line sections
(H1L/H3L/H6LC/H8LC)
Leaside TS to Balfour Junction 115 kV
End of life of the approximate 3.6-km
overhead transmission lines 2023-2024
overhead line sections
(L9C/L12C)
End of life of transformers T3 and T4,
Main TS 115 kV line disconnect switches, and 2021-2022
115 kV c urrent voltage transformers
Leaside to Bloor Street 115 kV overhead transmission lines (H1L/H3L/H6LC/H8LC)
The 115 kV overhead transmission lines H1L, H3L, H6LC, and H8LC provide supply to the
eastern part of central Toronto from Leaside TS. The end of life part of the line is a 2-km section
that runs from Leaside Junction to Bloor Street Junction in the Don Valley, and is on a common
tower with four circuits (Figure 6-1). Hydro One has determined the conductors are reaching
the end of their useful life, and will need to be replaced by 2022-2023 to maintain safety and
reliability.
Page 20 of 62Figure 6-1: Leaside to Bloor Street Junction 115 kV Overhead Transmission Lines
Leaside to Balfour 115kV overhead transmission lines (L9C/L12C)
The 115 kV overhead transmission lines L9C and L12C provide supply to central Toronto from
Leaside TS (to Cecil TS). The section of the line that runs between Leaside TS and Balfour
Junction is about 3.6 km in length, and runs through the Don Valley and along an existing rail
corridor (Figure 6-2). This line is more than 80 years old and the conductors have been
identified by Hydro One as reaching the end of their useful life, and requiring replacement by
2023-2024 to maintain safety and reliability.
Page 21 of 62Figure 6-2: Leaside to Balfour 115kV Overhead Transmission Lines
Main TS transformers and associated station equipment
Main TS is a local transformer station serving approximately 60 MW of load in east-central
Toronto, including the Danforth and Beach neighbourhoods (Figure 6-3). The two transformers
at the station, T3 and T4, are currently about 50 years old. Hydro One is currently working with
Toronto Hydro to replace the end of life transformers, along with other equipment, such as
115 kV line disconnect switches, current transformers and voltage transformers.
Main TS is supplied by a combination of overhead and underground 115 kV circuits from
Leaside TS to Hearn TS (H7L and H11L). Two sections of the original underground cable
supply circuits are currently undergoing refurbishment due to their age (about 60 years old)
and condition.
The station is currently more than 70 per cent utilized and resupplying the area load via
adjacent station facilities is not possible. As with many established areas of the city, urban
growth and development is likely in the Main TS area.
Page 22 of 62Figure 6-3: Location of Main TS
6.2.1.2 Medium-term Asset End-of-life Replacement Needs
Four asset end of life replacement needs occurring in the medium term were considered within
the scope of this plan (Table 6-2). These needs are described further in this Section. The options
considered for addressing these needs are described in Section 7.1.1.
Table 6-2: Toronto Region End-of-life Asset Replacement Needs (Medium term)
Facilities Need Expected Timing
Esplanade TS to Terauley TS
End of life of underground cables from
115 kV underground
Esplanade TS to Terauley TS in downtown 2024-2025
transmission cables
Toronto
(C5E and C7E)
End of life of major station equipment,
including: autotransformers T7, T9, and T12,
Manby TS 2025-2026
step-down transformer T13, and the 230 kV
yard
End of life of transformers T1, T2, T3, T4, T6,
John TS 2026-2027
and 115 kV breakers
Bermondsey TS End of life of transformers T3 and T4 2025-2026
Page 23 of 62C5E/C7E 115 kV underground transmission cables
The 115 kV underground transmission cables C5E and C7E provide supply to Terauley TS in
Toronto’s downtown core. Installed more than 58 years ago, these paper-insulated, low-
pressure oil filled cables extend about 3.6 km from Esplanade TS to Terauley TS, and are
partially routed near Lake Ontario (Figure 6-4). They have been deemed by Hydro One to be at
the end of their useful life, and requiring replacement as soon as possible, given that the risk of
cable failure resulting in oil leaks and adverse environmental impacts is increasing with time.
Figure 6-4: C5E/C7E 115 kV Underground Transmission Cables
Manby TS
Manby TS is a major switching and autotransformer station supplying the western portion of
the central Toronto 115 kV transmission system (Figure 6-5). Station facilities include six 230 kV/
115 kV autotransformers (T1, T2, T7, T8, T9 and T12), a 230 kV switchyard, a 115 kV switchyard,
and three DESNs with six 230/27.6 kV step-down transformers that supply customers in the
immediate vicinity of the station. Three of the autotransformers (T7, T9 and T12) and one of the
step-down transformers (T13) are close to 50 years old and, along with the 230 kV oil circuit
Page 24 of 62breakers, have been identified to be at the end of their useful life. All of this end of life
equipment is scheduled to be replaced in 2025-2026.
Addressing end of life needs at Manby TS represents a major undertaking that needs to be well
coordinated in consideration of Toronto’s long term needs and future supply options.
Figure 6-5: Location of Manby TS
John TS
Built in the 1950s, John TS is connected to the 115 kV Manby West system and supplies much of
Toronto’s downtown financial district (Figure 6-6). Station facilities include six 115/13.8 kV step-
down transformers (T1, T2, T3, T4, T5 and T6) and a 115 kV switchyard. Toronto Hydro’s
switchgear at the station has reached the end of its useful life, and is expected to be replaced
starting in 2024-2025. In addition, Hydro One has identified the step-down transformers at
John TS (T1, T2, T3, T6), as well as the 115 kV breakers to be at the end of their useful life and
require replacement within the near to medium term. Because of their deteriorated condition,
transformer T4 has already been replaced and T1 is scheduled to be replaced in Q4 2019. The
approximate timing for the station refurbishment is 2026-2027.
Page 25 of 62Figure 6-6: Location of John TS
Page 26 of 62Bermondsey TS
Bermondsey TS supplies customers in the western part of Scarborough (Figure 6-7). The station
is comprised of two DESNs, one of which (T3/T4 DESN 2) was built in 1965, and the other
(T1/T2 DESN 1) in 1990. DESN 2 has been identified by Hydro One to be at its end of life and is
expected to be replaced by 2025-2026. Bermondsey TS has a total of 18 distribution feeders
supplying Toronto Hydro customers: the older T3/T4 DESN 2 has 12 feeders, while the newer
T1/T2 DESN 1 has six feeders. The total loading on the station is forecast to remain below its
capacity over the planning horizon. This provides an opportunity to review configuration and
component sizes to best meet future needs.
Figure 6-7: Location of Bermondsey TS
Page 27 of 626.2.2 Supply Capacity Needs
Supply capacity needs at local step-down transformer stations were found at five transformer
stations. A breakdown by year of the forecasted station loadings, as well as a more detailed
description of the methodology for carrying out this assessment, is provided in Appendix E:
Station Capacity Assessment.
6.2.2.1 Local Transformer Station Capacity Needs
Table 6-3: Toronto Region Transformer Station Capacity Needs
Station Description Timing 12,13
2023 for T5/T6
A transformer capacity need was identified for the load
Manby TS 2032 for T3/T4
supplied by all three DESNs 14
2034 for T13/T14
A transformer capacity need was identified for the load 2030 for T13/T15
Strachan TS
supplied by both DESNs 2033 for T12/T14
A transformer capacity need was identified for the load
Basin TS 2033
supplied by the T3/T5 DESN (the only DESN at Basin)
A transformer capacity need was identified for the load
Leslie TS 2033
supplied by the T3/T4 DESN
A transformer capacity need was identified for the load
Wiltshire TS 2035
supplied by the T1/T6 DESN
The locations of the local capacity needs are shown in Figure 6-8; four of the five local capacity
needs are situated in the Central Toronto area.
12 The timing presented in the table is consistent with the demand outlook provided by Toronto Hydro (net of new
energy efficiency and distributed energy resources until the end of 2020); the timing of these capacity needs inclusive
of future energy efficiency codes and standards is discussed in the subsections following the table.
13 Even though local transformer station capacity needs are presented in terms of the individual DES Ns within the
station, for the purpose of planning and implementing solutions, the needs at each station are generally addressed as
one need requiring a holistic solution.
14 This need was identified and a solution was recommended in the 2015 Central Toronto IRRP. The status of the 2015
recommendation is discussed in S ection 7.2.
Page 28 of 62Figure 6-8: Location of Local (Transformer Station) Capacity Needs
Manby TS (step-down transformation capacity)
Manby TS currently consists of three DESNs connected to the 230 kV system. This step-down
transformer station, which supplies customers in the area surrounding Islington Town Centre
from the Humber River west to the Toronto City limit, shares a yard with, but is separate from,
the larger Manby 230/115 kV autotransformer station that provides 115 kV supply to the
western portion of downtown Toronto. With a combined capacity of 240 MVA (216 MW), all
three DESNs are forecast to exceed their capacity, starting in 2023 for the T5/T6 DESN 2, 2032
for the T3/T4 DESN 1, and 2034 for T13/T14 DESN 3.
The peak demand impacts of efficiency codes and standards were not taken into account for the
timing of this need. Demand at Manby TS has already exceeded the station’s capacity in several
recent years. This issue was discussed in the 2015 Central Toronto IRRP, solutions were
evaluated, and the recommendations to address the need are currently being implemented by
Hydro One and Toronto Hydro. These include building a second DESN at Horner TS in south
Etobicoke, and transferring load from Manby TS to the new Horner DESN.
Page 29 of 62Strachan TS
Strachan TS consists of two DESNs connected to the 115 kV system supplied from Manby TS
(West Yard). Strachan TS supplies load to the west of the downtown core at 13.8 kV distribution
voltage. The two DESNs have a combined capacity of 188 MVA, or 169 MW (80 MVA for
T12/T14 DESN 1, and 108 MVA for T13/T15 DESN 2).
The T13/T15 DESN 2 is forecast to reach its capacity as early as 2030, while the T12/T14 DESN 1
is forecast to reach its capacity as early as 2033. Assuming the future potential impact of
efficiency codes and standards, the timing of this need is deferred to 2033 and 2038 for the
T13/T15 DESN 1 and T12/T14 DESN 2, respectively.
Figure 6-9 shows the demand outlook for the two DESNs at Strachan TS, as compared to the
individual capacity of each DESN.
F igure 6-9: Demand Outlook for Strachan TS DESNs Compared to Capacity
Page 30 of 62Basin TS
Basin TS has a single DESN (T1/T2) connected to the 115 kV system, supplying two low-voltage
switchgear at a distribution voltage of 13.8 kV. The station has a total capacity of 98 MVA, or
approximately 88 MW.
Basin TS is forecast to reach its capacity as early as 2033. Assuming the future potential impact
of efficiency codes and standards (post-2020), the timing of this need is deferred to 2040.
Figure 6-10 shows the demand outlook for Basin TS, as compared to the station capacity.
Figure 6-10: Demand Outlook for Basin TS DESN Compared to Capacity
In addition to the forecast growth, the City of Toronto and Waterfront Toronto have been
engaged in a master planning exercise for the Port Lands neighbourhood redevelopment and
Page 31 of 62re-naturalization of the mouth of the Don River. These plans involve a number of requests to
examine relocation or redesign parts of the 115 kV transmission network in and around
Basin TS, including the possible relocation of Basin TS itself.
Given the absence of concrete plans and timelines for urban development in the area, the timing
of the capacity need at Basin TS is uncertain.
Leslie TS
Leslie TS has two DESNs connected to the 230 kV system. The T1/T2 DESN 1 supplies load at
27.6 kV and 13.8 kV, while the T3/4 DESN 2 supplies load at 27.6 kV. The total station capacity
of Leslie TS is 325 MW. The T1/T2 DESN 1 has a capacity of 149 MVA (134 MW) and the T3/T4
DESN 2 has a capacity of 194 MVA (175 MW). While the other three transformers are relatively
new (installed between 1988 and 2012), transformer T1, which was installed in 1963, may
require replacement within the planning horizon of this IRRP, even though it has yet to be
identified as being at the end of its life.
The T3/T4 DESN 2 is forecast to reach its capacity as early as 2033. Assuming the potential
impact of future efficiency codes and standards, the timing of this need is deferred to 2039.
Figure 6-11 shows the demand outlook for the two DESNs at Leslie TS, as compared to the
individual capacity of each DESN.
Figure 6-11: Demand Outlook for Leslie TS Compared to Capacity
Page 32 of 62Wiltshire TS
Wiltshire TS has two DESNs connected to the 115 kV system supplied from the
Manby TS (East Yard). Wiltshire TS supplies customer demand to the northwest
of the downtown core, including the Junction neighbourhood, at 13.8 kV
distribution voltage. The two DESNs have a combined capacity of 151 MVA, or
136 MW: 51 MVA for the T1/T6 DESN 1, and 100 MVA for the T2/T7 DESN 2.
These two DESNs supply three Toronto Hydro 13.8 kV buses.
The outlook is forecasting load growth at Wiltshire TS, which can be attributed t o
growth and urban redevelopment in the area.
The T1/T6 DESN 1 is forecast to reach its capacity as early as 2035. Assuming the
future potential impact of efficiency codes and standards, the timing of this need
is beyond the study period.
Figure 6-12 shows the demand outlook for the two DESNs at Wiltshire TS, as
compared to the capacity of each DESN.
Page 33 of 62Figure 6-12: Demand Outlook for Wiltshire TS DESN Compared to Capacity
6.2.2.2 Regional Supply Capacity Needs
Regional capacity needs are related to the 230 kV or 115 kV transmission system that delivers
electricity from the interconnected grid into Toronto. The planning studies re-tested the need
for the Richview TS to Manby TS 230 kV corridor upgrades that were recommended in the
previous planning cycle. The results of this assessment reaffirm this need and are reported in
Page 34 of 62this section. In the longer term, regional supply capacity needs emerge at Leaside TS,
Manby TS, and on some 115 kV circuits within the Manby and Leaside Sectors.
Richview TS to Manby TS 230 kV corridor
The previous cycle of regional planning recommended that the 230 kV bulk supply to
Manby TS from Richview TS be reinforced to accommodate demand growth in Toronto,
primarily driven in the near term by mass transit projects. The planning studies undertaken for
this IRRP re-tested the need for this additional LMC upstream of Manby TS, accounting for
changes in assumptions related to the revised demand outlook provided by Toronto Hydro for
the purpose of undertaking this IRRP, and the peak demand outlook for Cooksville west
stations from the 2015 GTA West Needs Assessment.
The assessment confirmed that, under normal system configuration, the most limiting
contingency is the loss, in 2021, of circuit R15K, which would cause R2K (also running from
Richview TS to Manby TS) to exceed its capacity rating. This limitation exists regardless of
whether the Metrolinx traction power substation (TPSS) is in-service; however, the additional
capacity will support further mass transit electrification.
Without reinforcement to the Richview TS to Manby TS 230 kV circuits, the ability to transfer
Dufferin TS to Manby East supply can become limited during summer peak conditions,
following the same R15K single contingency. As discussed below (under Leaside TS and
Manby TS autotransformers), transferring Dufferin TS to Manby TS supply is a possible control
action in a PEC out-of-service scenario (as well as other issues that could impact supply in the
Leaside TS sector). Since having this control action available helps ensure a reliable and resilient
transmission supply to Toronto, the Working Group continues to recommend reinforcement of
the Richview TS to Manby TS 230 kV circuits with a target in -service date as soon as possible.
The detailed assessment of the Richview TS to Manby TS corridor need is provided in
Appendix F: Richview TS to Manby TS Corridor Study.
Supply to downtown Toronto from Manby West (Manby to Riverside Junction)
The Manby West supply sector comprises four 115 kV supply circuits (H2JK, K6J, K13J, and
K14J), which run from Manby TS to Riverside Junction on overhead lines, with two (and in
some spans, up to four) circuits on a common structure. From Riverside Junction, these circuits
Page 35 of 62run underground to supply the downtown core. 15 The Manby West supply sector is considered
“non-bulk” and is designed to continuously supply demand up to the loss of a single circuit.
The planning studies are showing that all four Manby TS to Riverside Junction circuits violate
the reliability criteria between 2030 and 2040. Under the most severe single element loss, the
remaining circuits can be as much as 120 per cent overloaded by 2040. This is a reliability
concern that will need to be addressed in the long term.
Leaside TS and Manby TS autotransformers
The assessment of the Leaside autotransformer capacity is related to the presence and capacity
of the 550 MW PEC facility, as both PEC and Leaside TS supply the Leaside sector. With an
outage to the PEC steam turbine generator, the output of the plant would be reduced to
160 MW. Under this scenario, the Leaside autotransformers will begin to exceed their capacity
limits by the 2030 to 2040 time frame, following outages on the 230 kV transmission lines that
supply Leaside TS from Cherrywood TS upstream. With a full PEC outage, two of the six
autotransformers at Leaside TS (T15 and T16) would be overloaded under peak demand
conditions.16
During short-term outages of elements of PEC, system control actions to reduce the Leaside
sector load through the transfer of Dufferin TS to the Manby sector will alleviate pressure on the
Leaside autotransformers. While this is an acceptable short-term measure, it is not considered a
permanent solution because it exposes the Manby sector, and Dufferin TS customers in
particular, to supply security risks related to transmission outages in the Manby sector.
Manby TS autotransformer capacity needs were identified as emerging by the 2030 to 2040 time
frame. This capacity constraint is related to the rating of the smallest autotransformer at
Manby TS (T12) following the loss of a companion transformer. There may be value in factoring
these findings into the end of life replacement of the Manby TS autotransformers in 2025-2026, if
there is a cost-effective and technically feasible means of addressing this capacity constraint
within the scope of the replacement.
15 The underground section from Riverside Junction to S trachan Avenue have been recently refurbished due to its age
and condition.
16 The 2030 forecast year was used to assess the full PEC outage scenario; it is likely that if such a scenario were
experienced today at the time of system peak, then the Leaside TS autotransformers could experience an overload.
Page 36 of 62You can also read


