Tourism in Iceland February 2016 - Íslandsbanki
←
→
Page content transcription
If your browser does not render page correctly, please read the page content below
Tourism in Iceland   1

February 2016

Tourism
in Iceland
Publisher:
Íslandsbanki Research, greining@islandsbanki.is
Ásta Björk Sigurðardóttir 440 4636, Elvar Orri Hreinsson 440 4747,
Ingólfur Bender 440 4635, Íris Káradóttir 440 3539,
Jóhanna Katrín Pálsdóttir 440 4609, Jón Bjarki Bentsson 440 4634,
Óðinn Valdimarsson 440 4403, Sváfnir Gíslason 440 4257

Issue date: February 29, 2016

Editor:
Ingólfur Bender, Executive Director +354 440 4635

4   Tourism in Iceland

    Foreword

    In recent years, the tourism industry has made its mark on               Tourism is now one of the cornerstones of foreign currency
    Iceland’s economy and society as a whole. After the rapid-fire           revenue generation in Iceland and, with the rapid growth of the
    growth of the past few years, it has become one of the country’s         past few years, has strengthened the economy and contributed
    most important economic sectors. This strong growth is expected          to increased long-term stability. The sector has also been the
    to continue in 2016. But with it come a number of challenges:            mainstay of job creation during the recent upswing, thereby
    to preserve the natural surroundings that are such an important          playing a large part in reducing the unemployment that was such
    part of Iceland’s appeal and to build up the infrastructure needed       a problem a few years ago.
    to maintain Iceland’s worldwide competitiveness as a travel
    destination.                                                             Tourism is closely intertwined with other sectors of the economy,
                                                                             as tourists purchase not only flights and accommodation but
    Iceland’s ratio of tourists to inhabitants is among the highest          other goods and services as well. The sector is closely linked
    in the world. The number of tourists per unit of land area is            to general trade and services in Iceland and affects domestic
    comparatively low, however. This gives rise to questions about           production and investment. The growth of the tourism industry
    the tolerance limits of the tourism sector as regards nature             is therefore rooted in broad-based cooperation across economic
    conservation and infrastructure. Analysis of these factors reveals       sectors. This is one of its main strengths, but at the same time it
    that infrastructure development has not kept pace with the               complicates statistical analysis of the scope of the sector.
    extraordinary growth in the number of tourist arrivals in Iceland.
    This discrepancy represents an opportunity to distribute tourists        Íslandsbanki has now published its Icelandic Tourism Industry
    more evenly around the country, smooth out seasonal peaks and            report for the second time. This time the report is published in
    troughs, and in so doing, better utilise existing investments. It is     both Icelandic and English, with the aim of giving domestic and
    also important to address issues relating to safety and nature           foreign readers insight into developments and prospects in the
    conservation, with particular attention to the density of visitor        sector. With this publication, Íslandsbanki wishes to contribute
    traffic at some of Iceland’s most appealing sites.                       to the provision of information about the status of the tourism
                                                                             industry. We hope the report will prove a useful and informative
                                                                             supplement to the extensive coverage the sector has so
                                                                             deservedly has received.

                                                                             Kristín Hrönn Guðmundsdóttir
                                                                             Executive Director, Commerce & Services, Corporate Banking

    Íslandsbanki and tourism
    Íslandsbanki offers comprehensive financial services to individuals,
                                                                             Figure 1. Íslandsbanki corporate loan portfolio, by sector 2015
    households, firms, and institutional investors. For years, the
    Corporate Banking Division has maintained teams that specialise
    in fisheries, energy, real estate, and municipal affairs. Íslandsbanki
    now has a tourism team and a tourism council whose members                          14%
    represent various departments within the Bank.                                                        22%
                                                                                                                           Fisheries
    In recent years, many of Iceland’s largest and strongest tourism                                                       Real estate companies
                                                                              12%
    operators have been among Íslandsbanki’s clients. The Bank                                                             Tourism
    has strengthened its position in the Icelandic tourism sector, and
                                                                                                                           Trade and services
    in the past two years 25% of its new loans have been to tourism
                                                                                                                           Industry and transport
    companies. As of year-end 2015, loans to companies engaged in               14%                             21%
    tourism accounted for 17% of the Bank’s corporate loan portfolio.                                                      Other
    At present, over 500 tourism companies are Íslandsbanki clients;
                                                                                              17%                               Source: Íslandsbanki
    thus it is clear that tourism as an economic sector is extremely
    important to the Bank. Íslandsbanki employees therefore make
    every effort to provide tourism companies with the best banking
    services in Iceland.
Tourism in Iceland   5

Table of contents

Summary									 6
Tourism: large and growing rapidly 					 10
   We forecast a 29% rise in tourist visits in 2016					                           10
   Record-breaking years – one after the other					                                10
       Seasonal peaks continue to even out					                                    11
       Americans outnumber the British				                     		                  12
       Nearly 30,000 tourists per day					                                         12
       Few tourists per square km				                          		                  13
   One of every thousand tourists worldwide comes to Iceland				                   14
       Iceland’s growing popularity among US and UK tourists		                     15
   Increased airline offerings: the key to the tourism boom				                    16
       Strong impact from foreign airlines 					                                   16
       KEF Airport: increased investment need					                                 18
   Tourism generates over a third of FX revenues					                              19
       Spending per visitor rises in 2015					                                     20
       Most spent on organised tours; car rentals growing rapidly		                21
   Rapid job creation in tourism						                                             22
   Advertising value of the internet and social media				                          22
   In 18th place among the world’s most competitive tourist destinations			        23
Substantial investment in tourism						 24
   Increased impact of foreign tourists on accommodation services			       24
       Non-hotel accommodation growing rapidly; a third of overnight stays
       in “unlisted” accommodation						 25
   Regional Iceland gains ground						 26
   Seasonality still a problem in regional Iceland        			                      26
   Less seasonal volatility and higher occupancy rates closer to the capital		     27
   The capital area hotel market						                                             29
      Seasonal peaks in occupancy continue to even out        			                  29
      Are there enough hotels in the capital area?				                             30
      Pressure for new hotels likely to increase					                              31
      Where is the capital area hotel market headed in coming years?		             32
      The historical relationship between average price and occupancy		            34
      International comparison						                                               34
   Accommodation through the sharing economy growing rapidly			                    38
      Accommodation listings on Airbnb up 126% in less than a year		               38
      Bed-nights sold through Airbnb about 20% of sold hotel bed-nights            38
      33% of peak season bed-nights sold via Airbnb			                             39
      Total Airbnb revenues about 15% of hotel revenues			                         40
      Average length of stay via Airbnb 3.3 nights				                             40
   The car rental market							                                                    41
      Active car rental agencies on the rise					                                  41
      The rental car fleet						                                                   43
      Investment, turnover, and labour force				                                   47
      Prospects are good       						                                              48
Shocks to the tourism industry                					                                49
   Tourism sensitive to the business cycle					                                    49
   Currency exchange rates: a major determinant of travel patterns			              50
   Natural disasters: both a blessing and a curse					                             52
Figures and tables 					                                                         53-55
6   Tourism in Iceland

    Summary

    •    Íslandsbanki Research forecasts a 29% increase in the                 •   We expect tourism to generate nearly ISK 428bn in export
         number of tourists visiting Iceland in 2016. In comparison, the           revenues and to account for around 34% of total export
         World Tourism Organization forecasts a 4% increase in tourist             revenues in 2016, as opposed to 18% in 2010.
         numbers worldwide. If our forecast materialises, over 1.6
         million tourists will travel to Iceland via Keflavík Airport during   •   Foreign travellers’ total payment card turnover in Iceland
         the year.                                                                 amounted to ISK 154.4bn in 2015, an average of just under
                                                                                   ISK 13bn per month, an increase of ISK 40.4bn during the
    •    If our forecast is borne out, tourists will outnumber the                 year, or 35.4%. Card turnover per tourist had been contracting
         population of Iceland by a ratio of nearly five to one in 2016.           ever since 2010, but in 2015 it turned around, growing from
         After accounting for the average length of stay, this means that          ISK 117,700 in 2014 to ISK 122,400 in 2015.
         there will be nearly 30,000 tourists in Iceland each day of the
         year. The ratio of tourists to inhabitants is one of the highest in   •   More than one in three jobs created in the Icelandic economy
         the world.                                                                during the period 2010-2015 is attributable to the tourism
                                                                                   industry. This does not include the jobs created in other
    •    In spite of the high ratio of tourists to inhabitants, the                tourism-related sectors: car rental, retail trade, entertainment,
         number of tourists relative to geographic area is rather low in           culture, recreation, and other services. It can be estimated that
         international context. According to our forecast, the number              more than one in ten employed persons in Iceland work in
         of tourists visiting Iceland in 2016 will be about 16 per square          tourism and related sectors.
         kilometre. This is below the OECD average of 18 and well
         below the EU average of 103.                                          •   According to the World Economic Forum, Iceland ranks 18th in
                                                                                   a field of 141 countries in terms of the world’s most competitive
    •    International tourists worldwide totalled 1,184 million in 2015,          tourism destinations. Its strengths include its human capital,
         and about 0.1% of them visited Iceland, or one out of every               the openness of the country and connectedness to airline
         thousand. In international context, Iceland’s tourism sector              routes, and its tourism infrastructure. Other advantages are
         is not large, and there are certainly opportunities for further           its safety and cleanliness. Factors that somewhat cut into the
         growth in spite of the recent increase in historical terms.               competitiveness of Icelandic tourism include a shortage of
                                                                                   cultural activities and high prices.
    •    Seasonal fluctuations in tourist visits have diminished. The
         share of tourists visiting Iceland in June, July, and August          •   Although foreign tourists have long been important for the
         peaked at just under 50% in 2010. Since then, it has fallen               Icelandic hotel and guesthouse sector, their importance
         markedly and is now about 40%. The countries that have                    has soared in the recent past. During the period from 1998
         reduced this seasonality the most are the UK and Japan, as                through 2010, nearly 69% of sold bed-nights were sold to
         only 15% of Japanese tourists and 18% of British tourists                 foreign nationals and the other 31% to Icelandic nationals.
         come in June, July, and August.                                           In 2015, the percentage sold to foreign nationals was 85%,
                                                                                   an increase of 13 percentage points since 2010. Icelandic
    •    Most tourists come from the US and the UK, and a larger                   nationals therefore account for 15% at present and have
         proportion of travellers from these countries choose Iceland as           declined by half since 2010.
         a destination. Just over 1.9% of the Americans who travelled to
         Europe came to Iceland during the first 10 months of 2015, as         •   In international context, however, such a large percentage of
         opposed to 0.5% in 2010. Roughly 0.41% of British travellers              bed-nights sold to foreign nationals is uncommon. In all of the
         who went to Europe in the first 10 months of 2015 came to                 EU countries combined, for example, less than half of sold
         Iceland, up from 0.14% in 2010. Iceland has therefore lured               bed-nights (46%) are sold to foreign nationals.
         market share away from other destinations among British and
         American tourists over this period.                                   •   A total of 6.67 million bed-nights were sold nationwide in
                                                                                   Iceland in 2015, an increase of 21.5% from the previous year.
    •    About 90% of all tourists who come to Iceland arrive and depart           In the first 10 months of 2015, the number of bed-nights
         via Keflavík Airport. As a result, the airport and the available          sold was up 21% year-on-year and, according to data from
         flights to Iceland are a major contributor to the upswing in              Eurostat, Iceland was the only country to see an increase of
         Icelandic tourism. According to information from Isavia, seven            more than 20%. For example, growth in sold bed-nights in all
         airlines offered scheduled flights to Iceland in 2009, while 25           EU countries combined measured 3% over the same period.
         airlines plan scheduled flights to Keflavík Airport at some point
         in 2016.
Tourism in Iceland   7

•   We estimate that listed bed-nights constitute about 68%              •   It is estimated that through 2019, a total of 2,450 new hotel
    of total overnight stays by foreign nationals in 2015, with              rooms will be built, at a total investment of over ISK 55bn.
    the remaining 32% classified as unlisted bed-nights. Such                Hotel-related investment in 2016 is estimated at ISK 20.2bn,
    unlisted bed-nights could be due to accommodations through               or 7.5% of projected business investment for the year.
    the sharing economy, including stays in privately owned
    housing, stays with friends or relatives, and so on.                 •   In 2015, the average price for hotel accommodation in
                                                                             Reykjavík (EUR 119) was higher than in Copenhagen
•   The increased weight of foreign nationals in overnight                   (EUR 112) and Oslo (EUR 107) but similar to that in Stockholm
    accommodation is driven by regional Iceland. Examining the               (EUR 120). This is because the average price per room has
    greater Reykjavík area reveals that the share of bed-nights              risen much more in Reykjavík than in the other cities since
    sold to foreign nationals has remained relatively stable at              2011, or by 49%.
    around 89% since 2010. There has been substantial growth
    in guest accommodation sold to foreigners in West Iceland,           •   In addition, among Nordic capitals, revenue per available room
    Northwest Iceland, and the West Fjords, however, with the                (RevPAR) has risen most in Reykjavík since 2011, or 83%.
    percentage of bed-nights sold to foreigners rising by 30, 24,            RevPAR in Reykjavík has risen from the lowest in the Nordic
    and 19 percentage points, respectively, since 2010.                      region in 2011 to the highest. RevPAR is the metric that is
                                                                             most used to estimate the profitability of hotel operations.
•   Of the 6.67 million bed-nights sold nationwide in 2015, 2.82
    million, or 42%, were in the capital area. In regional Iceland,      •   As of end-November 2015, a total of 2,681 properties in
    there were 3.85 million bed-nights sold, or 58% of the                   Reykjavík were listed on Airbnb, as opposed to 1,188 in
    nationwide total.                                                        December 2014, an increase of 126% in less than a year.

•   In 2015, hotels accounted for 2.96 million sold bed-nights,          •   We estimate that, over the twelve-month period beginning in
    an increase of nearly 650,000, or 28.1%, year-on-year. Bed-              November 2014, roughly 358,000 bed-nights in the greater
    nights sold to Icelanders declined by just over 6,500 in 2015,           Reykjavík area have been sold through Airbnb. In comparison,
    while sales to foreign nationals increased by 655,000. It is             1,782,000 hotel bed-nights were sold in the capital area over
    clear, then, that foreign tourists account entirely for the growth       the same period. Bed-nights sold through Airbnb therefore
    in the hotel market in 2015.                                             equal about 20% of hotel bed-nights sold in greater Reykjavík.

•   The number of available hotel rooms has never grown as               •   Most bed-nights sold through Airbnb were sold in August,
    strongly in a single year as it did in 2015. According to                or 63,200. In comparison, 189,000 bed-nights were sold in
    Statistics Iceland, 872 new rooms were added during the                  capital area hotels in August 2015; therefore, the number of
    year, most of them due to the opening of Foss Hotel Reykjavík,           bed-nights sold via Airbnb was about a third of the number
    the Kea hotels, Hótel Skuggi, and Hótel Storm. The number of             sold in hotels during the same month.
    rooms available in the greater Reykjavík area rose by 26.3%          •   In October 2015, the number of bed-nights sold via Airbnb
    in 2015, the largest increase ever recorded. In spite of this            was up by about 22,000 year-on-year. The increase measured
    extraordinary historical growth in hotel rooms, the number of            225% and the number of sold bed-nights in October 2015
    tourists grew proportionally more in 2015, or by 30.2%, and              was more than three times greater. Over the same period,
    the hotel room occupancy rate rose from 77.6% to 78.8% as a              the increase in hotel bed-nights in the greater Reykjavík area
    result.                                                                  measured 29%. These figures highlight the explosion that has
•   Among capital cities in the Nordic region, the proportional              taken place in the sharing economy.
    increase in hotel room offerings was greatest in Reykjavík in        •   During the twelve-month period beginning in November 2014,
    2015.                                                                    total revenues deriving from Airbnb-listed accommodation
•   In 2016, an estimated 290 new hotel rooms will be available,             in Reykjavík amounted to ISK 2.22bn. Capital area hotels’
    an increase of 5.8% in the total supply. As a result, it is likely       revenues over the same period totalled ISK 14.5bn. Revenues
    that for yet another year, the increase in supply will not keep          generated via Airbnb over those twelve months therefore
    pace with demand. We estimate that more than 1,400                       totalled just over 15% of hotel revenues for the same period.
    additional hotel rooms are needed to meet this rise in tourist       •   Over the four months beginning in June 2015, revenues from
    numbers and maintain the same occupancy rate. Therefore,                 Airbnb listings totalled ISK 1.35bn, or 61% of total revenues
    two things will happen: the occupancy rate will rise in 2016,            for a twelve-month period. In comparison, capital area hotels’
    and a larger percentage of tourists will seek out non-hotel              revenues for the four months from June 2015 onwards
    accommodation.                                                           amounted to 51% of total revenues for a twelve-month period.
                                                                             Therefore, seasonality is more of a factor in the Airbnb market
                                                                             than in the hotel market.
8   Tourism in Iceland

    •    The average length of stay among Airbnb guests in Reykjavík is       •   The car rental fleet has grown faster than the general private
         3.3 nights, and stays are longer over the colder months of the           vehicle fleet in Iceland. Rental vehicles accounted for 2.4% of
         year. This accords with the results of the survey conducted by           the total fleet in Iceland in 2006 and 6.8% in 2015. If forecasts
         the Icelandic Tourist Board among foreign visitors to Iceland,           materialise, this proportion will rise to as much as 8% in 2016.
         which indicate that 40.4% of tourists stay 3-4 nights in the
         greater Reykjavík area.                                              •   In 2015, the 20 largest rental agencies owned some 85% of
                                                                                  the total rental car fleet, about the same as in 2014. Most
    •    The rental car fleet grew by a full 26% between 2014 and                 agencies appear to have expanded their fleet to accommodate
         2015, while the number of tourists visiting the country                  the growth in the market as a whole.
         increased 30%. There had been a pent-up need to expand the
         fleet, as it had grown by only 7% between 2013 and 2014,             •   The car rental fleet is relatively young: 87% of vehicles are five
         while the number of tourists grew by 24%.                                years old or younger, and 64% are only a year or two old. In
                                                                                  comparison, only an estimated 13-15% of the country’s total
    •    Between 2003 and 2014, the number of operating permits                   fleet of private vehicles are five years old or younger.
         for car rental agencies trebled, from 51 to 151. In 2015
         growth was virtually flat, with only one new agency obtaining        •   Over the period from 2010 through 2014, rental cars have
         a licence. It appears that this was due to thinning in the sector;       accounted for about 42% of all new cars sold in Iceland. They
         i.e., inactive licence holders left the market and new ones              accounted for 43% in 2015, when some 6,600 of the 15,300
         came in to take their place.                                             private cars sold were to rental agencies. This ratio is expected
                                                                                  to remain broadly unchanged in 2016, with rental vehicles
    •    The number of tourists visiting Iceland is expected to grow by           accounting for 7,500 of 17,500 cars sold.
         29% in 2016, and it is clear that the number of active car rental
         agencies will rise during the year.                                  •   Turnover among car rental agencies has grown rapidly, in line
                                                                                  with increased activity in the sector. In 2008, the sector’s total
    •    From 2006 to 2014, the number of rental vehicles rose                    turnover was ISK 7.5bn, whereas in 2015 it had grown to ISK
         from 4,756 to 12,179. For 2015 the fleet size was forecast               33bn. It is estimated that as many as 900 people are directly
         at 14,000, but the actual number was 15,401. Expansion is                employed in the car rental sector.
         expected to continue, with the fleet size projected to peak in
         2016 at 18,500, a 20% increase year-on-year.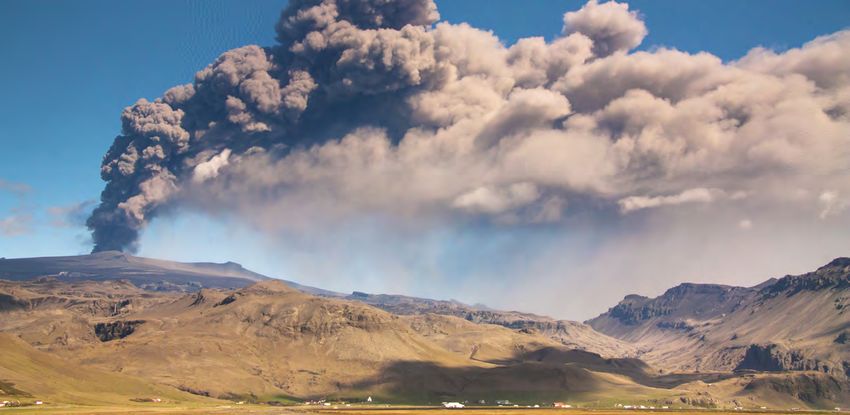
Tourism in Iceland   9

•   The average price of new rental cars was about ISK 3m in            •   The global economic recession in 2008 is a recent example
    2015; therefore, the sector’s direct investment in motor                showing clearly how a worldwide economic downturn can
    vehicles totalled about ISK 19.5bn exclusive of VAT during the          affect tourist numbers and the tourism industry in general.
    year. Based on projected car sales in 2016, it can be assumed           For instance, global GDP growth was flat in 2009, and there
    that the rental sector’s direct investment in vehicles will total       was a 4.0% contraction in the number of tourists at the same
    ISK 22.5 this year. This figure does not include a vast number          time. In Iceland, there was weak growth in tourist numbers in
    of other related purchases, such as tyres, spare parts, petrol,         2008, followed by a contraction in both 2009 and 2010. The
    and investment in housing.                                              contraction came on the heels of relatively swift growth in the
                                                                            number of travellers to Iceland during the pre-2008 upswing,
•   The increased importance of tourism in the Icelandic economy            much of it due to business travel.
    has diversified both the country’s foreign exchange revenues
    and the general economy. This should enhance economic               •   The real exchange rate of the ISK has risen considerably
    stability in the long run. On the other hand, increased activity        during the recent tourism boom. This has eroded the Icelandic
    in the tourism industry has made the Icelandic economy                  tourism industry’s competitive position in terms of prices.
    more vulnerable to shocks to the sector. Such shocks could              Research shows that changes in the real exchange rate of a
    take many forms, including natural disasters and economic               tourist’s home country often have as much impact as changes
    downturns or crises.                                                    in the real exchange rate of the destination country. This can
                                                                            be seen, for instance, in the surge in the number of Icelanders
•   Natural disasters can be a double-edged sword for the tourism           travelling abroad during the recent rise in the real exchange
    sector, as was the case with the Eyjafjallajökull eruption early        rate of the ISK. Furthermore, growth in tourist visits to Iceland
    in 2010. The eruption caused a contraction in tourism at                has been greatest among people from economies with a rising
    first but then helped to trigger the surge that has occurred            real exchange rate, especially the US and the UK. Tourists from
    since. Because of Iceland’s geographical location, its tourism          the eurozone have increased in number as well, but to a much
    industry depends largely on air traffic. About 90% of tourists          lesser degree.
    who visited Iceland in 2015 came by air. As a result, Iceland’s
    tourism sector is more vulnerable to interruptions in air traffic
    than that in many other economies where tourism is based on
    a range of transportation options. Iceland’s status as an active
    volcanic island therefore represents a certain risk for tourism.
10   Tourism in Iceland

     Tourism: large
     and growing rapidly
     Yet another record year is underway for Icelandic tourism. We                 worldwide. If our forecast materialises, over 1.6 million tourists
     expect the sector to break records in foreign exchange revenue                will travel to Iceland via Keflavík Airport (KEF) during the year. The
     generation, size relative to the economy, and number of tourists              forecast is based on currently available figures on the number of
     visiting Iceland, to name just a few categories. The burgeoning of            foreign tourists plus information from Isavia concerning expected
     tourism has strongly affected the Icelandic economy, playing an               air traffic over the coming year, which indicates a strong increase
     important role in the upswing of the past few years and making its            in air traffic through KEF. The expected increase in available flights
     mark on Icelandic society as a whole. The scope of the sector is              in 2016 is much larger than the actual increase in 2015. On the
     obvious to all, as the ratio of tourists to inhabitants is one of the         other hand, Isavia projects a rise in the ratio of through passengers
     highest in the world at present and appears set to rise even higher.          to total passengers landing at KEF in 2016; i.e., a smaller
     Iceland has a strong competitive position as a tourist destination,           percentage of total passengers will actually enter the country.
     but the challenge is to follow up on its popularity with infrastructure
     development, including hotels and recreational facilities, and to             Record-breaking years – one after the other
     make better use of existing investments. The steep increase in
     flights to Iceland has made the growth of the sector possible, and            According to figures from the Icelandic Tourist Board, 1,262,000
     the outlook is for a significant rise in flight offerings this year. In our   tourists departed from Iceland via KEF in 2015, a year-on-year
     opinion, tourism will grow even stronger in 2016, both as one of the          increase of just over 30%. This does not include travellers arriving
     pillars of the Icelandic economy and as the country’s largest source          with cruise ships and the Norræna ferry, nor does it include those
     of foreign currency.                                                          travelling to other harbours or airports. According to the World
                                                                                   Tourism Organization, global tourism grew by about 4.4% in 2015
                                                                                   and by an average of 3.5% per year over the period from 2005-2014.
     We forecast a 29% rise
                                                                                   Since 2010, however, annual growth in tourist visits to Iceland has
     in tourist visits in 2016                                                     averaged 22.4%, dwarfing worldwide growth rates.
     Íslandsbanki Research forecasts a 29% increase in the number
     of tourists visiting Iceland in 2016. In comparison, the World
     Tourism Organization forecast a 4% increase in tourist numbers

      Figure 2. Number of visitors travelling through KEF (thousands)

                                                                                                                                                        29%
        1,800

        1,600
                                                                                                                                          30.2%
        1,400

        1,200                                                                                                                 24%
        1,000                                                                                                      21%
                                                                                                        20%
         800                                                                                  18%
                                                    15%         3%        -2%       -1%
         600                             10%
                     13%       4%
         400

         200

            0
                    2004      2005      2006       2007       2008       2009      2010      2011      2012       2013       2014         2015         2016F

                                                                                                                     Source: Icelandic Tourist Board, ÍSB Research
Tourism in Iceland 11
Figure 3. Number of tourists travelling through KEF, by month (thousands)
200 16%
17%
150 20%
25%
24%
100 26% 31%
26%
28% 25% 30%
27%
50
0
Jan Feb Mar Apr May Jun Jul Aug Sep Oct Nov Dec
2003 2010 2011 2012 2013 2014 2015
Source: Icelandic Tourist Board
Seasonal peaks continue to even out
Figure 4. Number of tourists, by season (thousands)
Iceland’s tourism industry has been characterised by seasonal
peaks and troughs, with most tourists arriving in June, July, and 55%
800
August. The share of tourists visiting during these three months 50%
700
peaked at just under 50% in 2010. Since then, it has fallen
600 45%
markedly and is now about 40.2%. Since 2010, the increase in
500 40%
tourist numbers has been proportionally strongest in November
400 35%
and December, with year-on-year growth exceeding 30% during
300
these two months. Over the same period, year-on-year growth has 30%
200
been weakest over the summer months, at 16-20%. Stakeholders 25%
in the tourism industry have therefore been highly successful in 100
20%
marketing Iceland as a year-round destination. A number of 0
2005
2006
2007
2008
2009
2010
2011
2012
2013
2014
2015
2003
2004
scheduled events and favourable off-peak airfares have also
fostered this development, which has solidified the operational
Jun-Aug Other months
foundations for businesses in tourism-related fields. Íslandsbanki
Share of tourists in Jun-Aug (r. axis)
Research forecasts that this trend will continue in 2016, with
seasonality diminishing still further. Source: Icelandic Tourist Board
The countries that have supported this trend the most are the UK
and Japan. Travellers from these two countries stand out in that Figure 5. Share of tourists in each month, by nationality 2015
most of them visit Iceland outside the peak season. As is stated
above, over 40% of all tourists visit in June, July, and August, 18%
whereas only 15% of Japanese and 18% of British tourists come 16%
during those months. This smoothing of seasonal fluctuations is 14%
very important to the sector, and increased visits from these two 12%
countries have supported that trend. 10%
8%
6%
4%
2%
0%
Jan Feb Mar Apr May Jun Jul Aug Sep Oct Nov Dec
UK Japan All countries
Source: Icelandic Tourist Board12 Tourism in Iceland
Americans outnumber the British
Over the thirteen years that the Icelandic Tourist Board has
measured tourist numbers by nationality, visitors from the UK have Figure 6. Number of UK and US tourists (thousands)
been the largest group eleven times. In the other two instances,
Americans have been the leaders: in 2011 and again in 2015. This 459 484
is due to a surge in visitors from the US, who grew in number by
90,700, or nearly 60% year-on-year. The number of travellers from
the US and UK has soared since 2010. For example, the number of
British and American visitors to Iceland in 2015 alone exceeds the
total number of tourists from all countries in 2010 by a full 25,000.
The total number of tourists has risen by more than 800,000 since
2010, and the US and UK account for 372,000 of them, or nearly Total number of tourists 2010 British and American tourists 2015
half. The catch-all category “Other” was the third-largest group,
according to Icelandic Tourist Board data. The Icelandic Tourist Source: Icelandic Tourist Board
Board database does not contain more detailed information on
that group; therefore, it is uncertain what countries are represented
there. As a result, analysis of the increased diversity among visitors approach 5:1 in 2016. After accounting for the average length of
to Iceland is limited in this respect. Greater diversification of stay, this means that there will be nearly 30,000 tourists in Iceland
nationalities is a positive development in tourism. Broadening the each day of the year. As a result, they account for 8.3% of the
base of tourists in this way better prepares the sector to withstand combined total population of year-round residents plus tourists.
shocks such as terrorist attacks or economic downturns that This ratio has often been used as an indicator of the size of the
could strike specific countries or regions. Such shocks can have tourism sector in various countries. By this criterion, Iceland ranks
an enormous impact on tourism, as is discussed more fully in the seventh, between Monaco and Malta. The countries above Iceland
section “Shocks in tourism”. on the list are small ones, including the Vatican (#1), Andorra
(2), and the Bahamas (5). No large countries have a tourist-to-
Nearly 30,000 tourists per day inhabitant ratio as high as Iceland’s. For example, in Spain, the
ratio is 2.2%; in France, 2.0%; and in Italy, 1.3%. Smaller countries
Tourists outnumbered inhabitants by nearly 4:1 in 2015, and if have somewhat higher ratios, however: Estonia, 4.0%; Austria,
our forecast is borne out, the ratio of tourists to inhabitants will 3.8%; Ireland, 3.7%, and Denmark, 2.5%. It should be noted that
Figure 7. Number of tourists, by country (thousands)
300 56% 60%
250 50%
200 37% 40%
32%
150 28% 30%
23% 24% 23%
19% 20%
100 18% 17% 20%
15%
14%
11%
50 8% 9% 8% 10%
5%
0 0%
Finland
Netherlands
Poland
Japan
Russia
US
Germany
France
Canada
China
Sweden
Spain
Switzerland
Italy
UK
Other
Norway
Denmark
2010 2015 Annual growth since 2010, selected countries (r. axis) Total annual growth since 2010 (r. axis)
Source: Icelandic Tourist BoardTourism in Iceland 13
Figure 8. Ratio of tourists to total inhabitants, yearly average
84%
30%
20%
18%
16%
14%
12%
10%
8%
6%
4%
2%
0%
Vatican City
Andorra
Palau
Bahrain
Bahamas
Monaco
Iceland
Malta
San Marino
Maldives
Antigua & Barbuda
Seychelles
Singapore
Cyprus
Barbados
St. Kitts & Nevis
Estonia
Austria
Croatia
St. Lucia
Denmark
Montenegro
Luxembourg
Qatar
Spain
France
Netherlands
Canada
Italy
UK
Saudi Arabia
Australia
Taiwan
Turkey
Thailand
Poland
US
Germany
South Korea
Mexico
South Korea
Russia
Argentina
Japan
Iran
Indonesia
China
Brazil
India
Source: World Bank, ÍSB Research
because these are average year-round figures, the ratio is much in 2016 will be about 16.2 per square kilometre. This is slightly
higher during the summer. Therefore, we estimate that tourists below the OECD average of 17.6 and far below the EU average of
will account for over 18% of all inhabitants in Iceland this summer. 102.6. It is worth noting that the countriesranking on either side of
because these are average year-round figures, the ratio is much Iceland in terms of the tourist-to-inhabitant ratio – i.e., Monaco and
higher during the summer. Therefore, we estimate that tourists Malta – have a much higher tourist-to-land area ratio than Iceland
will account for over 18% of all inhabitants in Iceland this summer. does. Monaco’s is 164,000 per square kilometre and Malta’s
4,943. Therefore, Iceland’s vast wilderness areas are still far from
Few tourists per square km being as overstuffed with tourists as are most other countries with
equally large tourism sectors. It can be said, then, that there is still
Even though the number of tourists in Iceland is large relative to considerable scope for growth in Icelandic tourism, although some
the population and the ratio described above is high, the country is sites within the country may be approaching the saturation point in
large and therefore not overfilled with tourists relative to land area. terms of tourist traffic.
Actually, the number of tourists per unit of land area is rather small.
According to our forecast, the number of tourists visiting Iceland
Figure 9. Number of tourists per km2
164.0
16.9
11.9
5.4
4.9
4.9
3.37
4.7
1.6
1.4
1.2
(thousands)
600
500
400
300
200
100
0
Monaco
Singapore
Bahrain
Aruba
Andorra
Malta
Bermuda
Maldives
American Samoa
Cayman Islands
Barbados
Sicily
Netherlands
Luxembourg
Austria
Cyprus
Belgium
Switzerland
Qatar
Denmark
Croatia
Italy
France
Greece
Israel
UK
Korea
Lebanon
EU
Spain
Ireland
Hungary
Czech Republic
Slovenia
Albania
European Union
Montenegro
Germany
Portugal
Malaysia
Georgia
Estonia
Bulgaria
Thailand
Poland
Turkey
Costa Rica
Ukraine
Tunisia
Romania
Lithuania
Japan
Cuba
Latvia
Vietnam
OECD countries
Iceland
Macedonia
Philippines
Uruguay
Belize
Sweden
Mexico
Serbia
New Zealand
Egypt
All countries
Source: World Bank, ÍSB Research14 Tourism in Iceland
One of every thousand tourists
worldwide comes to Iceland
According to the World Tourism Organization, there were 1,184
Figure 10. Number of tourists, by destination
million tourists worldwide in 2015, an increase of 4.4% year-on-
year. Only 0.1% of those tourists – or one in a thousand – visited 100
Iceland. 90
80
Figure 11 shows the most popular travel destinations in 2013, 70
60
together with other selected destinations. The figure highlights 50
how few travellers come to Iceland relative to the global total. In 40
terms of the number visitors, Iceland as a destination ranks 110th 30
20
among the countries for whom information could be obtained 10
from the World Bank, yet it ranks 176th in terms of population. It 0
Russian
Federation
Iceland 2015
China
France
US
Spain
Turkey
Germany
UK
Danmörk
Thailand
Sweden
New Zealand
Iceland 2013
Italy
should be borne in mind that at present there are 196 independent
countries in the world. When population is factored in, however,
the picture changes radically, as can be seen in Figure XX. Tourists
outnumbered the population of Iceland by 2.4:1 in 2013 and, if our
forecast materialises, they will outnumber inhabitants by nearly Source: World Bank, Icelandic Tourist Board, Statistics Iceland
5:1 in 2016. Iceland is therefore at the top of the list in comparison
with these same countries and in Figure 10, after accounting for
population. Figure 11. Number of tourists per inhabitant
visitors, Iceland as a destination ranks 110th among the countries 6,0
for whom information could be obtained from the World Bank, yet it 5,0
ranks 176th in terms of population. It should be borne in mind that
4,0
at present there are 196 independent countries in the world. When
population is factored in, however, the picture changes radically, as 3,0
can be seen in Figure XX. Tourists outnumbered the population of 2,0
Iceland by 2.4:1 in 2013 and, if our forecast materialises, they will 1,0
outnumber inhabitants by nearly 5:1 in 2016. Iceland is therefore at
0
the top of the list in comparison with these same countries and in
Thailand
Russian
Federation
Iceland 2015
France
Italy
New Zealand
Sweden
Turkey
UK
US
China
Iceland 2013
Danmörk
Spain
Germany
Figure XX, after accounting for population.
Source: World Bank, Icelandic Tourist Board, Statistics IcelandTourism in Iceland 15
Figure 12. US tourists arriving in Iceland as a share of US citizens travelling abroad
2.0%
1.5%
1.0%
0.5%
0%
2003 2004 2005 2006 2007 2008 2009 2010 2011 2012 2013 2014 2015
US tourists in Iceland as a share of US travelling abroad US tourists in Iceland as a share of US travelling to Europe
Source: Icelandic Tourist Board, US Tourist Board
Iceland’s growing popularity among US and UK tourists
In this context, examining the two countries that produce the It is noteworthy that of those who travel to Europe, the percentage
most visitors to Iceland – the US and the UK – reveals that, among of Americans who visit Iceland is considerably larger than the
overseas travellers, the percentage who visit Iceland has grown by percentage of British nationals.
leaps and bounds. Of Americans who travelled abroad in the first
10 months of 2015, 0.8% came to Iceland, as opposed to 0.2% Just over 1.9% of Americans who travelled to Europe came to
in 2010. Of the Americans who travelled to Europe, just over 1.9% Iceland, as opposed to only 0.4% of Europe-bound travellers from
came to Iceland during the first 10 months of 2015, up from 0.5% in the UK. If American and British nationals travelled equally much,
2010. The share has therefore increased by 1.5 percentage points the number of American travellers should be much larger, as the
over this five-year period. population of the US is nearly five times that of the UK. But this is
not the case, as American tourists outnumbered British tourists to
Of British nationals who travelled abroad in the first 10 months of Iceland by only 1,800 in 2015. The reason for this is that British
2015, 0.33% came to Iceland, up from 0.11% in 2010. Of British people travel much more than Americans do. In 2014, British
travellers who went to Europe in the first 10 months of 2015, nationals travelled abroad 60 million times, the equivalent of at
roughly 0.41% came to Iceland, as compared with 0.14% in 2010. least one trip per person for 90% of the total population. On the
other hand, Americans travelled abroad 30.8 million times, which
is the equivalent of at least one trip per person for 10% of the total
population.
Figure 13. UK tourists arriving in Iceland as a share of UK citizens travelling abroad
0.5%
0.4%
0.3%
0.2%
0.1%
0%
2003 2004 2005 2006 2007 2008 2009 2010 2011 2012 2013 2014 2015
UK tourists in Iceland as a share of UK travelling abroad UK tourists in Iceland as a share of UK travelling to Europe
Source: Icelandic Tourist Board, British Office for National Statistics (ONS)16 Tourism in Iceland
Increased airline offerings:
the key to the tourism boom
About 90% of all tourists who come to Iceland arrive and depart
Figure 14. Number of airlines with scheduled flights via KEF
via Keflavík Airport. As a result, the airport and the available flights
to Iceland are a major determinant of the upswing in Icelandic
tourism. Increased offerings and the more favourable airfares that
have resulted from increased competition in flights to Iceland have
made it easier for foreign tourists to visit the country. 25
According to information from Isavia, seven airlines offered 20
18
scheduled flights to Iceland in 2009, whereas 25 airlines plan 16
15
scheduled flights to Keflavík Airport at some point in 2016. In
addition to this are the regular chartered flights on behalf of 11 11 11
Icelandic and foreign travel agencies and flights via other domestic 7
airports in Akureyri, Egilsstaðir, and Reykjavík.
The frequency of flights to Iceland via KEF grew by 17% per year from
2010 through 2015. Over the same period, the number of tourists 2008 2009 2010 2011 2012 2013 2014 2015 2016
visiting the country grew by over 22% per year. This indicates that Source: Isavia
larger planes are coming to Iceland and that seat utilisation rates
are rising. This assumption is supported by figures from Icelandair
and IATA. As Figure 15 shows, Icelandair’s seat utilisation rate has Figure 15. Seat utilisation
risen considerably since 2010. European and other international
airlines have also seen utilisation rates rise over this period. 84%
Strong impact from foreign airlines 82%
Foreign airlines’ decision to begin offering flights to Iceland
80%
has made a strong impact on tourism. In 2012, EasyJet began
scheduled flights to Iceland 10 months of the year. That year the
78%
number of British visitors rose by 27,000, or 40%, whereas the
increase in the previous year was just over 7,000, or 12%. In 2013,
EasyJet began flying to Iceland year-round, and the frequency of 76%
flights from the UK to KEF rose by 67% that year. At the same time, 2010 2011 2012 2013 2014 2015
the number of British visitors rose by 42,500, or about 45%. This Icelandair IATA Europe IATA international traffic
is the largest increase in British tourists in the history of Icelandic
Source: Icelandair, IATA
Tourist Board figures, and the increase in air traffic between the UK
and Iceland is also the largest since the onset of the tourism boom
in 2010. major factor in the increased number of American tourists visiting
Iceland. In 2015, the number of Americans visiting Iceland grew by
This pattern can also be seen among German and American
nearly 60%. As a result of this surge in the number of Americans
tourists. In 2011, Delta Airlines began scheduled flights to Iceland
travelling to Iceland, most tourists in Iceland now come from the US.
four months of the year: June, July, August, and September. The
number of American visitors to the country grew by more than 60% In 2015, Air Berlin lengthened its schedule of flights to Iceland to
year-on-year over these four months, and growth for the year as a nine months of the year, as opposed to five in 2014. Over the four
whole measured almost 52%. In 2012 through 2014, US airlines additional months, 25% more German tourists came to Iceland
increased the frequency of flights to Iceland, flying to KEF 51% more than in those same months in 2014, and over the year as a whole,
often in 2014 than in 2012. The number of Americans visiting the the number of visits by German tourists rose by more than 20%.
country grew by 60% over the same period. In 2015, Delta Airlines Flight offerings from Germany to KEF have increased by 17% per
added the month of March to its flight roster, and US airlines’ total year since 2010 and the number of German tourists by 14%.
flight offerings to KEF grew by 49%. The increase in US-bound
flights by domestic airlines WOW and Icelandair has also been aTourism in Iceland 17
Figure 16. Flights to KEF, by country
3.500
3.000
2.500
2.000
1.500
1.000
500
0
Russia
Finland
Netherlands
Poland
US
Germany
France
Canada
Sweden
Spain
Switzerland
Italy
UK
Denmark
Norway
Other
2010 2011 2012 2013 2014 2015
Source: Isavia
Figure 16 shows flight offerings to KEF, classified by country. The increased flight availability and increased tourist numbers. Seat
US, the UK, and Germany are at the top of the list in terms of total utilisation and aircraft size, together with the nationality composition
offerings, and most tourists come from these countries. Figure 17 of passengers on each flight, affect this relationship and cause
shows annual growth in flight offerings and number of visitors in deviations in some instances. For example, this is why the increase
the eight countries that produce the most travellers to Iceland. As in visitors from the US and the UK exceeds the increase in flight
the figure illustrates clearly, there is a strong connection between availability from those countries.
Figure 17. Increase in flights and number of tourists since 2010, by country
60%
50%
40%
30%
20%
10%
0%
Russia
Finland
Netherlands
Poland
US
Germany
France
Canada
Sweden
Spain
Switzerland
Italy
UK
Denmark
Norway
Other
Annual increase in flight offerings Annual increase in number
Source: Isavia, Icelandic Tourist Board18 Tourism in Iceland
KEF Airport: increased investment need
The exponential growth in Iceland’s tourism sector has increased Figure 18 shows the largest airports in the world, by number of
the need to invest in KEF Airport, and substantial investment is passengers, together with KEF. The figure illustrates clearly how
indeed planned for the coming term. Isavia projects that by 2040, small KEF is in this context. Nevertheless, Keflavík stands out in
nearly 14 million passengers could travel through KEF, which that the increase in the number of passengers travelling through
translates to an annual increase of 4.3% for the next 25 years. In KEF far exceeds the increase at the largest airports.
comparison, the airport welcomed nearly 5 million passengers
in 2015, an increase of just over 25% year-on-year. Isavia’s
projections therefore assume a much more modest growth rate
than has been seen recently.
Figure 18. Number of passengers, by airport (millions)
120 30%
100 25%
80 20%
60 15%
40 10%
20 5%
0 0%
Atlanta (ATL)
Beijing (PEK)
Tokyo (HND)
Dubai (DXB)
Chicago (ORD)
Los Angeles (LAX)
Hong Kong (HKG)
Paris (CDG)
Dallas (DFW)
Keflavík (KEF)
London (LHR)
Passengers % change year-on-year
Source: Isavia, Airports Council InternationalTourism in Iceland 19
Tourism generates over a third of FX revenues
In recent years, tourism has grown into one of the cornerstones
of foreign currency generation in Iceland. As has always been the Figure 19. Good and services exports, by sector (ISK bn)
case, Iceland’s main export sectors are based on natural resource
utilisation, but they are now more diverse than before. Lack of 1,254
1,191
diversity in generation of FX revenues was long a procyclical element 1,068 1,096 1,089
1,020
of the Icelandic economy. Tourism has added some of the diversity 928
27%
27%
that was lacking, which should create greater stability in the future. 33% 31% 30% 30%
17%
The growth of the tourism sector has also connected Iceland more 35% 20%
closely to economic developments in tourists’ countries of origin. 21% 20% 20%
23% 22%
In this respect, the Icelandic economy is more closely linked to 24% 22%
25% 22% 22%
25% 34%
neighbouring economies. 24% 25%
31%
25% 28%
19% 22%
Year-2015 revenues from goods and services exports are estimated 18%
at ISK 1,191bn, an increase of 9% year-on-year. Tourism generated 2010 2011 2012 2013 2014 2015 2016F
ISK 368bn in foreign-denominated revenues during the year, or 31% Tourism Seafood Aluminum Other
of the total from all goods and services exports. We estimate that
total export revenues will grow by just over 5% this year, to about ISK Source: Statistics Iceland, Central Bank of Iceland, ISB Research
1,254bn. We expect tourism to generate nearly ISK 428bn and to
account for around 34% of total export revenues in 2016. Tourism
Figure 20. Good and services exports, by sector (ISK bn)
would then increase in terms of its share in total export revenues,
further strengthening its position as Iceland’s leading export sector.
Tourism’s share of Iceland’s export revenues has been growing in 450
recent years; for example, it was 18% in 2010. In view of this rapid 400
growth and the fact that tourism now generates considerably more 350
foreign currency than other sectors, it is appropriate to highlight the 300
importance of fostering the growth of other FX revenue-generating 250
sectors to ensure that diversity is maintained. Otherwise, there is 200
the risk that, with continued rapid growth in tourism, FX revenue 150
generation will grow more homogeneous, making the economy 100
more vulnerable to shocks in the tourism industry. 50
0
2010 2011 2012 2013 2014 2015 2016F
Tourism Seafood
Aluminum Other
Source: Statistics Iceland, Central Bank of Iceland, ISB Research20 Tourism in Iceland
Spending per visitor rises in 2015
Foreign travellers’ total payment card turnover in Iceland amounted Figure 21. Card turnover of tourists
to ISK 154.4bn in 2015, an average of just under ISK 13bn per
month. Foreign nationals’ card turnover grew by ISK 40.4bn in
2015, or 35.4%, as opposed to 22% in 2014 and 17% in 2013.
This strong increase in card turnover among foreign nationals has 154
strengthened the ISK, and it is clear that this effect has grown
stronger year by year. In this context, however, it is also necessary 114
to consider Icelanders’ card turnover abroad, which totalled ISK 93
34.3bn in 2015. Therefore, foreign nationals’ purchases of Icelandic 80
krónur net of Icelanders’ purchases of foreign currency (the card
turnover balance) amounted to ISK 120.1bn in 2015. By way of
comparison, it is interesting to note that in 2007, the pre-crisis peak
of private consumption, the card turnover balance was negative by
over ISK 54bn.
2012 2013 2014 2015
Examining card turnover per tourist reveals a decline beginning
in 2012, as growth in the number of tourists outpaced foreign Source: Centre for Retail Studies
card turnover from 2012 through 2014. Things changed in 2015,
however, when the number of tourists rose by 30.2% and foreign Figure 22. Card turnover balance (ISK bn)
nationals’ card turnover by 35.4%, a difference of 5.2 percentage
points. The result is therefore that card turnover per tourist rose
120
from ISK 117,700 in 2014 to ISK 122,400 in 2015, which means
that each tourist spent an average of over ISK 122,000 while in 82
Iceland. Figure 23 breaks this amount down by spending category. 62
48
2007
2012 2013 2014 2015
-54 Source: Centre for Retail Studies, Central Bank of Iceland
Figure 23. Average payment card turnover per tourist, 2015
Misc. tourism services
Culture and recreation Turnover: 25,359
»
»
Turnover: 2,881
% share: 2.4%
% share:
20.70%
Petrol, car repair » Accommodation
and maintenance
Turnover: 5,129 B » Turnover: 24,310
% share:
19.9%
% share: 4.2% »
Other
Turnover: 6,738
ISK 122,000 » Retail trade
Turnover: 18,012
% share: 5.5%
»
% share: 14.7%
»
Cash withdrawals
»
Turnover: 11,186 Car rental and
% share: 9.1% other transport
Restaurant Turnover: 15,097
Turnover: 13,654 % share: 12.3%
% share: 11.2%Tourism in Iceland 21
Most spent on organised tours;
car rentals growing rapidly
Foreign tourists’ did most of their card-based spending on It should be noted that only card turnover through Icelandic acquirers
miscellaneous tourism services in 2015. Under this category are is included here. Among the items not included are cash payments
organised tours such as whale watching, guided distance coach made by tourists who buy foreign currency before arriving in Iceland,
tours, hikes, and other such trips. This category of card turnover, package tours bought through foreign travel agencies, and services
which totalled ISK 32bn in 2015, has grown most since 2012, or purchased through other foreign booking agencies. In this context,
by 51%. The second-strongest turnover category in 2015 was of those tourists who were asked about their bookings, only 9.6%
accommodation, at ISK 30.7bn, some 99.4% of it due to hotel stays. said they booked package tours through Icelandic travel agencies.
The category that includes car rental has also grown strongly. Car It is clear, then, that payment card turnover figures underestimate
rentals now account for 99% of turnover under this item, which has total spending by foreign visitors during their stay in Iceland.
grown by about 37% per year since 2012.
Figure 24. Tourists’ card turnover, by spending category (ISK bn, at 2015 price level)
35 60%
51%
30 50%
25
37% 40%
20
25% 28% 26% 30%
25%
15
16% 20%
10 16% 13% 15%
5 10%
5%
0 0%
B
Culture and recreation
Misc. tourism services
Accommodation
Petrol, car repair and
Retail trade
Passenger transport
Misc. tourism services
Cash withdrawals
Public levies, etc.
Car rental and other
Restaurant services
transport expense
maintenance
2012 2013 2014 2015 Annual growth since 2012
Source: Icelandic Centre for Retail Studies, Icelandic Tourist Board22 Tourism in Iceland
Rapid job creation in tourism
Alongside the past few years’ exponential growth in tourist numbers
Figure 26. Rise in number of employed, 2010-2015
and tourism-generated foreign exchange revenues, the number of
jobs in the sector has grown substantially. The expansion of the
tourism sector has been responsible for much of the job creation
taking place since Iceland’s post-crisis economic recovery began in
2010. The number of jobs in the general economy rose by 16,300
between 2010 and 2015, and 5,400 of them are in tourism: air
transport, travel agencies, and hotel and restaurant services.
Therefore, more than one in three jobs created in the Icelandic
economy over this period is attributable to the tourism industry.
This does not include the jobs created in other tourism-related
sectors: car rental, retail trade, entertainment, culture, recreation,
5,400 10,900
and other services.
Persons employed in air transport,
Other
travel agencies, and hospitality
Figure 25. Tourism as a share of total number Source: Statistics Iceland
of employed persons
of employed persons. The number of people employed in tourism
9.2% 9.3%
7.4% 8.3% can be expected to rise still further this year, and the sector’s share
7.0% 7.0% 7.6%
6.0% of the total number of working persons can be expected to increase
likewise. As has been pointed out, the scope of the tourism industry
is doubtless underestimated in these figures, as they do not include
related activities. It is safe to estimate, then, that more than one of
every 10 working people in Iceland are employed in tourism and
2008 2009 2010 2011 2012 2013 2014 2015
related activities. Clearly, the tourism sector has become one of the
Source: Statistics Iceland
largest segments of the Icelandic labour market.
Advertising value of the internet and social media
In the above-mentioned segments of tourism alone – air transport,
travel agencies, and hotel and restaurant services – there were There is little doubt that the internet and social media have played an
10,800 jobs in 2008, or 6.0% of the total number of employed important role in the tourism boom of the past few years. The large
persons in the economy at the time. The number of tourism workers number of people who come to Iceland then advertise the country
has risen since then, as has the share of the total: in 2015, there informally on social media, with commentary and photos from their
were 17,100 people working in tourism, or 9.3% of the total number travels. In proportional terms, the power of social media is greater
Figure 27. Frequency of “Iceland” as a search string
100
90
80
70
60
50
40
30
20
10
0
2010 2011 2012 2013 2014 2015 2016
UK US Germany
Source: Google TrendsTourism in Iceland 23
in the case of Iceland because tourists outnumber inhabitants by a them, and this, too, has attracted attention to the country and its
much larger margin than in most other countries. The rise of social people. Stars such as Justin Timberlake, Beyoncé, Tom Cruise, and
media concurrent with the recent upsurge in tourism has been Justin Bieber have drawn considerable attention with their travels to
extremely favourable, as it is relatively much more costly for a small Iceland. It is difficult to quantify the advertising value of such visits,
economy to advertise itself through conventional channels than it is but it is significant.
for larger countries. As a result, it can be said with some certainty
that the recent growth in tourist numbers in Iceland is due in part to In 18th place among the world’s most
the simultaneous explosion in the use of social media. competitive tourist destinations
The Eyjafjallajökull eruption in 2010 is a good example of the Iceland ranks 18th out of 141 countries on the list of the world’s
power of advertising, as the eruption drew enormous attention most competitive travel destinations, according to a report
and has played a starring role in putting Iceland on the map as published by the World Economic Forum last year. Figure 28
a travel destination. In Figure 27, which illustrates the interest in shows the top 30 countries and a few from further down the list.
“Iceland” as an internet search string as compared with other
search strings, it can be seen that interest was greatest around As regards tourism, Iceland’s strengths include its human
the time of the Eyjafjallajökull eruption. Interest also spiked around capital and its labour market, the openness of the country and
the time of the eruptions at Grímsvötn (2011) and Bárðarbunga connectedness to airline routes, and its tourism infrastructure.
(2014/2015). Interest in Iceland therefore appears to be affected Other advantages are the safety and cleanliness of the country.
by volcanic activity. Although it is impossible to assert that there is And it comes as no surprise that Iceland’s natural beauty should be
a cause-and-effect relationship between the popularity of “Iceland” considered a strength in terms of its appeal as a travel destination.
as a search string and the upswing in the tourism sector, there are
signs that Iceland is increasingly talked about, which increases the One factor that somewhat cuts into the competitiveness of Icelandic
likelihood that interest in travelling to the country will be kindled. tourism is the shortage of cultural activities. Another negative
factor is the price level, where Iceland ranks 128th. Less developed
Alongside Iceland’s growing popularity as a travel destination, countries rank highest in terms of price level, while more developed
world-famous people have visited the country in increasing countries place further down. This is normal, of course, and actually
numbers. Such visits generate enormous attention on social media a plus for inhabitants that Iceland should not be further up on this
and tend to be a valuable advertisement for Iceland. Furthermore, part of the list. Countries ranking below Iceland in terms of price
large film producers have considered Iceland as a shooting location competitiveness include Norway, Denmark, Sweden, Italy, United
because of its natural beauty and the tax concessions available to Kingdom, Switzerland, and France.
Figure 28. The world’s most competitive tourist destinations
6
5
4
3
2
1
0
Spain
France
Germany
US
UK
Switzerland
Australia
Italy
Japan
Canada
Singapore
Austria
Hong Kong SAR
Holland
Portugal
New Zealand
China
Iceland
Ireland
Norway
Belgium
Finland
Sweden
United Arab
Emirates
Malaysia
Luxembourg
Denmark
Brazil
Kore, republic
Mexico
Turkey
Poland
India
Latvia
Argentina
Egypt
Paraguay
Pakistan
Nigeria
Angola
Source: World Economic ForumYou can also read