Tourism Sector Case for Lyttelton Cruise Wharf Development - ChristchurchNZ
←
→
Page content transcription
If your browser does not render page correctly, please read the page content below
Tourism Sector Case for Lyttelton Cruise Wharf Development
Executive Summary
Re-developing a cruise wharf facility at Lyttelton will bring significant and enduring long term economic
benefit to the Canterbury tourism economy and help revitalize the visitor sectors in Lyttelton, the central city
of Christchurch and for tourism businesses across the Canterbury region.
Key outcomes:
Having access to both Lyttelton and Akaroa will improve passenger and crew expenditure outcomes
by 56% being a $113 million improvement over “Akaroa Harbour” only operations in the first 10
years of operation.
The return of cruise ships to Lyttelton will open up a new income stream to LPC of at least $34
million over the same ten year period based on current port charges and expected arrival
performance.
Cruise ship visits to the Christchurch and Banks Peninsula would improve from 800 to 900 cruise ship
arrivals over the first 10 years. More significantly a Lyttelton Port cruise wharf facility would enable
Canterbury to welcome cruise ships in the 3,000 berth plus capacity thus increasing the overall
volume of passengers disembarking in our region by 40%.
By 2025 it is expected that at least 30% of Lyttelton cruise ship arrivals will be in the very large cruise
ship category (3,400 to 5,400 berths) that require 340-360 metres of wharf space and a 9.3 metre
draught.
With both Lyttelton Port and Akaroa Harbour in operation the region is forecast to receive 1,743,000
passengers over the first 10 years based on average CAGR of 4.2%.
The average cruise visitor spend for Lyttelton arrivals is expected to be 25% higher than for Akaroa
arrivals due to the broader range of day trip options and more time available ashore to optimise
expenditure.
The return of cruise ships to Lyttelton would boost international visitor numbers in central
Christchurch by 20-30% on cruise ship days and improve visitor spend on core tourism services by as
much as 76% over that being currently achieved in Christchurch on Akaroa cruise ship days.
The return of regular cruise ship arrivals to Lyttelton will provide a useful commercial injection to the
Dampier Bay development project and boost the performance of key hospitality and retail
businesses within Lyttelton.
The re-establishment of Lyttelton as a cruise port will give security to Canterbury ports remaining in
the long term planning of cruise line itineraries to New Zealand and ensure that South Island visits
remain a part of the trans Tasman cruise ship circuit.
The return of Lyttelton as a cruise port would mean that Christchurch could in the future be considered as a
viable alternative to Auckland as a “turnaround” port for cruise ships. Turnaround status would provide a
considerable boost to arrivals into Christchurch Airport as Christchurch would become a major port for staff
and cruise passenger embarkation. The additional economic benefits from re-fuelling and provisioning cruise
ships would also be substantial.
1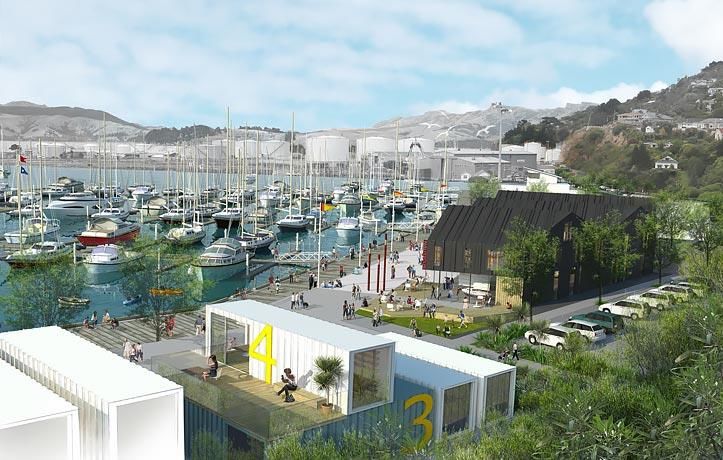
Background
Cruise ship tourism has been one of the fastest growing inbound travel sectors for New Zealand over the last
two decades with an average annual growth rate of 7% since 1990. If cruise was considered as an origin
country for inbound tourism, it would be New Zealand’s fourth largest inbound market, behind Australia,
China and the USA1.
Growth in cruise passenger numbers 2005-13
In 2013/14 119 cruise voyages brought 202,700 passengers and 69,300 crew to our shores generating and
estimated $365 million in overall value added expenditure2.
New Zealand currently receives approx 700 port visits a year of which 15% visit in the Canterbury region.
Passenger, crew and vessel related spend reached $38.7 million in the Canterbury region in the 2013/14
year.
Over the past two cruise seasons 33% of all Australian visitors to Canterbury arrived on a cruise ship. Despite
the short stay of cruise visitors, a positive experience in our region is often a catalyst for future visits to our
region using other travel modes. The cruise sector has also provided recent business top-up for Canterbury
visitor attraction businesses that were starved by the 2011 earthquake impacts at a time when Christchurch
has had constrained accommodation supply.
Prior to the 2010/11 earthquakes Lyttelton was the
preferred Canterbury destination for cruise ships due to its
proximity to Christchurch and the fact that wharf facilities
are generally preferred by cruise lines over bringing
passengers ashore in tender vessels.
The specific benefits of using wharf facilities are that:
There is less risk of accidents occurring while
loading tender vessels at sea.
It allows for provisioning of fresh food and water
and removal of rubbish.
1 Statistics NZ: YE June 2014
2 ME Spatial: Economic Impact of the NZ Cruise Sector 2014
2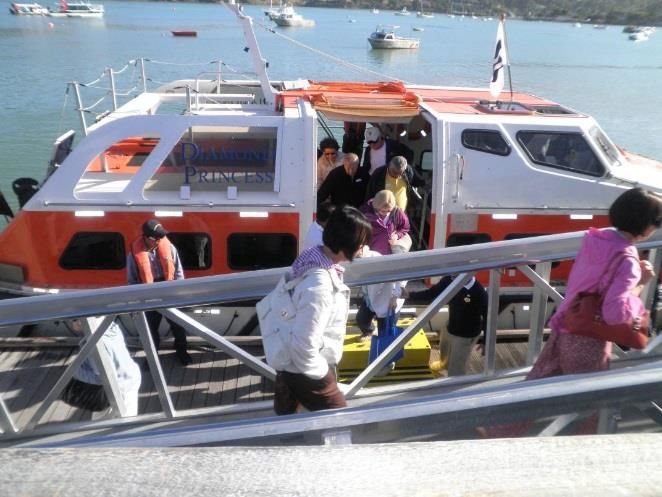
A higher percentage of passengers and crew choose to disembark and a higher percentage
participate in full day excursions.
It allows more time ashore which increases visitor satisfaction.
Severe damage to Lyttelton’s Cashin Quay 2 wharf in the 2011 earthquakes rendered this facility unusable.
After the February 2011 earthquake 90% of the arriving cruise ships transferred operations to Akaroa
Harbour as their main Canterbury arrival port. Whilst this has generally been successful for the cruise lines it
has resulted in diminished overall visitor revenue for the province due to the more limited scope for day trip
options. These limitations have been caused by restrictions to daylight operations for entering and departing
Akaroa Harbour and the distance of Akaroa from major Canterbury attractions.
Having cruise arrivals restricted to Akaroa operations has also had the following impacts:
The growth in port calls has been constrained by the fact that the very large ships coming onto the
Australia/New Zealand circuit do not have the facilities or inclination to operate on a “tender ashore”
basis given their very large passenger loadings (3,000 plus pax).
Considerably fewer cruise passengers now visit Christchurch City due to the length of the transfer
time to Christchurch and the short time available in the city. Fewer than 20% of arriving cruise
passengers make the trip across from Akaroa.
Fewer sales of high value day trip options are achieved due to inadequate time to complete some of
the more popular day excursion options such as high country tours and North Canterbury wine tours.
The RCCL “Voyager of the Seas” 3,400 berth cruise ships have bypassed Canterbury since 2011,
resulting in the loss of 15,000 cruise passengers per year. RCCL advise that by 2015/16 Canterbury
will be missing out on 10 of the Voyager Class cruise ship visits per year at a loss of 30,000 visitors to
the region.
With 60-70 cruise ship days in Akaroa the considerable crowding in the village has divided the Akaroa
Community as to the ongoing benefits of hosting cruise ships with such regularity.
Cruise Lines - Core Expectations
Since the removal of most of Lyttelton’s cruise ship handling capability in 2011, the cruise industry has been
asking when the port will again be capable of handling all cruise ships on a regular basis. Their interest in
returning to Lyttelton is based on:
1. Their need to deploy larger ships on the Australian/NZ circuit.
2. Their desire to have these ships visit the Christchurch region due to its quality tourism
experiences.
3. Their desire to use wharf facilities wherever possible due to both safety considerations and
their ability to enjoy enhanced economic value out of their clients spending longer time
ashore on shore excursions.
4. Their ability to provision ships whilst at dock.
The two largest cruise vessel operators to our region are Carnival Cruise Lines and Royal Caribbean Cruise
Lines. These two cruise giants currently operate 95% of the cruise capacity to our waters.
Both cruise line groups are experiencing significant growth in the cruise market from Australia and are
positioning a greater number of larger ships into the Asia/Pacific region because of very strong growth from
the cruise market from China.
3Over the next few years the Australia and New Zealand markets will see a growth in the population of larger
cruise ships in the 3,000 berth plus category. All port visits by these larger ships will require wharf docking
facilities.
Carnival Cruise Lines - Future intentions in respect to Lyttelton
Peter Little, VP Fleet Operations of Carnival Cruise Lines provided this perspective to CCT on 7 November
2014.
“Ships from a number of Carnival New Zealand's seven iconic cruise brands including P&O Cruises, Princess
Cruises and Holland America Line, regularly sail on New Zealand itineraries while other Carnival New Zealand
brand ships call there as part of their world voyages. Together these brands represent approximately 80 per
cent of the Australian and New Zealand cruise market.
New Zealand is an integral part of the world's fastest growing cruise market and Lyttelton previously served
as the cruise gateway to Christchurch and the many attractions of the Canterbury region.
In the post-earthquake environment, a rejuvenated Lyttelton could again become a port for cruise ships
offering the advantage of ships being able to berth alongside, which is usually preferable to having to
conduct tender operations that can be subject to weather conditions and other operational requirements.
As the leading cruise operator in the region, we appreciate the way Akaroa has admirably served the industry
and our passengers in providing access to the Canterbury region and we would expect the strong association
that has developed with the local community to continue into the future. If it were to be restored as an
additional port to Akaroa, Lyttelton offers the potential to accommodate cruise industry growth in New
Zealand which we expect to continue into the future with a million Australians a year expected to take cruise
holidays by 2016 with a significant proportion involving New Zealand itineraries.
Carnival New Zealand believes that any decisions on whether the Lyttelton proposal goes ahead are
appropriately a matter for local authorities and for the community to consider and, prior to a commitment to
resuming ship visits, the infrastructure and shore tour program for guests for Christchurch calls would need
to be in place. Consistent with our views on matters of this kind, our position is that if our ships can navigate
safely to a berth and the port fees are reasonable, we would consider calls to Lyttelton in our forward
itinerary planning.”
4Royal Caribbean Cruise Lines – Future intentions in respect to Lyttelton
Renaissance Tours represents Royal Caribbean Cruise Line (RCCL) ships calling into the Canterbury region.
Renaissance advise that those ships currently booked for future New Zealand cruising are:
Voyager of the Seas 3500 pax
Explorer of the Seas 3500 pax
Celebrity Solstice 3000 pax
Radiance of the Seas 2500 pax
Azamara Quest 700 pax
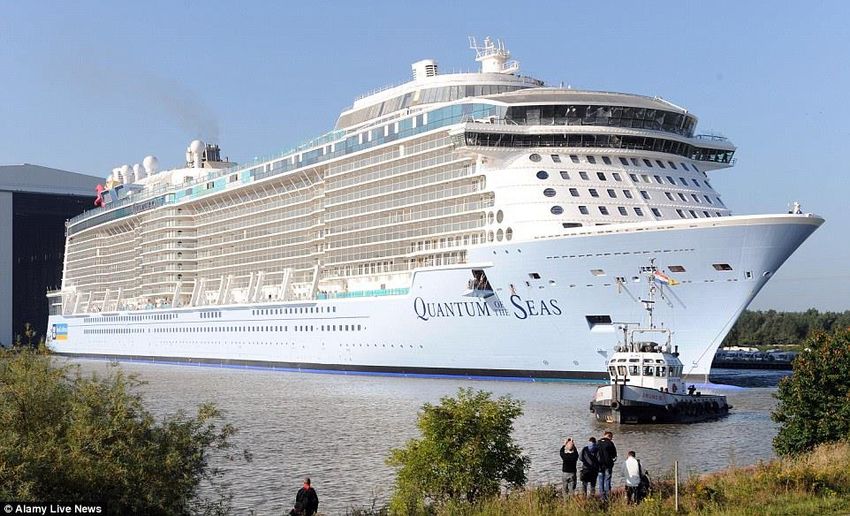
Diagram of 3,500 berth “Voyager Class” cruise ship that is currently operating in New Zealand waters but is unable to
call at Akaroa or Lyttelton.
RCCL ships under consideration for New Zealand itineraries within three years will go up to 4,500 pax in berth
capacity and require access to wharf space to be able to operate in New Zealand.
Effects of lack of access to Lyttelton for RCCL
Tony Petrie MD of Renaissance Tours, who represents RCCL in New Zealand, advises as follows:
1. RCCL ships over 3,000 pax capacity are unable to call at Akaroa due to the tender travel distance
and insufficient local tender back-up from other commercial boat operators.
2. The resulting elimination of Lyttelton/Akaroa unravels the only viable itinerary for large cruise
ships visiting the South Island. Travel between Dunedin and Wellington then requires a sea day
which is unacceptable (and unmarketable) after already spending three sea days getting to
Dunedin from Australia.
3. By 2016/17 less than half (and possibly as low as 30%) of the potential pax carried by RCCL will call
in Canterbury.
4. The above loss to Canterbury will have a flow on effect to the rest of the country and could result
in eliminating Dunedin and Milford Sound (which generates up to 200 guests on overnights to
Queenstown) visits from future cruise itineraries.
5. The cost to the rest of the New Zealand would escalate as itineraries without the South Island will
make New Zealand less attractive than other Pacific or Australian destinations. This is already
evident from forward bookings.
6. Whilst the points above refer to RCCL ships, we know that all the major lines are looking at
bringing bigger ships to the region and by and large, they will face the same limitations.
5“Quantum of the Seas” 4,200 passenger capacity.
Economic Impacts on Inner City Christchurch
Prior to the February 2011 earthquake event Christchurch City was experiencing relatively strong visitor
flows and it was evident in the peak summer season (from Nov-Mar) that a high proportion of the pedestrian
traffic in the inner city was of overseas origin. Christchurch would generally have had 5,000 – 7,000
international visitors in the city per day during peak summer months. International visitors comprised a good
30% of patrons in hospitality premises and major retailers such as Ballantynes reported that more than 35%
of their sales were sourced from international visitors.
Tourism operator survey data indicates that the use of Lyttelton for cruise arrivals had a profoundly positive
economic impact on visitor spend in both the central city city’s retail and hospitality sectors.
In the visitor attraction sector the impact was particularly stark.
On an average Lyttelton cruise ship day 15-18 coach loads of cruise passengers would come into the central
city providing a 7 hour opportunity for these visitors to both fully explore the city and engage in a number of
paid visitor activities and city tours.
Based on a survey of 12 Christchurch based primary visitor activities and half day tours the average visitor
uptake of cruise passengers for Lyttelton cruise arrivals in 2010 was 185% higher in volume terms and 128%
higher in revenue terms than on an Akaroa cruise arrival day. Visitor spend on the 12 products surveyed is
estimated to comprise 60-70% of cruise passengers activity expenditure in Christchurch and the broader
region whilst ashore.
Across these 12 products the average daily revenue for Lyttelton cruise ship day was 76% higher than a
summer time non cruise ship day with cruise passenger revenue adding $104,000 to revenue levels on each
cruise ship day across the 12 tourism activities surveyed. Similar earnings trends are likely in both retail and
hospitality sectors which have not been surveyed in this analysis due to lack of tracking methods.
On the basis of this analysis it is clear that on summer days when cruise ships berth at Lyttelton overall visitor
volumes within the city environment are boosted by 20-30% but expenditure on core tourism activities is
boosted by as much as 70%.
6Returning cruise ship operations to Lyttelton will also support the economic case for the development of a
waterfront recreation and hospitality area at the southern end of the inner harbour in Dampier Bay that
feature in Christchurch City Council Lyttelton Master Plan and Port Lyttelton Development Plans.
Activation of the Lyttelton Port and surrounding areas
Prior to the 2010 and 2011 earthquakes the Lyttelton township did not attract any sizeable volume of the
disembarking passengers from cruise ships for a number of reasons:
1. Walk off access to/from the wharf area was not possible due to the closed off and industrial nature of
the Port area. This required arriving passengers to be shuttled to and from the Lyttelton Visitor Centre
in London St.
2. Notwithstanding its appealing village atmosphere and unique cafes and shops, Lyttelton was not
considered by the cruise lines as a substantial hospitality and retail hub and was not actively
promoted to cruise passengers by the cruise lines.
3. There was no well-defined retail, hospitality and entertainment area overlooking the harbour or port
area.
Fewer than 15% of those cruise passengers disembarking at Lyttelton spent time in the Lyttelton area on
cruise ship days. The unique activities available for cruise passengers in Lyttelton were the historic walking
tour and visiting the Timeball Station. Visiting the local cafes and shops was a standard practice. Many crew
enjoyed disembarking in Lyttelton to spend time in internet cafes and go shopping.
In the Christchurch City Council Lyttelton Master Plan and Port Lyttelton Development Plans there are
proposals to develop a waterfront recreation and hospitality area at the southern end of the inner harbour in
Dampier Bay. The commercial success of this development will depend on demand from both the local
market and international visitors.
“Dampier Bay development concept”
The return of cruise ships to Lyttelton could have a material benefit for this new waterfront development by
improving the economic viability of the area. It is estimated that if 20% of arriving cruise ship passengers
7chose to spend their day visit in Lyttelton township this could generate up to 600 pax per day over
approximately 50 cruise ship visits per season; the potential is to attract up to 30,000 overseas visitors per
summer to this new waterfront precinct.
Value Chart of Lyttelton vs Akaroa Cruise Ship Passenger Activity
It is estimated that 85% of disembarking passengers coming ashore at Lyttelton delivered visitor spend in the
medium-high category whereas for Akaroa cruise arrivals only 45% of disembarking passengers spend at this
level. The lower spend for Akaroa is primarily caused by the much shorter stay time in Christchurch (3hrs vs
7hrs) and fewer high value shore excursion options available from Akaroa.
Lyttelton Arrival Akaroa Arrival
Activity Stay in Visit Shore Stay in Tour/Attraction Visit Shore
Split Lyttelton Christchurch Excursion Akaroa in Banks Christchurch Excursion
Tour Peninsula Tour
% of Pax 15% 50% 35% 40% 20% 15% 25%
Value of Low Medium High Low Medium Low High
Spend
Data source: Prepared by CCT based on information from shipping agents and shore excursion inbound tour operators.
The Broader Economic Benefits of having both Akaroa Harbour and Lyttelton Port being available
for cruise ship arrivals
A core part of the analysis to assess the benefits of dual port access in the Christchurch and Banks Peninsula
region is to model the likely size and volume of cruise ship movements that would occur if both Akaroa and
Lyttelton could host cruise ship arrivals in the future.
This has been assessed by taking the cruise arrival forecast if Akaroa Harbour is the only arrival facility for
cruise ships as the “factual” case and comparing this with a “counterfactual” case which assumes that a new
cruise wharf is developed at Lyttelton from 2017/18 and that both harbours are used for cruise ship arrivals
from that year onwards.
Model Assumptions
Factual – Akaroa Harbour Only
1. Akaroa has the wharf and handling capacity to handle the 38% increase in cruise vessel arrivals over
the next 10 years.
2. That any cruise ships with greater than 2,900 berth capacity cannot use Akaroa Harbour for
operational reasons.
3. Average visitor spend ashore is based on Lincoln University cruise ship passenger research conducted
in Akaroa in 2012/13.
4. Average berth capacity is set at 1,850 per vessel based on 2013/14 season and increases by 100 pax in
2015/16 season due to the expected change in fleet mix.
5. Estimated percentage of pax and crew coming ashore is based on advice from the ship handling
agents.
6. Cruise ship deployments for the Australasia region are typically scheduled on a two year cycle which
means that the growth capacity steps are typically occurring every second year rather than annually.
7. That no other port changes or network effects disrupt existing cruise ship patterns.
8Counterfactual – Both Akaroa Harbour and Lyttelton Port
1. Both Akaroa Harbour and the Lyttelton Port become available for simultaneous use from 2017/18
cruise season onwards.
2. The Lyttelton cruise wharf has capacity for the 311 metre “Voyager” Class ships (3,400pax) from
2017/18 onwards.
3. Average visitor spend ashore is based on 50% of cruise ship arrivals choosing Lyttelton (2017/18 –
2019/20) then 60% using Lyttelton from 2020/21 due to the further increase in the fleet
composition to larger ships.
4. Pax disembarking at Lyttelton spend 25% more ashore due to the longer time ashore and a
broader range of high value day trip options being available.
5. Average pax capacity is based on the cruise vessel mix changing in 2017/18 when larger ships can
dock at Lyttelton. This leads to a capacity surge in the first year of a new cruise wharf being
available at Lyttelton.
6. Pax growth after 2017/18 progresses at CAGR average of 4.2% per annum until 2026/27 which is
40% slower than the last decade of activity due to the maturing state of the cruise visitor sector.
7. Estimated percentage of pax and crew coming ashore is based on advice from the ship handling
agents.
8. That no other port changes or network effects disrupt prevailing cruise ship patterns.
The tables below outline that the “counterfactual” dual port scenario allows the region to realise the
following visitor spend outcomes over the 10 years from 2017/18 to 2026/27.
Ten Year Forecast of Pax and Crew Expenditure - 2017/18 to 2026/27
Factual Counterfactual
Akaroa Harbour Only Akaroa & Lyttelton Variance
Cruise Ship Movements (over 10 years) 800 900 +12%
Pax Disembarking 1,248,000 1,743,000 +40%
Crew Disembarking 204,000 326,000 +60%
Avg Spend per Pax (in 2017/18 NZD terms) $140 $157 +12%
Total Visitor Spend (over 10 years) $202,851,000 $315,590,000 +56%
Note: Based on Lyttelton becoming large cruise ship capable from 2017/18
Of key significance in the “counterfactual” case is the fact that over a ten year period the use of Akaroa
Harbour and Lyttelton Port for cruise arrivals boosts overall visitor expenditure by $113 million versus the
Akaroa Harbour only scenario.
Revenue Outcomes for Lyttelton Port Company
In addition to the broader economic impacts of cruise passenger and crew expenditure in the
“counterfactual” case the Lyttelton Port Company is estimated to grown it’s earning from $2.1 to
$4.1 million per annum as cruise visits increase and cruise ships on average become larger.
Total earnings for LPC from port services supplied to the cruise sector over the ten years from
2017/18 to 2026/27 are estimated to exceed $34 million.
9Employment Impacts
Whilst the case for Lyttelton to be re-developed as a cruise port is not being primarily pitched on
the basis of job creation benefit, the availability of Lyttelton as a cruise ship arrival port will have a
moderate influence on seasonal transport and hospitality employment demand particularly in
Christchurch City and Lyttelton township.
Cruise New Zealand’s Economic Impact Report for 2014 indicates the cruise sector directly supports
712 jobs in Canterbury. Given the progressively enhanced performance of the dual port scenario
over the years from 2017/18 to 2026/27 we expect employment levels related to cruise will grow by
40% over this period enabling an estimated 284 equivalent jobs in the region. Employment demand
is predicated on the forecast growth in passenger and crew traffic over this period. Most of the
employment benefit will be realised in the Christchurch region and many of the roles created are
anticipated to be seasonal rather than fulltime positions.
Prepared by Christchurch & Canterbury Tourism
19 November 2014
10Canterbury Cruise - Visitor Expenditure Economic Impacts
Evaluation of cruise earning enhancement if Lyttelton Port becomes available for cruise ship vessels.
FACTUAL - Prospective visitor spend outcomes if cruise vessels are restricted to using Akaroa Harbour only (which limits them to a maximum of 2,900 berth capacity)
Cruise Pax Spend 2014/15 2015/16 2016/17 2017/18 2018/19 2019/20 2020/21 2021/22 2022/23 2023/24 2024/25 2025/26 2026/27 Ten Yr Totals
Estimate Forecast Forecast Forecast Forecast Forecast Forecast Forecast Forecast Forecast Forecast Forecast Forecast
Cruise Arrivals per Season 73 65 65 70 70 75 75 80 80 85 85 90 90 800
Average Pax Capacity 1850 1950 1950 1950 1950 1950 1950 1950 1950 1950 1950 1950 1950
Estimated % coming ashore 80% 80% 80% 80% 80% 80% 80% 80% 80% 80% 80% 80% 80%
Pax disembarking per vessel 1480 1560 1560 1560 1560 1560 1560 1560 1560 1560 1560 1560 1560
Total pax per season 108,040 101,400 101,400 109,200 109,200 117,000 117,000 124,800 124,800 132,600 132,600 140,400 140,400 1,248,000
Average Spend3 $132 $135 $137 $140 $143 $146 $149 $152 $155 $158 $160 $163 $166
Total Spend per season $14,261,280 $13,652,496 $13,925,546 $15,296,677 $15,602,610 $17,051,424 $17,392,452 $18,922,988 $19,301,448 $20,917,944 $21,216,000 $22,885,200 $23,306,400 $191,893,143
Crew Spend
Cruise Arrivals per Season 73 65 65 70 70 75 75 80 80 85 85 90 90 800
Average Crew Capacity 800 850 850 850 850 850 850 850 850 850 850 850 850
Estimated % coming ashore 30% 30% 30% 30% 30% 30% 30% 30% 30% 30% 30% 30% 30%
Crew disembarking per vessel 240 255 255 255 255 255 255 255 255 255 255 255 255
Total crew per season 17,520 16,575 16,575 17,850 17,850 19,125 19,125 20,400 20,400 21,675 21,675 22,950 22,950 204,000
Average Spend $46 $47 $48 $49 $50 $51 $52 $53 $54 $55 $56 $57 $58
Total Spend $805,920 $777,699 $793,253 $871,358 $888,785 $971,315 $990,741 $1,077,927 $1,099,485 $1,191,567 $1,215,398 $1,312,630 $1,338,883 $10,958,090
Total Spend - Pax & Crew $15,067,200 $14,430,195 $14,718,799 $16,168,034 $16,491,395 $18,022,739 $18,383,194 $20,000,915 $20,400,933 $22,109,511 $22,431,398 $24,197,830 $24,645,283 $202,851,233
Assumptions: 1. Akaroa has the wharf and handling capacity to handle the 38% increase in cruise vessel arrivals over the next 10 years.
2. That any cruise ships with greater than 2,900 berth capacity cannot use Akaroa Harbour for operational reasons.
3. Average visitor spend ashore is based on Lincoln University cruise ship passenger research conducted in Akaroa in 2012/13.
4. Average berth capacity is set at 1,850 per vessel based on 2013/14 season and increases by 100 pax in 2015/16 season due to the expected change in fleet mix.
5. Estimated percentage of pax and crew coming ashore is based on advice from the ship handling agents.
6. Cruise ship deployments for the Australasia region are typically scheduled on a two year cycle which means that the growth capacity steps are typically occurring every second year rather than annually.
7. That no other port changes or network effects disrupt existing cruise ship patterns.
Note 1: this model takes no account of cruise vessel fees to CCC and value of ship servicing and provisioning.
Note 2: the Akaroa Harbour only option also takes account of 4 small cruise ship visits to the Lyttelton inner harbour in each cruise ship season.
3
Average pax and crew spend increases at 2% per annum
11COUNTERFACTUAL - Prospective visitor spend outcomes if all cruise vessels (in 900 to 4,900 pax range) can use both Lyttelton and Akaroa Harbour from 2017/18
Cruise Pax Spend 2014/15 2015/16 2016/17 2017/18 2018/19 2019/20 2020/21 2021/22 2022/23 2023/24 2024/25 2025/26 2026/27 Ten Yr Totals
Estimate Forecast Forecast Forecast Forecast Forecast Forecast Forecast Forecast Forecast Forecast Forecast Forecast
Cruise Arrivals per Season 73 65 65 80 80 85 85 90 90 95 95 100 100 900
Average Pax Capacity 1850 1950 1950 2100 2100 2100 2200 2200 2300 2300 2400 2400 2400
Estimated % coming ashore 80% 80% 80% 85% 85% 85% 86% 86% 86% 86% 86% 86% 86%
Pax disembarking per vessel 1480 1560 1560 1785 1785 1785 1892 1892 1978 1978 2064 2064 2064
Total pax per season 108,040 101,400 101,400 142,800 142,800 151,725 160,820 170,280 178,020 187,910 196,080 206,400 206,400 1,743,235
Average Spend 4 $132 $135 $137 $157 $160 $163 $163 $166 $170 $173 $176 $180 $184
Total Spend per season $14,261,280 $13,652,496 $13,925,546 $22,419,600 $22,867,992 $24,783,186 $26,213,660 $28,310,753 $30,189,557 $32,504,090 $34,595,658 $37,144,811 $37,887,708 $296,917,015
Crew Spend
Cruise Arrivals per Season 73 65 65 80 80 85 85 90 90 95 95 100 100 900
Average Crew Capacity 800 850 850 900 900 900 950 950 1000 1000 1050 1050 1100
Estimated % coming ashore 30% 30% 30% 36% 36% 36% 36% 36% 36% 36% 36% 36% 36%
Crew disembarking per vessel 240 255 255 324 324 324 342 342 360 360 378 378 396
Total crew per season 17,520 16,575 16,575 25,920 25,920 27,540 29,070 30,780 32,400 34,200 35,910 37,800 39,600 319,140
Average Spend $46 $47 $48 $53 $54 $55 $56 $57 $59 $60 $61 $62 $63
Total Spend $805,920 $777,699 $793,253 $1,373,760 $1,401,235 $1,518,589 $1,635,014 $1,765,815 $1,895,928 $2,041,282 $2,186,213 $2,347,302 $2,508,260 $18,673,398
Total Spend - Pax & Crew $15,067,200 $14,430,195 $14,718,799 $23,793,360 $24,269,227 $26,301,775 $27,848,674 $30,076,568 $32,085,485 $34,545,372 $36,781,871 $39,492,114 $40,395,968 $315,590,413
Assumptions 1. Both arrival harbours and the Lyttelton Port become available for simultaneous use from 2017/18 cruise season onwards.
2. The Lyttelton cruise wharf has capacity for the 311 metre “Voyager” Class ships (3,400pax) from 2017/18 onwards.
3. Average visitor spend ashore is based on 50% of cruise ship arrivals choosing Lyttelton (2017/18 – 2019/20) then 60% using Lyttelton from 2010/21 due to the further increase in the fleet composition to larger ships.
4. Pax disembarking at Lyttelton spend 25% more ashore due to the longer time ashore and a broader range of high value day trip options being available.
5. Average pax capacity is based on the cruise vessel mix changing in 2017/18 when larger ships can dock at Lyttelton. This leads to a capacity surge in the first year of a new cruise wharf being available at Lyttelton.
6. Pax growth after 2017/18 progresses at CAGR average of 4.2% per annum until 2016/27 which is 40% slower than the last decade of activity due to the maturing state of the cruise visitor sector.
7. Estimated percentage of pax and crew coming ashore is based on advice from the ship handling agents.
8. That no other port changes or network effects disrupt prevailing cruise ship patterns.
Note: this model takes no account of cruise vessel fees to CCC and value of ship servicing and provisioning
2014/15 2015/16 2016/17 2017/18 2018/19 2019/20 2020/21 2021/22 2022/23 2023/24 2024/25 2025/26 2026/27 Total Improvement
Variance in Visitor Spend
between Akaroa only
and combined Akaroa
and Lyttelton - - - $7,625,326 $7,777,832 $8,279,036 $9,465,480 $10,075,653 $11,684,552 $12,435,861 $14,350,472 $15,294,283 $15,750,685 $112,739,179
4
Average pax and crew spend increases at 2% per annum
12You can also read