Tourism2030 - NT's Tourism Industry Strategy 2030
←
→
Page content transcription
If your browser does not render page correctly, please read the page content below

Tourism
                         2030

NT’s Tourism
Industry Strategy 2030
                            Northern Territory’s Tourism Industry Strategy 2030 Report   1
© Northern Territory Government

Tourism NT
Level 8, Charles Darwin Centre
19 The Mall, Darwin NT 0800
GPO Box 1155
DARWIN NT 0801

Telephone 08 8999 3900

Tourismnt.com.au (corporate)
northernterritory.com (consumer)

Published September 2019 by Tourism NT
a statuatory authority of the Northern Territory Government

DISCLAIMER

We have taken due care and attention in ensuring information
contained in this report was true and accurate at time of publication,
however, changes in circumstances after the time of publication may
impact on its accuracy. We do not warrant that it is correct, complete
or suitable for the purposes for which it is intended to be used.
We disclaim all liability associated with the use of this information.

Boat Cruise, Nitmiluk National Park.                                     Cover image: Cultural tours with SEIT Outback Australia.

Contents
List of acronyms                                                                                                       2

Foreword		                                                                                                             3

1     Development of the tourism industry strategy                                                                     4

2     Current industry profile and trends                                                                              6

      2.1   Current profile of the tourism industry                                                                   6
      2.2   Domestic holiday visitors to the Northern Territory                                                       7
      2.3   International holiday visitors to the Northern Territory                                                  9
      2.4   Trends in visitation to the Northern Territory                                                           11

3     Importance of tourism to the Northern Territory                                                                12

      3.1   For Northern Territory residents                                                                         12
      3.2   For the Northern Territory economy                                                                       13

4     Foundations of the strategy                                                                                    14

      4.1   Building on the Northern Territory’s strengths                                                           14
      4.2   Current and future industry context                                                                      15
      4.3   Implications for the strategy                                                                            16

5     NT’s Tourism Industry Strategy 2030                                                                            17

      5.1   Strategic framework                                                                                      17
      5.2   Priority objectives                                                                                      18
      5.3   Critical pillars                                                                                         41
      5.4   Ongoing reporting and reviews                                                                            44
      5.5   What can we achieve?                                                                                     44
      5.6   Impact on the Northern Territory economy                                                                 48

6     What does achieving the strategy mean?                                                                         49

      6.1   For the Top End                                                                                          49
      6.2   For Central Australia                                                                                    50
      6.3   For industry                                                                                             51

Appendix A		                                                                                                         53

      Economic modelling methodology and results                                                                     54

Appendix B		                                                                                                         59

      Estimates of tourism jobs                                                                                      59

                                                                  Northern Territory’s Tourism Industry Strategy 2030 Report   1
List of acronyms

          Term          Full name
          ABDP          Aboriginal Business Development Program
          ALRA          Aboriginal Land Rights (Northern Territory) Act 1976
          ATAC          Aboriginal Tourism Advisory Council
          CAGR          Compound annual growth rate
          CGE           Computable general equilibrium
          DAE-          Deloitte Access Economics Regional General Equilibrium Model
          RGEM
          DAMA          Designated Area Migration Agreement
          DIPL          Department of Infrastructure, Planning and Logistics
          DTBI          Department of Trade, Business and Innovation
          DTSC          Department of Tourism, Sport and Culture
          FIT           Free and independent traveller
          FTE           Full-time equivalent
          GDP           Gross domestic product
          GFC           Global Financial Crisis
          GSP           Gross state product
          GVA           Gross value added
          IBA           Indigenous Business Australia
          IVS           International Visitor Survey
          NTBESF        Northern Territory Business Events Support Fund
          NTBE          Northern Territory Business Events
          NTMEC         Northern Territory Major Events Company
          NVS           National Visitor Survey
          POV           Purpose of visit
          RTO           Regional Tourism Organisation
          RV            Recreation vehicle
          VFR           Visiting friends and relatives

2   Northern Territory’s Tourism Industry Strategy 2030 Report
        Uluru - Kata Tjuta National Park.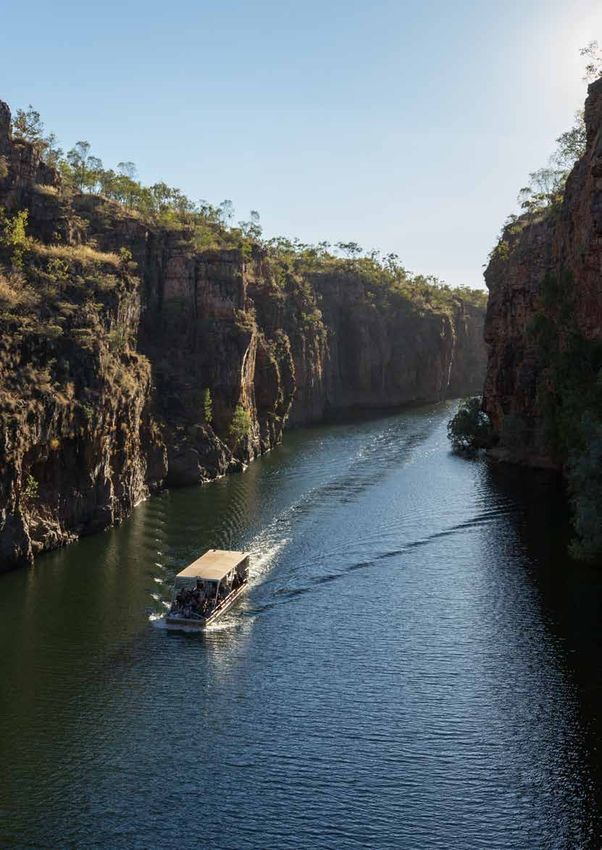
Foreword
Tourism is one of the most important sectors in the Northern Territory economy, contributing $2.2 billion in gross value added
terms in 2017-18. As the Northern Territory’s economy has shifted significantly in recent years, so has the tourism industry – with
an increasingly competitive landscape, new technologies and flow-on effects from other industries, such as construction and
mining, all at play.

The Northern Territory’s Tourism Industry Strategy 2030 sets out the strategic direction for industry development over the next
decade. Over this time period, the tourism landscape will continue to change – and so the NT’s Tourism Industry Strategy 2030 will
be reviewed and adapted, to ensure its ongoing relevance. The strategy will also be supported by specific shorter term plans,
including Tourism NT’s marketing strategy, which is refreshed on a regular basis due to changes in consumer preferences, travel
behaviour and marketing tools.

This framework has been co-developed with both industry and government and is designed to unite efforts across the public
and private sectors, with priorities and actions targeted towards shifting the current performance of the tourism sector in the
Northern Territory to one of sustainable growth. Six priority objectives are identified that, if delivered, will make a material impact
on the trajectory of tourism in the Northern Territory:

        •     Grow investment in the Northern Territory’s remarkable assets, product and regions
        •     Strengthen and showcase the Northern Territory’s distinctive Aboriginal cultural tourism experiences
        •     Through strategic marketing activities grow the value of the holiday market in the Northern Territory
        •     Leverage and build events to drive visitation
        •     Develop ongoing access to and within the Northern Territory
        •     Increase recognition of the value of tourism to the Northern Territory.

Within each priority objective are specific actions to achieve identified goals in the short, medium and long term. Implementing
the strategy’s actions through to 2030 will create the momentum to attract more domestic and international visitors to the
Territory, and prepare the industry to deliver high quality and increasingly diverse experiences. Four pillars: industry development;
marketing; workforce development; and collaboration across industry and government also reinforce the actions identified within
key priorities to underpin the strategy’s success.

The NT’s Tourism Industry Strategy 2030 proposes visitor and expenditure targets to 2030, which assume that identified actions are
implemented with sufficient funding and support from across the Northern Territory and Australian Governments, Regional Tourism
Organisations, Land Councils and the broader tourism industry.

By 2030, total overnight visitor arrivals to the Northern Territory are projected to reach between 2.51 million and 3.03 million, accounting
for between $3.01 billion and $3.67 billion in expenditure. In terms of holiday visitors, projections are for between 1.18 million and 1.45
million holiday visitors by 2030, and $1.46 billion to $1.79 billion in holiday visitor expenditure.

Achieving the targets identified in the NT’s Tourism Industry Strategy 2030 will have significant benefits for the economy, which would
be $117 million1 larger in gross state product (GSP) terms in 2029-30, compared to a ‘business-as-usual’ scenario. The additional economic
activity supported by increased visitor expenditure could see up to 3,900 new tourism jobs by 2030. The actual number of jobs reached
will be impacted by many things including digitalisation, new technologies, productivity gains, efficiencies and the level of investment by
industry and governments.

There is a strong economic imperative to work together to implement the priority objectives and actions in the NT’s Tourism Industry
Strategy 2030. We look forward to continuing to work together to showcase the Northern Territory to the world.

The Hon Lauren Moss MLA                                            Simonne Shepherd
Minister for Tourism, Sport and Culture                            Chief Executive Officer,
                                                                   Department of Tourism, Sport and Culture

1
    Real, 2018 dollars.

                                                                                            Northern Territory’s Tourism Industry Strategy 2030 Report   3
1 Development of the tourism
      industry strategy
    Tourism is one of five core growth sectors identified in the Economic Development Framework to propel the Northern
    Territory’s economy in the long term. With the Territory’s distinct landscapes, experiences and cultural offering, it has much to offer
    the rest of Australia and the world.

    The tourism landscape has become increasingly competitive both across Australia and internationally, with more countries opening
    their doors and competing for visitor dollars. International visitor arrivals to Australia now exceed 9.0 million per year2 – an increase
    of almost 3.0 million visitors compared to five years earlier. And while the number of global travellers continues to rise, Australians
    – the traditional source of the Territory’s visitors – often look overseas for holiday destinations, with the number of Australian
    outbound trips doubling since 2006. As a comparison, domestic overnight trips topped 100 million in 2017-18, increasing by one
    third over the same period.3

    Visitors are increasingly engaging with technology in their travels, from inspiration to planning and bookings, through to how they
    access information while in the destination and sharing their experiences online. New technologies are also disrupting the tourism
    industry itself – with the sharing economy, aviation technology and digital platforms fundamentally changing how the sector
    operates.

    This landscape highlights the need for a renewed industry strategy: one which acknowledges the work undertaken across a range
    of initiatives and plans, unites efforts across the public and private sectors, and guides priority objectives and actions towards
    future growth.

    This strategy builds upon the work achieved in earlier tourism strategies developed in the Northern Territory and Australia,
    including the most recent, Tourism Vision 2020: Northern Territory’s Strategy for Growth. Targets introduced in that strategy were
    met halfway through the plan’s implementation horizon, with the construction of INPEX’s Ichthys LNG facilities resulting in a
    significant increase in domestic business travellers to the Top End. Domestic holiday trips also increased at a faster rate, a fact at
    least partially attributable to the INPEX development. However, international visitor arrivals to the Northern Territory peaked in the
    mid-2000s and, despite a slight recovery since Tourism Vision 2020, are well below previous highs. The Northern Territory’s unique
    regions also pose particular challenges and opportunities: the entry points and methods for access differ significantly by region,
    with major icons and gateways driving dispersal into surrounding areas, while source market preferences also vary significantly. This
    supports a need for a continued dedicated tourism industry strategy.

    The Department of Tourism, Sport and Culture (DTSC) engaged Deloitte Access Economics to co-develop this strategy – NT’s
    Tourism Industry Strategy 2030 – together with industry and government. Seven regional forums were held across the Territory
    in Darwin, Jabiru, Katherine, Nhulunbuy, Tennant Creek, Alice Springs and Yulara, in addition to sector workshops and targeted
    one-on-one sessions with local councils, industry bodies and government agencies. Consultations aimed to capture the insights of
    businesses, organisations and agencies across the Territory. Over 200 people were consulted from 90 businesses and organisations
    during the development of the strategy over a three-month period. Submissions were also welcomed through the Have Your Say
    survey website.

    2
     Australian Bureau of Statistics, Overseas Arrivals and Departures, Australia, Oct 2018, cat. no. 3401.0.
    3
     Tourism Research Australia, International visitor survey – year ending June 2018 (Australian Government, 2018); Tourism Research Australia, Domestic visitor
    survey – year ending June 2018 (Australian Government, 2018). All data used in this strategy is sourced from the above, unless otherwise stated.

4       Northern Territory’s Tourism Industry Strategy 2030 Report
Figure 1.1: Timeline of the strategy’s development

                              Darwin               Tennant               Aviation
                              Regional             Creek                 Meetings
                              Forum                                                            Continued
                                                   Regional
                Setting                  Katherine Forum      Yulara                           one-on-one                              Delivering
                                                                                               Meetings

                                                                                                                            December
                the                      Regional             Regional                                                                 the draft

                                                                               October
                Context                  Forum                Forum                                                                    survey

                                                                               2018

                                                                                                                            2018
                                                                                                        November
                                                                                                            2018
                  September
                       2018

                                             Nhulunbuy              Accommodation                                  Developing
                                             Regional               Workshop                                       and confirming
                                             Forum                                       Synthesizing              the strategy
                                                                    Touring
                                  Jabiru                 Alice                           insights and
                                                                    Workshop
                                  Regional               Springs                         feedback
                                  Forum                  Regional
                                                         Forum

Further, Deloitte Access Economics analysed trends in the Northern Territory’s visitor economy, as well as examined a suite
of research and data to understand the Territory’s growth trajectory, competitive advantages and challenges. This analysis
supplemented the perspectives gained through forums, workshops and consultations, which informed the priority objectives,
pillars, actions and targets set in the NT’s Tourism Industry Strategy 2030.

This document sits within a broader strategic framework that includes whole-of-economy strategies such as the Economic
Development Framework, the Northern Territory Infrastructure Strategy and the 10-Year Infrastructure Plan.4 Other connected
tourism strategies, including the Aboriginal Tourism, Business Events and Event Development strategies, were developed
concurrently and will provide comprehensive actions in particular areas within the overarching strategy framework
established in the NT’s Tourism Industry Strategy 2030. A number of other initiatives and plans also exist in the Northern
Territory and Northern Australia, and they will continue to be important in enabling the development of the sector. This
strategy has been developed within a fiscally constrained environment for the NT Government.

Figure 1.2: Tourism-focused and tourism-enabling strategies across the Northern Territory and Northern Australia

    Northern Territory plans and initiatives                                        Northern Australia plans and initiatives

    •   Aboriginal Tourism Strategy                                                 • Northern Horizons - Unleashing Our Tourism Potential
    •   Business Events Strategy                                                    • Northern Australiasn Tourism Initiative, including
    •   Event Development Strategy                                                    Entrepreneur’s Program, Tourism Partnerships Program
    •   Turbocharging Tourism                                                         and Business Advisory Service Program
    •   NT Aviation and Services Strategy                                           • Regional Tourism Infrastructure Investment Attraction
    •   Creative Industries Strategy                                                  Strategy 2016-2021
    •   Planning System Reform                                                      • building better Regions Fund
    •   Jabiru Masterplan                                                           • Northern Australia Infrastructure Facility
    •   City Deals                                                                  • Tourism Major Project Facilitation Service
    •   10 Year Infrastructure Plan and Infrastructure Strategy
    •   Anti-Social Behaiviour plan

DTSC acknowledges the participation and engagement of the tourism industry in the development of NT’s Tourism Industry
Strategy 2030. Your insights are core to the strategic framework developed to guide the industry’s development and success
through to 2030.

4
 Department of Trade, Business and Innovation, Northern Territory Economic Development Framework – Our Economic Future (2017) ; Department of Trade, Business and Innovation, Infrastructure Strategy
May 2017 (2017) ; Department of Infrastructure, Planning and
Logistics, 10 Year Infrastructure Plan 2018-2027 (2018) .

                                                                                              Northern Territory’s Tourism Industry Strategy 2030 Report     5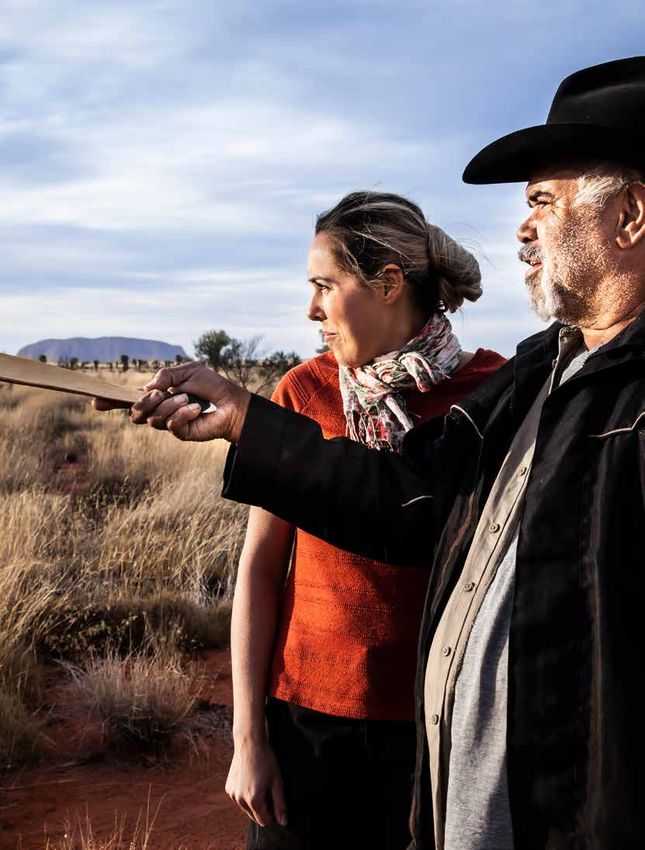
2 Current industry profile and
      trends
    2.1         Current profile of the tourism industry

    The Northern Territory welcomed 1.7 million overnight visitors in 2017-18, who spent a total of
    $2.1 billion across the Territory’s regions. Approximately 16 per cent of visitors, or 283,000 people, came from overseas – with
    the remainder travelling from interstate or within the Northern Territory.

    Chart 2.1: Visitation and expenditure in the Northern Territory, 2017-18

                                   Visitors                                                             Spend
                                                     16%                                                               19%
                                                                                           22%
                   35%

                                                                       International
                                                                       Interstate
                                                      49%                                                               59%
                                                                       Intrastate
    Source: Tourism Research Australia

    The majority of all visitors to the Northern Territory travel for a holiday (49 per cent), a higher share than other states and territories
    with the exception of Tasmania. International travellers feature prominently within the holiday segment, accounting for 28 per cent
    of holiday visitors to the Territory, a higher proportion than they represent in the overall mix of visitors or expenditure.

    The Northern Territory welcomed fewer travellers who were visiting friends and relatives (VFR) compared to other states and
    territories, which is expected given the Territory’s smaller resident population. In 2017-18, VFR travellers accounted for 13 per cent
    of all domestic and international visitors (234,000) to the Territory.

    Business travel accounts for a significant proportion of the Northern Territory’s visitors compared to other jurisdictions. In 2017-18,
    31 per cent of visitors to the Territory came for business.

    Chart 2.2: Main purpose of visitors to Australian jurisdictions, 2017-18

                           NT
                         ACT
                         TAS
                                                                                                                                Holiday
                          WA                                                                                                    VFR
                           SA                                                                                                   Business
                                                                                                                                Other
                         QLD
                          VIC
                        NSW
                                 0%                20%               40%          60%              80%            100%
    Source: Tourism Research Australia

6       Northern Territory’s Tourism Industry Strategy 2030 Report
2.2            Domestic holiday visitors to the Northern Territory

In 2017-18, the Northern Territory welcomed 1.4 million domestic overnight visitors, comprised of 834,000 interstate visitors
(58 per cent) and 594,000 intrastate visitors (42 per cent). This reflects a decrease in domestic visitation from the previous
year: in 2016-17, the Territory welcomed 1.6 million domestic visitors.

Chart 2.3: Main purpose of visit for domestic visitors to the Northern Territory, 2017-18

                                 Visitors                                                                           Spend
                              7%                                                                                6%
                                                                            Holiday
                                                                            VFR
                                                       42%                                        28%                                   56%
                37%                                                         Business
                                                                            Other

                                                                                                           10%
                                     14%

Source: Tourism Research Australia

In 2017-18, 42 per cent of domestic visitors (631,000) travelled for the purpose of a holiday, spending $717 million in the Territory,
representing 56 per cent of domestic visitor expenditure.5 Holiday visitors to and in the Territory spend significantly more per trip
on average ($1,136) than holiday travellers to other states or territories (national average of $708). They also tend to stay longer (six
nights) compared to holiday visitors to other states or territories (an average of four nights).

Interstate holiday visitors stay longer on average (nine nights) in the Territory compared to those from intrastate (two
nights). Similarly, interstate holiday visitors spend more per trip on average ($1,567) than intrastate holiday visitors ($472).

Chart 2.4: Length of stay for domestic holiday visitors in the Northern Territory, 2017-18

                                                                                                                                             1-3 nights
                                                                                                                                             4-7 nights
       Interstate
                                                                                                                                             8-14 nights
                                                                                                                                             15-30 nights
       Intrastate                                                                                                                            31 or more

                        0%               100%                  200%                 300%                400%                500%
                                                                  Visitors (thousands)
Source: Tourism Research Australia

Two in five domestic holiday visitors to the Territory were aged over 55. This is slightly higher than most states and territories,
except for South Australia and Tasmania which also have an older visitor profile. In terms of travel parties, most domestic
holiday visitors to the Northern Territory travel with friends or relatives (35 per cent) or as a couple (32 per cent).

5
    Domestic overnight expenditure by purpose is provided in destination expenditure terms. All other expenditure items are provided as regional expenditure.

                                                                                                  Northern Territory’s Tourism Industry Strategy 2030 Report    7
Chart 2.5: Age groups and travel party type of domestic holiday visitors in the Northern Territory, 2017-18

      Age 65+                                                                                             Travel party type
             55-64                                                                                     Other 3%          Alone 12%
             45-54
             35-44                                                                        Friends and
                                                                                             relatives
             25-34                                                                                35%                          Couple
             15-24                                                                                                              32%

                        0       20        40        60        80     100   120   140                          Family 18%
                                                Visitors (thousands)
    Source: Tourism Research Australia

    Likely due, in part, to the relatively low share of travellers visiting friends and relatives in the Northern Territory, the share of
    visitors staying in commercial accommodation is higher than in most other states and territories. In the Northern Territory, 40
    per cent of domestic visitors stayed in a hotel for part of their trip, higher than the national average (31 per cent). Domestic
    holiday visitors who stay in commercial accommodation also typically spend more ($1,481) in the Territory than those that
    stay in private accommodation ($691). The Territory also sees a higher proportion of domestic holiday visitors staying in other
    private accommodation (which includes homestay and privately owned properties), compared to other states and territories.

    A high proportion of domestic holiday visitors to the Territory travel by private vehicle or rental car (56 per cent), while a
    significant portion also travel by air (35 per cent).

    Chart 2.6: Accommodation type and mode of transport for domestic holiday visitors to the Northern Territory, 2017-18

                            Accommodation                                                       Mode of transport
                                     2% Other accommodation                            Bus/coach 5%           Other 2%
                                                                                         Rail 2%
                Other
               private                                                                                                   Aircraft
                  31%                                                                                                     35%
                                                         Hotels 40%
                                                                                    Private
                                                                                   vehicle or
               Friends or                                                        rental car 56%
                relatives                    Other Commercial
                      8%                           19%

    Source: Tourism Research Australia

8       Northern Territory’s Tourism Industry Strategy 2030 Report
2.3 International holiday visitors to the Northern Territory
In 2017-18, the Northern Territory welcomed 283,000 international visitors; a five per cent decrease on the previous year’s
297,000 visitors. Approximately four in five visitors (244,000) travelled for the purpose of a holiday. International holiday
visitors spent $313 million in the Northern Territory in 2017-18 and stayed an average of eight nights, higher than domestic
holiday visitors at six nights. International holiday visitors to Australia spend 18 nights on average in the country, and typically
make one to three stops during their stay.
Chart 2.7: Length of stay for international holiday visitors to the Northern Territory, 2017-18
1-3 nights
4-7 nights
8-14 nights
15-30 nights
31 or more
0% 50,000 100,000 150,000 200,000 250,000 300,000
Source: Tourism Research Australia
International visitors to the Territory are generally a younger cohort compared to the region’s domestic holiday visitors. One in
seven international holiday visitors to the Territory were under the age of 24 in 2017-18. A large proportion of international holiday
visitors to the Northern Territory are also backpackers6 (30 per cent), significantly higher than the national average of 13 per cent,
although this figure has declined from 43 per cent five years earlier. A significant proportion of international holiday visitors travel
alone to the Territory (39 per cent) or as a couple (38 per cent).
Chart 2.8: Age groups and travel party type of international holiday visitors to the Northern Territory, 2017-18
Age 65+ Travel party type
55-64 Friends and Other 1%
45-54 relatives 12%
35-44 Family 10%
Alone
39%
25-34
15-24
Couple
0 10 20 30 40 50 60 38%
Visitors (thousands)
Source: Tourism Research Australia
International holiday visitors are most likely to stay in hotels (50 per cent). A significant proportion also stay in other
commercial accommodation (32 per cent) for a part of their trip to the Northern Territory; this includes backpacker or hostel
accommodation, caravan parks and guest houses.7
International holiday visitors are more likely to travel by air (53 per cent), with bus or coach (21 per cent) and private vehicle
or rental car (20 per cent) also common modes of transport.
6
Backpackers are classified as visitors spending at least one night in backpacker or hostel during their trip.
7
Includes visitors who stay one night in a type of accommodation during their trip.
Northern Territory’s Tourism Industry Strategy 2030 Report 9Chart 2.9: Accommodation type and mode of transport of international holiday visitors to the Northern Territory, 2017-18
Accommodation Mode of transport
Other private Other 1% Other 3%
16%
Bus/coach 21%
Friends or
Hotels Aircraft
relatives 1%
50% Rail 3% 53%
Other Private vehicle
commercial or rental car
32% 20%
Source: Tourism Research Australia
The Northern Territory’s international visitors arrive predominantly from the traditional markets of the United Kingdom (15 per cent
of all international holiday visitors), the United States (13 per cent) and Germany (11 per cent). Increasingly, the Territory has appealed
to emerging markets like China and South East Asian countries – with visitor arrivals from these countries increasing over time.
While arrivals from some countries declined over the twelve months to June 2018, as international visitors to the Northern Territory
decreased overall, there remain pockets of growth, including from Japan and China.
Chart 2.10: International holiday visitor trips to the Northern Territory and percentage change over past twelve months, 2017-18
40,000 0
35,000 0.21
International Trips
30,000 -0.17
25,000 0.24
20,000 0.25 0.2
15,000 0.07
0.07 -0.02 -0.24
10,000 -0.11
5,000
0
UK
A
y
n
na
ce
y
nd
Ze ia
d
da
an
al
pa
an
US
ew nav
an
hi
na
la
It
rm
Ja
al
rC
r
Fr
Ca
ze
di
Ge
te
an
it
Sw
ea
Sc
N
Gr
Source: Tourism Research Australia
Note: Greater China includes China, Hong Kong and Taiwan
Based on source market preferences, trends in visitation and aviation connections, Tourism NT focuses its activities on
specific key markets. Its tier one priority markets include the United States and Greater China, which represent the greatest
potential value for the Territory over the next decade. Tier two markets include the United Kingdom, Japan, Germany, France,
Italy and New Zealand, reflecting Tourism NT’s marketing and investment priorities informed by available research and
insights.
10 Northern Territory’s Tourism Industry Strategy 2030 Report2.4 Trends in visitation to the Northern Territory
Prior to 2013, domestic travel to the Northern Territory had remained relatively steady. After a slight decline from 2009 to 2011,
the construction of INPEX’s Ichthys LNG project from 2014 saw a significant increase in domestic visitors to the Northern Territory,
largely for business purposes as fly-in fly-out workers arrived. At the same time, holiday visitation trended slightly upwards –
potentially reflecting an increased number of holiday-related trips of Ichthys workers or their families.
Domestic expenditure in the Northern Territory trended lower from 2007 onwards, likely due to the Global Financial Crisis
which saw a decline in consumer confidence. Expenditure increased from 2012-13 as Ichthys workers arrived in the Top End,
although declined in the most recent period, as the Ichthys construction phase shifted to production.
Chart 2.11: Domestic overnight trips and domestic overnight expenditure, total and holiday, 2005-06 to 2017-18
1,800 $2,500
1,600
Domestic Spend ($ millions)
Domestic Overnight Trips
1,400 $2,000
1,200
(Thousands)
1,000 $1,500
800
$1,000
600
400
$500
200
0 0
6
7
8
20 -09
20 10
20 -11
20 12
20 13
20 14
20 -15
20 -16
20 -17
8
6
7
8
20 -09
20 10
20 -11
20 12
20 13
20 14
20 -15
20 -16
-0
-0
-0
20 -17
8
-1
-0
-0
-0
-
-
-
-
05
06
07
08
09
10
11
12
13
14
15
-1
-
-
-
-
16
17
05
06
07
08
09
10
11
12
13
14
15
16
17
20
20
20
20
20
20
20
20
Total Holiday Total Holiday
Source: Tourism Research Australia
International visitation to the Northern Territory declined from 2006 onwards, although began to recover in 2012, potentially
due to a number of Government initiatives to improve international visitation to the region. In 2013, the Northern Territory
Government committed to providing additional funding for Tourism NT to increase international marketing activities,
potentially improving international visitation to the region.8
International expenditure has been relatively flat over the last decade, ranging between $390 million and $470 million in the
last five years. International visitor expenditure declined from 2009 onwards – possibly a delayed effect as trips pre-booked
before the GFC ran their course.
Chart 2.12: International visitor trips and international visitor expenditure, total and holiday,
2005-06 to 2017-18
400,000 $500
Domestic Spend ($ millions)
350,000
$400
International Trips
300,000
(Thousands)
250,000 $300
200,000
150,000 $200
100,000
$100
50,000
0 0
6
7
8
20 -09
20 10
20 -11
20 12
20 13
20 14
20 -15
20 -16
6
7
8
20 -09
20 10
20 -11
20 12
20 13
20 14
20 -15
20 -16
20 -17
20 -17
8
8
-0
-0
-0
-0
-0
-0
-1
-1
-
-
-
-
-
-
-
-
05
06
07
08
09
10
11
12
13
14
15
05
06
07
08
09
10
11
12
13
14
15
16
16
17
17
20
20
20
20
20
20
20
20
Total Holiday Total Holiday
Source: Tourism Research Australia
8
Department of Tourism, Sport and Culture, ‘Tourism industry on road to recovery’ (Media Release, 11 September 2013) .
Northern Territory’s Tourism Industry Strategy 2030 Report 113 Importance of tourism to the
Northern Territory
3.1 For Northern Territory residents
A strong and competitive tourism industry has widespread benefits for local regions and their residents. Tourists arrive in
the Northern Territory and spend money on attractions, meals and accommodation – leading to economic benefits. However,
improvements in the tourism offering also enhance the Territory’s liveability and enjoyment for locals. Tourism highlights the
need for infrastructure investment and development. For example, infrastructure improvements on routes used by self-drive
tourists can open up roads that were previously inaccessible during wet periods, providing access to local communities and
also enables Territorians to travel more easily for work and pleasure.
Tourism developments, such as art galleries or walking paths, can have tourism benefits through encouraging visitation and
spend in the region. However these projects can also provide better facilities and experiences for Territorians. Enjoyable events
make a destination attractive for tourists, and can also provide a vibrant and liveable location for residents.
A strong tourism industry also supports the Territory’s local economy. Visitors arrive in the Territory and spend in its regions: in
local cafes and restaurants, for retail purchases, tours and transport. The majority of tourism expenditure – $5 in every $6 – is
sourced from interstate and overseas visitors.
Figure 3.1: Visitors and spend per resident in Australian jurisdictions, 2017-18
Spend per resident Queensland
Spend per resident (excluding intrastate) $3,870
Visitors per resident $2,459
Visitors per resident (excluding intrastate) 5.0
1.9
New South Wales
Northern Territory
$3,364
$6,907
$2,188
$5,775
4.7
6.9
2.0
4.5
Australian Capital
Western Territory
Australia
$4,405
$2,934
$4,402
$1,451
7.0
4.3
7.0
0.9
South Australia Victoria
$2,478 $2,985
$1,664 Tasmania $2,134
4.0 $4,526 5.9 4.3
1.7 $3,704 3.1 1.7
Source: Tourism Research Australia and the Australian Bureau of Statistics9
The Territory has a significantly higher visitation per resident and spend per resident compared to other states. This remains
the case even excluding intrastate travel, highlighting the importance of interstate and international tourism spending.
9
Australian Bureau of Statistics, Australian Demographic Statistics, June 2018, cat. no. 3101.0 (20 December 2018).
12 Northern Territory’s Tourism Industry Strategy 2030 Report3.2 For the Northern Territory economy
The tourism industry is important to the Northern Territory’s economy. In 2017-18, tourism accounted for 9.5 per cent of the
Territory’s economy, a higher proportion than any other jurisdiction with the exception of Tasmania. The tourism industry
was worth $2.2 billion in gross value added, including $1.0 billion in direct contribution and a further $1.2 billion in indirect
contribution. The tourism industry accounted for the employment of 17,100 persons in the Territory, directly and indirectly.10
The direct contribution reflects the ‘contribution generated by transactions between visitors and producers for a good or
service that involves a direct physical or economic relationship. The indirect contribution of tourism relates to flow-on effects
created by the demand for inputs from industries supplying goods and services to tourists.11 Every dollar spent in the industry
creates additional value elsewhere in the economy: each tourism dollar accounts for 33 cents in direct value added, and the
same amount again in indirect value added.12
While the tourism industry is important to the Northern Territory as a whole, it is also important to regional areas. Tourism
accounts for 28 per cent of employment in Lasseter (the region surrounding Uluru-Kata Tjuta) and 14 per cent in Kakadu
Arnhem, for example.
Figure 3.2: Tourism employment and total tourism gross value added, by tourism region, 2016-17
Darwin Kakadu Arnhem
Tourism employment 6,435 persons (5%) Tourism employment 1,636 persons (14%)
Tourism GVA: $831 million (3%) Tourism GVA: $128 million (4%)
Katherine Daly
Tourism employment 1,354 persons (10%)
MacDonnell Tourism GVA: $131 million (5%)
Tourism employment 207 persons (4%)
Tourism GVA: $21 million (1%)
Barkly
Tourism employment 274 persons (7%)
Tourism GVA: $43 million (8%)
Alice Springs
Tourism employment 2,275 persons (10%) Lasseter
Tourism GVA: $280 million (9%) Tourism employment 433 persons (28%)
Tourism GVA: $169 million (100%)
Source: Tourism Research Australia13
10
Tourism Research Australia, State Tourism Satellite Account: Northern Territory 2017-18 (2019) .
11
Ibid.
12
Ibid.
13
Ibid.
Northern Territory’s Tourism Industry Strategy 2030 Report 134 Foundations of the strategy
4.1 Building on the Northern Territory’s strengths
Tourism is a critical sector for the Northern Territory’s economy, driving activity and growth across the region. The
uniqueness of the Northern Territory and its comparative advantages provide significant potential for the industry.
The Northern Territory is culturally rich: a quarter of the Territory’s population are Aboriginal Australians, compared to the national
average of three per cent.14 Research has found that the Territory is viewed as the best location in Australia to authentically
experience Aboriginal cultures.15
Tourism Australia’s Consumer Demand Project found that world class nature and wildlife are growing in importance as factors in
travel decisions.16 The Northern Territory is home to rare species of flora, native wildlife and birds. These offerings distinguish the
Territory from other Australian locations, and particularly Uluru-Kata Tjuta and Kakadu National Parks, which have a longstanding
reputation with international and domestic visitors. Findings from the market-led Consumer Demand Project have been overlaid
against regional strengths as identified by the tourism industry in Figure 4.1, to provide an insight into areas of opportunity for
Territory tourism.
Figure 4.1: Strengths of the Northern Territory’s regions, as identified in forums
Aboriginal culture Proximity to Asia Natural landscape
Multicultural society Military history Lifestyle and wellness
Flora and fauna Oldest living culture World heritage
Undiscovered Tropical weather Adventure
Coast and rivers Outback Sophistication Spiritual heart
Source: Deloitte Access Economics
Australia’s tourism industry is expected to continue along its path of strong growth, with the Australian dollar forecast to remain
low against the US dollar over the medium term, even as a greater level of uncertainty clouds the Australian and global economic
outlook.17 In the coming decades, around two billion people in Asia will join the middle class,18 while the number of Chinese citizens
holding passports is predicted to grow from 120 million today to 240 million by 2020.19 As people become wealthier, they are more
likely to spend more on discretionary goods such as entertainment or tourism. Provided aviation links are suitable, this places the
Territory, as the closest Australian neighbour, in a position to capitalise on an increasing pool of global travellers, and particularly
emerging Asian markets.
14
Australian Bureau of Statistics, Census of Population and Housing: QuickStats, Australia, 2016, cat. 2061.0 (27 June 2017).
15
Instinct and Reason, National demand for cultural tourism in Australia (report commissioned by Tourism NT, 2017) .
16
Tourism Australia, Consumer Demand Project 2017: NT Report (2017).
17
Deloitte, Tourism and hotel market outlook – Edition 1, 2019 (2019) .
18
Homi Kharas, The unprecedented expansion of the global middle class (28 February 2018) Brookings Institute .
19
David Ramli and Jackie Simmons, ‘Ctrip Sees Surge in New Chinese Passports Spurring Tourism Boom’, Bloomberg (online), 25 January 2018
.
14 Northern Territory’s Tourism Industry Strategy 2030 Report4.2 Current and future industry context
A number of factors will shape the tourism landscape over the life of the strategy, and therefore the considerations which
need to be taken into account in developing the NT’s Tourism Industry Strategy 2030.
Competition for tourists is growing both globally and nationally. The United Nations’ World Tourism Organization reported
that 1.3 billion international visitors travelled in 2017, with arrivals expected to reach 1.8 billion by 2030.20 While the number
of travellers is increasing, as is the competition – with many countries and regions recognising the importance of tourism
for economic prosperity, and implementing strategies to increase their competitiveness and appeal. The Northern Territory
will need to continue to differentiate its product, lift the quality of its products and experiences, and target its marketing to
reach a growing pool of tourists: a pool which is open to choosing more locations than ever before.
Technology has changed how consumers plan, travel and consume goods and services. Digital technologies such as virtual
reality will influence destination marketing, while big data applications will continue to provide customer insights and provide
new tools to businesses and governments alike. The sharing economy – including Airbnb and Uber, but also other platforms
– must be considered in planning as its reach increases. It is crucial that technology is not only accounted for in actions under
the NT’s Tourism Industry Strategy 2030, but that all travellers and tourism businesses are connected online to meet customer
expectations and enable businesses to deliver quality products – as social media continues to be a central marketing tool.
This is particularly important in the Northern Territory, as multiple regions have limited internet and/or phone connections,
restricting tourism operators and their ability to effectively and efficiently function.
The aviation sector is changing globally, with airlines redesigning routes to optimise capacity and efficiency. Aviation access
has always played a vital link in the Northern Territory; Darwin International Airport has forecast passenger movements to
Darwin to almost triple by 2037.21 As aircraft technology improves, more destinations become accessible using narrow-body
aircraft, opening up the region to tourists from new Asian destinations.
Climate change is likely to impact travel and economies in the long term. The impacts of climate change in the Northern
Territory – including a warmer climate and more extreme events22 – could affect consumer travel behaviour, either acting as
a deterrent, or affecting the customer experience while on holiday. It is important that future decision-making takes climate
change into account, addressing its potential effects on the tourism industry.
In addition to trends affecting the tourism industry globally, there are factors influencing tourism specific to the Northern
Territory.
Its demand profile is continuing to shift, as major projects have driven increased travel, resulting in significant changes to the
mix of visitors and large contractions in the level of activity after projects conclude. This highlights the need to shift the Northern
Territory’s focus back to the holiday market. However, consultations revealed that Darwin is sometimes perceived as a stopover
destination on the way to other parts of the Northern Territory, while negative perceptions around the Territory’s value
proposition compared to its cost place barriers on travel for both domestic and international holidaymakers.23
Physical access to the Northern Territory also remains a challenge. The Northern Territory’s small population means that there is
a smaller base of travellers to support outbound aviation services.
20
World Tourism Organisation, UNWTO Tourism Highlights 2018 Edition (2018) .
21
Darwin International Airport, Master Plan (6 September 2017) .
22
CSIRO, Climate change in Australia’s Top End (2014) .
23
Tourism Australia, Consumer Demand Project 2017: NT Report (2017); Tourism Research Australia, Driving dispersal of international visitors
to South Australia and Northern Territory (2014) .
Northern Territory’s Tourism Industry Strategy 2030 Report 15International visitors consider that the long flights and expansive geography of the Territory make it a difficult location for
travellers.24 Some Australian cities have a limited number of direct flights to the Territory, creating constraints for domestic
holidaymakers. Airlines continually review routes, presenting both opportunities and challenges for the Northern Territory;
as a result, it is crucial to build demand for air services between destinations. Challenges with physical access also extend to
roads: the quality of road infrastructure across the Top End means that certain areas are only accessible during the winter season,
limiting opportunities to attract visitors in the off-peak, while industry reported that unsealed or ageing roads pose barriers in
promoting drive holidays or routes.
Also affecting demand for holiday travel is seasonality, with a significant gap between the number of visitors in the winter and
summer months. Seasonality is a particular challenge in the Top End, especially where infrastructure (e.g. in Kakadu or across
Arnhem Land) do not allow for passage during the summer months. Seasonality also affects employment, with industry citing
high employee turnover and the inability of businesses to retain skilled staff throughout the off-peak season as challenges.
Operators in certain regions struggle to attract local staff and are therefore required to hire from interstate and overseas;
however, employees sometimes leave soon after arriving, meaning that employers are constantly re-training and re-hiring
staff.
The Territory’s unique approach to land tenure through the Aboriginal Land Rights (Northern Territory) Act 1976 (ALRA)
provides Traditional Owners with control over developments on their land. A current challenge regarding land tenure relates to
the town of Jabiru, where the mining lease is due to expire in 2021, creating a lack of certainty for potential investors. While some
years away, consultees reported similar challenges in Nhulunbuy, where leases are due to expire in 2053. While acknowledging the
importance of consultation with Traditional Owners and their sovereignty over their land, industry also noted difficulties with
investing and developing new experiences on Aboriginal land, due to the time and requirements for section 19 leases under
ALRA.
4.3 Implications for the strategy
The NT’s Tourism Industry Strategy 2030 sets out priorities and actions for the tourism industry for the next decade. The
strategic framework itself must take into account current trends and forecasts, but must also be adaptable to changing
conditions. While the factors outlined in this chapter set the foundations of the NT’s Tourism Industry Strategy 2030, it will be
important to revisit these over time.
Given the significance of the tourism industry in the Northern Territory, its increasing importance to both the local and Australian
economies, and continued worldwide growth in visitation, it is crucial that industry and government work together to support the
sustainable growth of the sector. The NT’s Tourism Industry Strategy 2030 sets out the blueprint for continued collaboration and
actions to materially contribute to the next phase of the tourism industry’s development in the Northern Territory.
Civic Park, Darwin Festival.
24
Ibid.
16 Northern Territory’s Tourism Industry Strategy 2030 Report5 NT’s Tourism Industry
Strategy 2030
5.1 Strategic framework
The NT’s Tourism Industry Strategy 2030 strategic framework is designed to unite efforts across the public and private sectors,
with priority objectives and actions targeted towards shifting the current performance of the tourism sector in the Northern
Territory to one of sustainable growth. The strategic framework reflects perspectives shared during consultations, and was
confirmed in collaboration with both industry and government.
The strategic framework incorporates six priority objectives that, if delivered, will make a material impact on the trajectory of
tourism in the Northern Territory, and four pillars which underpin the framework. Within each priority objective are specific
actions to achieve identified goals in the short, medium and long term, while the pillars reinforce the actions identified
within key priorities to underpin the strategy’s success. These priority objectives, actions and pillars are described over the
subsequent sections in the strategy.
Figure 5.1: NT’s Tourism Industry Strategy 2030 strategic framework
NT’s Tourism Industry 2030 Strategic Framework
Key priority Key priority
Grow investment in Strengthen and showcase
the Northern Territory’s the Northern Territory’s
remarkable assets, distinctive Aboriginal
product and regions cultural tourism
experiences
Marketing
Industry
Pillars development
Key priority that underpin Key priority
the strategic
Increase Through strategic
framework
recognition of marketing
the value of activities grow
tourism to Collaboration the value of the
the Northern across industry holiday market
Territory and government in the Northern
Territory
Workforce
development
Key priority Key priority
Develop ongoing Leverage and
access to and within build events to
the Northern Territory drive visitation
Core considerations that have informed the strategy include building industry capability, defining roles and responsibilities
across the public, not-for-profit and private sectors, and driving investment in tourism product and infrastructure to highlight the
Northern Territory’s unique value propositions.
Reflecting the perspectives and insights of industry and the need for more sustainable and profitable businesses, the strategy also
aims to step away from a seasonal mindset: actions are geared towards extending the Territory’s peak tourism season, or mitigating
seasonal impacts in their entirety.
Delivering the priorities under the NT’s Tourism Industry Strategy 2030 will require action from both industry and governments.
Collaboration across and within industry and government will be crucial to the strategy’s success. Specific actions outline
responsibilities across industry and local, Territory and Australian governments, as well as other partners including Land Councils.
Northern Territory’s Tourism Industry Strategy 2030 Report 17The overarching responsibility for coordinating the implementation, reporting and regular review of the strategy will lie with the
Department of Tourism, Sport and Culture; however, industry will play a core role in these activities, with Tourism Top End and
Tourism Central Australia supporting industry in taking action to meet the strategy’s objectives.
5.2 Priority objectives
5.2.1 Priority: Grow investment in the Northern Territory’s remarkable assets, product and regions
Investment into key attractions and regions can drive holiday visitation to the Northern Territory. Core to
the NT’s Tourism Industry Strategy 2030 is targeted investment by government and the private sector in the
Northern Territory’s remarkable product and regions – which has the capacity to drive significant increases
in visitation – thereby supporting further investment in the surrounding regions and complementary
experiences, spreading the benefits of a growing tourism sector more broadly.
Darwin is home to a world-class convention centre, a casino, numerous attractions and cruise terminal
facilities, and is the gateway to the Top End, including popular parks such as Kakadu and Litchfield. At
the heart of the Northern Territory is the world famous icon, Uluru, while Alice Springs will be home to
Australia’s National Aboriginal Art Gallery and Cultural Centre.
The strategy’s focus in the short term is to set the foundation for these targeted investments. In the
medium and longer term, the emphasis shifts to shaping and ensuring these critical investments are
delivered and that further related opportunities are identified and supported.
Why is this a priority?
5% annual increase in visitation
to Uluru over the past five years,
following capital upgrades worth $90
million at Ayers Rock Resort. 25
2019-2020 2021-2025 2026-2030
Short term Medium term Long term
GOALS
Set the foundations Secure investment in remarkable Deliver investment in remarkable
for investment assets, product and regions assets, product and regions
Streamline and enhance the investor journey through collaboration between Land Councils, Traditional Owners,
governments and investors
Develop destination Identify priority segments for the Renew destination management
management plans Northern Territory plans as required
ACTIONS
Deliver new experiences and product as required in destination
management plans
Develop an annual priority
Deliver identified priority infrastructure projects
project listing
Develop and implement a facilitated investment process for priority projects (government and private led projects)
OUTCOMES PARTNERS
Department of Trade, Business & Innovation, NT Land Councils, Tourism NT, Australian Government,
DELIVERY
Regional Tourism Organisations and Tourism Industry
Increased visitation and Increased private sector Increased visitor satisfaction
expenditure in all Northern investment in all Northern with Northern Territory
Territory tourism regions Territory tourism regions tourism experiences
25
Indigenous Land Corporation, Submission 66 to Joint Standing Committee on Northern Australia, Inquiry into Opportunities and Methods for
Stimulating the Tourism Industry in Northern Australia, 23 July 2017.
18 Northern Territory’s Tourism Industry Strategy 2030 ReportStreamline and enhance the investor journey through collaboration between Land Councils, Traditional Owners,
governments and investors
There are a number of steps between the initial idea and reality for any investment, whether in the tourism industry or
elsewhere. In the Northern Territory, one of the key stages in the investor journey is seeking approval from Traditional
Owners under the Aboriginal Land Rights (Northern Territory) Act 1976 (ALRA) for developments on Aboriginal land. It is
important to consult with Traditional Owners and Land Councils not only to satisfy the Act, but out of respect for Traditional
Owners and their sovereignty over their land.
Industry reported challenges in investing and developing new experiences on Aboriginal land due to the time and
requirements under section 19 of ALRA, with some developments not proceeding at all, or taking many years to do so. This
highlights the need to consider how the process can be streamlined and enhanced, while maintaining the importance of
working with and obtaining approval from Traditional Owners.
What is the next step?
• Consult with and support traditional owners and land councils to better access Aboriginal Land for tourism activities.
Develop and renew destination management plans
Destination management plans are strategic documents which review a destination’s key strengths and assets, and provide
recommendations as to opportunities, gaps and potential investments in order to meet visitor demand. For example, a
destination management plan may identify required product and infrastructure, distinguish a destination’s priority segments,
or establish a timeline for strategic action.
Destination management plans are already in place across many of Australia’s key tourism destinations, including in regional
areas. Their development in the Northern Territory’s destinations is crucial to guide future activities at a regional level, and
to encourage dispersal across the Territory by providing compelling reasons to visit different regions within the Territory.
Plans can also address seasonality seen across much of the Top End, identifying potential tourism product and required
infrastructure to mitigate seasonal visitation. Regional tourism associations (RTOs) will be key partners in developing and
implementing destination management plans.
Regular renewal of destination management plans is also important such that the Northern Territory’s destinations are
regularly assessing how to adapt to and respond to the competitive landscape and changing consumer preferences.
How will destination management plans be developed and implemented?
• DTSC to develop destination management plans progressively for key regions, in consultation with RTOs, local
councils, industry and the community.
• Destination management plans to identify responsibilities for different actions, although DTSC maintains overall
responsibility for the plan.
• Destination management plans to be renewed every three to five years as required.
In particular, destination management plans will:
• Identify investment-ready opportunities across regions, including new experiences and products to be delivered by
the private sector, and core infrastructure to be delivered by the public sector.
• Identify priority segments for the regions.
Identify priority segments for the Northern Territory
Another core outcome of destination management plans is the opportunity to identify relevant priority segments at a
regional level – sectors which could be aggregated and also considered at a Northern Territory level. Presently, DTSC pursues
a number of segments, with resources spread too thinly to make an impact. The development of destination management
plans will refocus efforts on the Northern Territory’s strengths, enabling both individual regions and the Northern Territory
as a whole to attract more visitors in priority segments.
Which priority segments were identified as potential areas of focus in consultation?
• heritage tourism (military and pioneering)
• youth tourism (international study tours and domestic edu-tourism)
• adventure and outdoors (fishing, birdwatching, mountain biking, hiking and 4WDing)
• food and drink
• agri-tourism.
Northern Territory’s Tourism Industry Strategy 2030 Report 19Deliver new experiences and products as required in destination management plans
Destination management plans not only guide government activities in a tourism region, but also those of the private sector.
They will identify the new experiences, infrastructure and tourism products which require involvement and investment by
businesses. The destination management plans will help identify areas where greater collaboration is needed in the regions.
While larger investments may be supported by a whole-of-government approach (e.g. where government assists with
negotiating leases under ALRA), equally important are smaller investments in product or the destination which make up the
visitor experience in a particular destination. These investments are needed to differentiate the Northern Territory, improve
the visitor experience and attract more visitors over time. There should also be a focus on engaging the local industry in
meeting demand for new tourism product and infrastructure, as well as international developers for larger investments.
What is the role of industry in upgrading or developing products and experiences for tourists?
• Participate in the development of destination management plans for the regions in which you operate.
• Engage with the final destination management plan to help guide any investment decisions, together with other
relevant information.
• Access the available government support when considering an upgrade or developing new products for tourists.
DTSC will assist businesses by delivering a Business Enterprise Program that educates and supports the tourism industry
to develop, grow and deliver a world class visitor experience. DTSC will work with its stakeholders such as the Department
of Trade, Business and Innovation (DTBI), Hospitality NT and the RTOs to support tourism businesses across the Northern
Territory.
Develop an annual priority project listing
While destination management plans will identify key investments required in different regions, it will be crucial for some to
be delivered within a certain timeframe to meet urgent needs in the region. DTSC will develop a list of priority projects on an
annual basis, based on those projects noted in destination management plans, consultation with RTOs, and submissions from
proponents.
What might be the criteria for annual priority projects?
• Attractions or experiences which will materially drive visitation in a region.
• Core infrastructure projects which meet an identified need in a region.
• Projects which are subject to a certain timeframe.
Develop and implement a facilitated investment process for priority projects (government and private sector led
projects)
To expedite the realisation of priority projects, the Northern Territory Government will adopt a whole-of-government
approach to make those opportunities investment-ready. This facilitated investment process may include processing relevant
planning approvals, obtaining a section 19 lease, or approving other licences as necessary, in a thorough but time-sensitive
manner. DTSC will design and coordinate the facilitated investment process, together with input from other relevant
agencies and departments which are involved with tourism priority projects.
For projects which do not yet have a proponent, DTSC and DTBI can jointly seek potential developers and investors (both
locally and internationally) for priority projects, and that are attractive from an investment perspective.
What are the potential benefits of the facilitated investment process?
• Increased recognition of the importance of priority tourism projects in a region.
• Coordinated responses from government departments and agencies, and increased collaboration between
departments and agencies, in relation to the project.
• Increased responsiveness or timeliness in terms of necessary government approvals, as appropriate.
20 Northern Territory’s Tourism Industry Strategy 2030 ReportYou can also read