Towards an Integrated System for Urban Greenhouse Gas Monitoring and Assessment - Jocelyn Turnbull - Microsoft
←
→
Page content transcription
If your browser does not render page correctly, please read the page content below
Towards an Integrated System for Urban
Greenhouse Gas Monitoring and Assessment

                  Jocelyn Turnbull
             GNS Science, New Zealand
           and University of Colorado, USA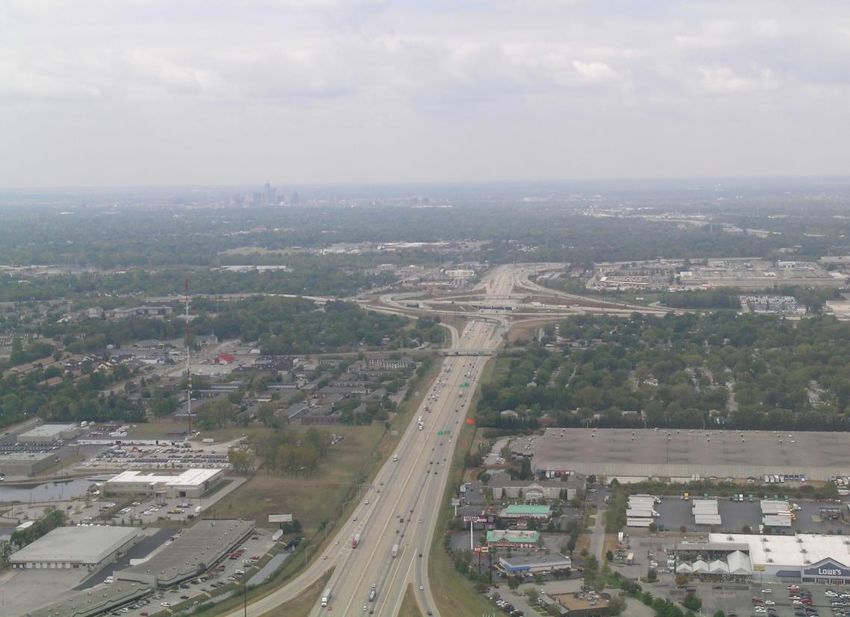
Outline

                     Methodologies for evaluating urban
                        greenhouse gas emissions

                  INFLUX long-running GHG “urban testbed”
                                since 2010

                      Integrating urban greenhouse gas
                              science with policy

                       IG3IS and emissions reporting

                        Example from CarbonWatch,
                          Auckland, New Zealand
CarbonWatch-NZ
Methods for evaluating urban
 greenhouse gas emissions
Bottom-up anthropogenic CO2 emissions
          Hestia data product

                                 Hestia Indianapolis

  Anthropogenic CO2 emissions from multiple sources for whole city
          Disaggregated in space, time and source sector

                                                               Gurney et al., 2012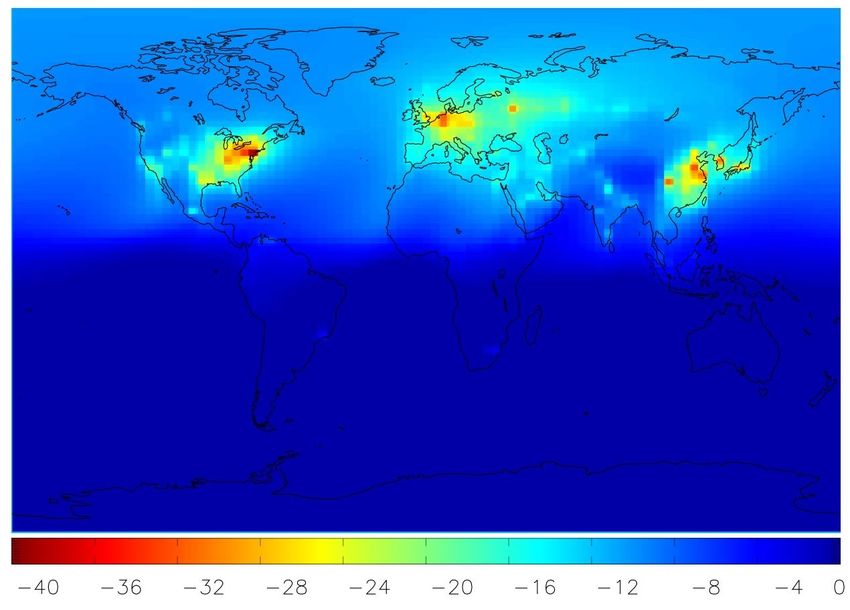
Urban mass balance from aircraft measurements
                                             Wind
                        Layer                                         Downwind
                        depth                                           CO2

                        Background CO2
                                                emissions

             Measured transects                             Fill in the gaps

     Many cities can be measured using a single aircraft/instrument
          Whole city flux determined – not spatially resolved
                                                            Heimburger et al., 2017
Urban mass balance from aircraft measurements

                                                               Emission rate (mol/s)

                                            CO winter 2014          108 ± 16%

                                            CO2 winter 2014        14,600 ± 17%

Reduced uncertainties for whole city emissions by averaging over multiple flights

                   Obtain flux estimates for both CO and CO2
                                                              Heimburger et al., 2017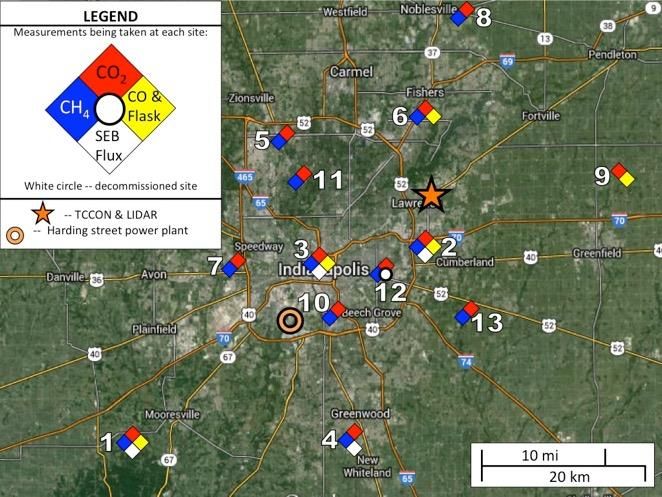
Top-down urban atmospheric inversion driven
          by tower observations

                   12 towers measuring in situ CO2 (and
                   CO/CH4 and multi-species from flasks)

                                Lauvaux et al., 2016; Miles et al., 2017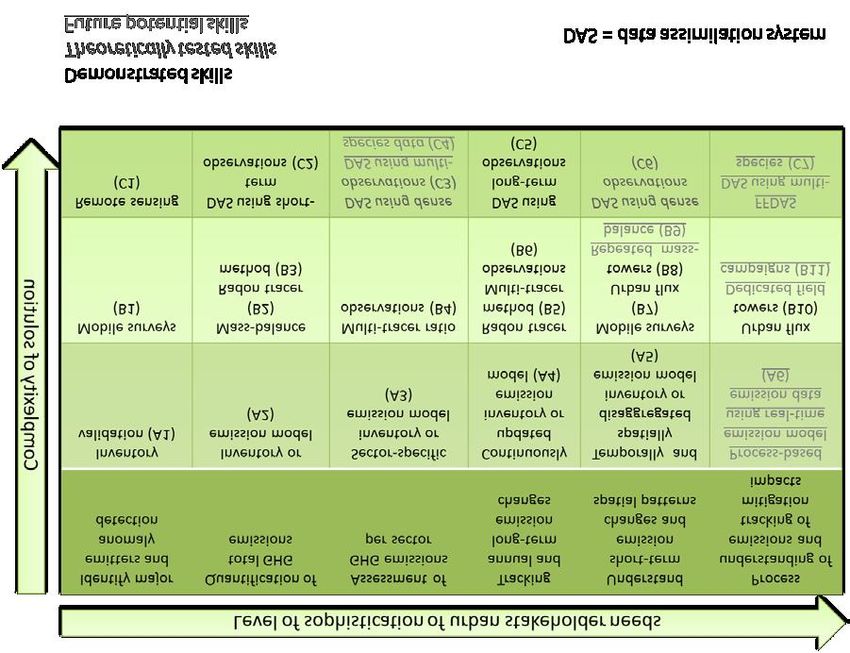
Network design: “footprints”

           Height, topography and winds determine
           the “footprint” for each measurement site

           Want enough sites and the right locations to
           “see” an entire city

           Locate on tall towers/buildings to obtain
           largest footprint with least sites
Top-down urban atmospheric inversion driven
          by tower observations
Comparison of previously reported Indianapolis
    whole city CO2 fluxes for wintertime
               25,000
                                        22400
                                                                      Gurney et al, 2012
               20,000                                                 Lauvaux et al, 2016
                          18300
                                                                     Heimburger et al, 2017
               15,000                                  14600
Flux (mol/s)

                                                                     Mean flux 18,400 mol/s
               10,000                                                        ± 20%

                                                                   Range 40% between highest
                5,000                                                 and lowest estimate

                   0
                           Hestia       Inversion   Mass balance
                        Sep12-Apr13   Sep12-Apr13    Nov-Dec14
But we are not comparing apples with apples…
Time period Time of day Species Domain Includes
measured rural
bkgd?
Hestia Sept 2012 - All CO2ff + Full Yes
Bottom-up Apr 2013 bioethanol domain
Inversion/ Sept 2012 - All (only mid- Total CO2 Full Yes
tower CO2 Apr 2013 afternoon tower domain
data used)
Aircraft mass Nov – Dec Mid-afternoon Total CO2 Aircraft No
balance 2014 footprintWe can compare apples with apples…
Time Time of day Species Domain Includes
period measured rural
bkgd?
Hestia Sept 2012 - All CO2ff + Full domain Yes
Bottom-up Apr 2013 Mid-afternoon bioethanol Aircraft
Nov 2014 CO2ff footprint
Inversion/ Sept 2012 - All Total CO2 Full domain Yes
tower CO2 Apr 2013 Mid-afternoon CO2ff Aircraft
Nov 2014 footprint
CO2-based Nov – Dec Mid-afternoon Total CO2 Aircraft No
Aircraft mass 2014 CO2ff footprint Added
balance
CO-based Nov – Dec Mid-afternoon CO → Aircraft Added
aircraft mass 2014 CO2ff footprint
balanceThe Carbon Cycle
~800 GtC in the form of CO2
~400 ppm CO2
~90 GtC/yr 10 GtC/yr
~60 GtC/yr
Cannot distinguish between natural and fossil CO2 from
CO2 measurements aloneRadiocarbon (14C) dating
14C is produced naturally in the atmosphere, and moves throughout the carbon cycle
Natural radioactive decay removes 14C from buried/dead objects
Half-life 5,730 years
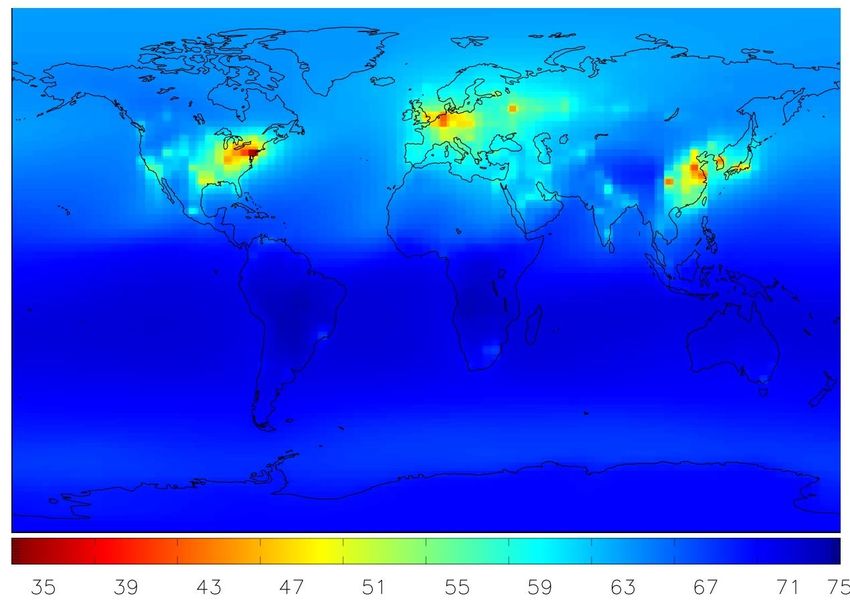
Fossil fuels are entirely devoid of 14CModelled global surface distribution of 14C in CO2
0 1.5 3 4.5 6 7.5 9 10.5 12 13.5 15
Δ14CO2 (‰) CO2ff (ppm)
Fossil fuel CO2 emission pattern very strongly reflected in Northern Hemisphere Δ14CO2
Turnbull et al., 2009
LMDZ model 2002-2007 surface Δ14CO2Flask-based estimates of total CO2 and CO2ff
Indianapolis in winter
CO2obs(Dobs - Dbg)
CO2ff = CO2xs = CO2obs - CO2bg COxs = COobs - CObg
(Dff - Dbg)
Determine enhancements relative to upwind background Tower One
Consistent enhancements in anthropogenic species at downwind towersFlask-based emission ratios
Summer
Winter Nov-Apr
COxs (ppb)
CO2xs (ppm)
CO2tot:CO2ff CO:CO2ff
1.1 ± 0.1 7±2
ppm/ppm ppb/ppm
CO2ff (ppm) CO2ff (ppm)
Determine how much of the CO2 comes CO co-emitted with CO2ff at variable
from fossil fuels and how much from other rate depending on combustion
sources (plant photosynthesis/respiration, conditions - derive ratio empirically from
human/pet respiration, biomass burning) observations
~10% contribution of non-CO2ff to CO2 in Can then use high resolution CO
winter observations to determine CO2ff
Turnbull et al., 2015Apples-to-apples Indianapolis CO2ff flux
comparison
25,000
Flux (mol/s) 20,000
15,000
10,000
5,000
20500 18200 17700 19800
0
Hestia Inversion posterior CO2-based mass CO-based mass
balance balance
Whole city flux 19,100 mols/s ± 7%
Quantified uncertainty on whole city flux
Agreement is sufficient to evaluate ~10% changes in urban emissions
Turnbull et al., 2018Urban greenhouse gas science to meet policy
needsWorld Meteorological Organisation: Integrated
Global Greenhouse Gas Information System
WMO’s IG3IS program links greenhouse
gas measurement scientists with
policymakers and other stakeholders
NIST, CO2-USA, ICOS all working on
similar initiatives
IG3IS exemplar programs:
CarbonWatch NZ – integration of CO2
observations and policy at national and urban
scales
UK, Australia, Switzerland –atmospheric
observations of methane and halogenated
gasses to improve national inventory reporting
to UNFCCC
Environmental Defense Fund – oil and gas
methane emissions detection and quantificationGreenhouse gas information in emissions
reporting
IPCC Taskforce on national Greenhouse Gas Inventories:
National Inventory Reporting for UNFCCC/Paris Agreement
2019 Refinement expands the role of atmospheric observations in national emissions
reporting
Global Protocol for Community-Scale Greenhouse Gas Emission Inventories (GPC)
and similar for urban scale emission reporting
Atmospheric observations and modelling can improve emissions estimatesAtmospheric observations in emissions reporting
Air conditioning gas HFC-134a in the UK
Revised
Initial inventory
inventory
Atmospheric obs
based estimates
Inventory re-investigated and revised based on atmospheric observationsIG3IS Good Practice Guidelines For Urban
Greenhouse Gas Monitoring and Assessment
• Currently being drafted for release in late 2020
• First iteration is aimed at the scientific research community
• Future plan to transition these guidelines into documentary standards for
Fig. 3.1: Tiers of sophistication of the measurement and modelling systems and
practitioners and commercial
stakeholderenterprises
questions that can be addressed for a given combination.
Case studies on user needs
For more than 30 years, the trend in the fossil fuel CO2 (ffCO2) concentration has
been monitored in Heidelberg, Germany by the Institute of Environmental Physics ofScience to meet policy needs
Example from Auckland, New Zealand
Estimate urban biogenic fluxes
• Currently almost entirely unknown
• Will the Million Tree Initiative reduce Auckland’s net
emissions?
NZ Ministry for the Environment
NZ Climate Change Commission
• Develop urban biosphere flux estimates to include in national
GHG reporting
• What are the climate impacts of replanting parklands with
native forest?
Auckland
Council
Improve traffic fossil fuel flux estimates
• How might planning decisions change traffic emissions?
• New fuel tax in Auckland in 2018 – did emissions change?
Long term goal is to provide detailed full carbon budget for
Auckland
Indigenous groups
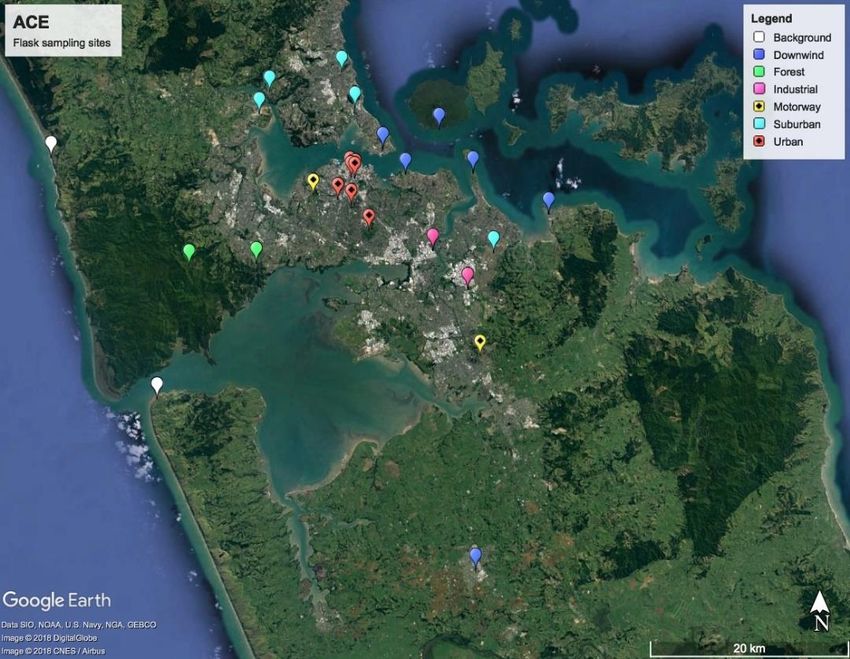
Ngāti Whātua ŌrākeiDiagnosing the biogenic CO2 contribution: flask
sampling campaigns
Wind
direction
grab flask samples from ~26 sites
four times/year
CO2, CO, CH4, 14CO2Auckland flask results
CO2
D14CO2
CO
Wind
directionAuckland flask results
CO2xs CO2obs (Dobs - Dbg)
CO2ffff=
CO -β
CO2obs-CO2bg 2 Dff - Dbg
COxs CO2bio
COobs-CObg CO2xs-CO2ff
Clear enhancements in CO2ff and COxs at urban sites
CO2xs and CO2bio are variable
No obvious seasonalityCO2ff Auckland flask
measurements
No pattern in CO2ff by time of day
Clear but variable afternoon drawdown in CO2bio
Expect daily cycle of photosynthetic CO2 removal
during the daylight hours, and respiration CO2 source
CO2bio at night
For this daytime dataset, net biogenic uptake removes
~40% of fossil fuel CO2 emissions (does not account
for nighttime when photosynthetic uptake does not
occur)
Ratio CO2bio:CO2ff
Forest
Suburban
Industrial
Median CO2bio:CO2ff = -0.4 Downwind
Urban
MotorwayConclusions and outlook
Wean quantify urban CO2 emissions to better than 10% using multiple
methods:
Inventory-based methods - Atmospheric inversion with tower observations -
Aircraft-based mass balance
CO2 source sectors can be separated:
fossil fuel vs biogenic CO2 – other tracers can separate traffic, power plants,
industry, etc
Uptake into policy requires interaction with policymakers and refocusing
research to meet their goals
Contact: Jocelyn Turnbull j.turnbull@gns.cri.nzYou can also read