Towards Animal-Free Neurotoxicity Screening: Applicability of hiPSC-Derived Neuronal Models for In Vitro Seizure Liability Assessment - Axion ...
←
→
Page content transcription
If your browser does not render page correctly, please read the page content below
Research Article
Towards Animal-Free Neurotoxicity Screening:
Applicability of hiPSC-Derived Neuronal
Models for In Vitro Seizure Liability Assessment
Anke M. Tukker, Regina G. D. M. van Kleef, Fiona M. J. Wijnolts, Aart de Groot and Remco H. S. Westerink
Neurotoxicology Research Group, Toxicology Division, Institute for Risk Assessment Sciences (IRAS), Faculty of Veterinary Medicine, Utrecht University,
Utrecht, The Netherlands

      Abstract
      A sizeable proportion of drug attrition is due to drug-induced seizures. Currently available animal models frequently fail
      to predict human seizure liability. Therefore, there is a need for in vitro alternatives, preferably based on human-derived
      neurons, to circumvent interspecies translation. The increasing number of commercially available human induced plurip-
      otent stem cell (hiPSC)-derived neuronal models holds great promise for replacing rodent primary cultures. We therefore
      tested three different hiPSC-derived neuronal models for their applicability for in vitro seizure liability assessment.
      Using immunofluorescent staining and multi-well micro-electrode arrays, we show that all models develop functional
      neuronal networks that exhibit spontaneous activity and (network) bursting behavior. Development of activity patterns
      differed between the models, probably due to differences in model composition and seeding density. Neuronal activity
      and (network) bursting was reproducibly modulated with the seizurogenic compounds strychnine, picrotoxin (PTX) and
      4-aminopyridine (4-AP). However, the sensitivity and degree of chemical-induced effects differed between the models,
      which can likely be explained by differences in seeding density, maturation and different ratios of inhibitory and excit-
      atory cell types. Importantly, compared to rat primary cortical neurons, the hiPSC-derived neuronal models were equally,
      or even better in the case of 4-AP, suited to detect seizurogenicity. Overall, our data indicate that hiPSC-derived neuronal
      models may be used as a first screening tool for in vitro seizure liability assessment. However, before hiPSC-derived neu-
      ronal models can fully replace animal experiments, more compounds should be tested and the available models must be
      further characterized to fully understand their applicability.

1 Introduction                                                               is amongst the most commonly encountered CNS-related prob-
                                                                             lems during pre-clinical drug development (Authier et al., 2016).
Drug development and safety testing are often done using in                  Drug-induced seizures can be life-threatening and are classified
vivo and ex vivo experiments. These experiments are, however,                as severe adverse drug reactions. It is therefore of utmost im-
not fully predictive of adverse effects in humans. While human               portance that (increased) seizure liability can be detected early
drug approval rates have been increasing in recent years, only               during drug development.
10.4% of drugs in phase I of drug development will ultimately                   Since animal models frequently fail in human seizure liability
gain final approval (Hay et al., 2014). Most drugs fail the trajec-          predictions, their usefulness is debated (Little et al., 2019). Conse-
tory, often due to safety concerns related to the central nervous            quently, in vitro alternatives are required to reduce the number of
system (CNS). Even when compounds reach the market, drug at-                 animal tests and to improve safety screening. However, in vitro sei-
trition as a result of neurotoxicity and CNS problems remains a              zure liability testing is challenging because the CNS contains many
challenging concern (Onakpoya et al., 2016). An increased risk               different cell types with a diverse range of drug targets that can all
of seizures, i.e., periods of abnormal, rhythmic and uncontrolled            have effects on brain function and excitability (Easter et al., 2009).
hyper-excitability of neurons characterized by hyper-synchronic-             In vitro models for seizure liability screening should thus ideally
ity of electrical activity (Easter et al., 2009; Jiruska et al., 2013),      model the in vivo brain as closely as possible (Westerink, 2013).

Received July 12, 2019; Accepted October 28, 2019;                           This is an Open Access article distributed under the terms of the Creative Commons
Epub November 2, 2019; © The Authors, 2019.                                  Attribution 4.0 International license (http://creativecommons.org/licenses/by/4.0/),
                                                                             which permits unrestricted use, distribution and reproduction in any medium, provi-
ALTEX 37(1), 121-135. doi:10.14573/altex.1907121                             ded the original work is appropriately cited.
Correspondence: R.H.S. Westerink, PhD
Neurotoxicology Research Group, Toxicology Division
Institute for Risk Assessment Sciences (IRAS)
Faculty of Veterinary Medicine, Utrecht University
P.O. Box 80.177, 3508 TD Utrecht, The Netherlands
(r.westerink@uu.nl)

ALTEX 37(1), 2020                                                                                                                                           121
Tukker et al.

   The most commonly used ex vivo model for seizure liability           cells (Little et al., 2019). The introduction of commercially avail-
assessment in drug research is the brain slice assay (Authier et        able hiPSC-derived neurons can help to overcome these concerns
al., 2016). While the brain slice assay accurately mimics the in        as they are quality-controlled, can be purchased in large quantities
vivo organization of the brain (Grainger et al., 2018), including       (Anson et al., 2011; Little et al., 2019), and can be used for neu-
active and intact neuronal networks, the slices have a relative-        rotoxicity screening following a relatively short culture duration
ly short life-span (Buskila et al., 2015). More importantly, brain      (Tukker et al., 2018).
slices are of animal origin, and recordings require specific ex-           With the increasing availability of hiPSC-derived neurons,
pertise and equipment, and are labor-intensive, thereby limiting        there are also differences between the available models. Human
high-throughput screening (Grainger et al., 2018).                      neuronal models can differ, for example, in the ratio of excitato-
   The recent introduction of multiwell micro-electrode array           ry and inhibitory neurons as well as in the presence or absence of
(mwMEA) recordings eliminates some of these concerns. For               astrocytes. These factors greatly affect the (bursting) behavior of
this technique, cells are grown on a culture surface area with an       the hiPSC-derived model (Tukker et al., 2018). Also, variations in
integrated array of micro-electrodes, allowing non-invasive re-         the differentiation protocol as well as the level of maturation be-
cordings of extracellular local field potentials simultaneously at      fore freezing may affect the culture. This study aims to explore
different locations in the in vitro network (for review see John-       whether these models, despite their differences, are suitable for
stone et al., 2010). MEA recordings yield a broad range of data         animal-free seizure liability testing. To that aim, we cultured three
on parameters that describe the state of the network. Parameters        different commercially-available hiPSC-derived neuronal models
related to activity and synchronicity can be used to detect a hy-       to assess the development of spontaneous neuronal network activ-
per-active and/or hyper-synchronized state of the network that is       ity. Subsequently, these models were challenged with known sei-
linked to seizure-like events in the in vivo situation (Ishii et al.,   zurogenic compounds and the results were compared to data from
2017; Bradley et al., 2018).                                            rat primary cortical cultures, which were exposed in parallel.
   Many cell types can be grown on mwMEAs, but rat prima-
ry cortical cultures are the current gold standard (Authier et al.,
2016). Primary cortical cultures grown on mwMEAs possess                2 Animals, materials and methods
many characteristics of in vivo neurons, such as development of
spontaneous network activity including (network) bursting (Cot-         2.1 Animals
terill et al., 2016) and responsiveness to neurotransmitters, phar-     All experiments were conducted in accordance with Dutch law
macological agents, and toxicological modulation (Hogberg et            and were approved by the Ethical Committee for Animal Exper-
al., 2011; McConnell et al., 2012; Nicolas et al., 2014; Valdiv-        iments of Utrecht University. Animals were treated humanely,
ia et al., 2014; Hondebrink et al., 2016). Rodent cortical cultures     and all efforts were made to alleviate suffering. Primary cultures
grown on mwMEAs have been used for seizure liability assess-            of rat cortical neurons were prepared from postnatal day (PND)
ment with positive results as known seizurogenic compounds in-          0-1 pups of timed pregnant Wistar rat dams (Envigo, Horst, The
creased spiking, (network) bursting activity and/or synchronici-        Netherlands) as described in section 2.2.1.
ty (Bradley et al., 2018; Kreir et al., 2018; Fan et al., 2019). Al-
though the combination of mwMEA and rodent primary cultures
is promising, it is still based on primary animal cells.                2.2 Chemicals
   As also outlined in NC3Rs’ Crack-It Neuratect Challenge1, there      Neurobasal® -A medium, Dulbecco’s Modified Eagle Medium
is a clear need for new in vitro drug screening models that are able    (DMEM)-F12, fetal bovine serum (FBS), penicillin/streptomycin
to reliably detect seizures and can be used in a time and cost-ef-      (5000 U/mL (5000 µg/mL) for rat primary cortical culture me-
ficient manner. These models should preferably be of human or-          dia and 10.000 U/mL (10.000 µg/mL) for supplemented Brain-
igin to circumvent interspecies translation and reduce the num-         phys™ medium), B27 supplement, N2 supplement, L-gluta-
ber of animal experiments. Human induced pluripotent stem cell          mine, 4’,6-diamidino-2-phenylindole (DAPI), donkey anti-rab-
(hiPSC)-derived neurons are not associated with ethical concerns        bit Alexa Fluor® 488 and donkey anti-mouse Alexa Fluor® 594
like embryonic stem cells and animal experiments. It has been           were obtained from Life Technologies (Bleiswijk, The Nether-
shown that hiPSC-derived neurons can be cultured on mwMEAs              lands). Goat anti-chicken Alexa Fluor® 647 was obtained from
and exhibit spontaneous neuronal activity with (network) burst-         Jackson ImmunoResearch Europe (Ely, UK). Paraformaldehyde
ing behavior of mature neurons (Odawara et al., 2016; Paavilain-        (PFA) was obtained from Electron Microscopy Sciences (Hat-
en et al., 2018; Sasaki et al., 2019). These hiPSC-derived neurons      field, Pennsylvania, USA). Rabbit anti-β(III)-tubulin (Ab18207),
can be modulated with known neurotoxicants and drugs (Tukker            mouse anti-S100β (Ab11178) and chicken anti-MAP2 (Ab5392)
et al., 2016; Hondebrink et al., 2017; Odawara et al., 2018). How-      were obtained from Abcam (Cambridge, United Kingdom).
ever, one of the challenges in using hiPSC-derived neurons is the       FluorSave was obtained from Calbiochem (San Diego, Califor-
long time it takes to generate the neurons, which can vary from         nia, USA). iCell® Neural Supplement B and Nervous System
weeks (Kuijlaars et al., 2016) to months (Odawara et al., 2016),        Supplement were provided by Cellular Dynamics International
and the potential variability between batches of differentiated         (Madison, WI, USA). BrainPhys™ neuronal medium was ob-

1 https://www.NC3Rs.org.uk

122                                                                                                                          ALTEX 37(1), 2020
Tukker et al.

Tab. 1: Composition, density and exposure DIV of the different neuronal culture models

 Cell models Cell types (%)                                                             Excitatory:       Cells             Exposure
 		                                                                                     inhibitory        seeded per        DIV
 		                                                                                     neurons (ratio)   droplet
 iCell® Glutaneurons –           Neurons (85%, of which 70% glutamatergic and           2.3:1             140k              DIV14
 iCell® Astrocytes co-culture    30% GABAergic) / Astrocytes (15%)
 CNS.4U® co-culture              Glutamatergic neurons (~40%) / GABAergic               1:1               36k               DIV23
                                 neurons (~40%) / Dopaminergic neurons (~10%) /
                                 Astrocytes (~10%)a
 SynFire® iNs co-culture         Glutamatergic neurons (52%) / GABAergic                2.3:1             270k              DIV28
                                 neurons (22%) / Astrocytes (26%)
 Rat primary cortical neurons Neurons (55%, of which 70-80% glutamatergic               3:1               100k              DIV9-11
                              and 20-30% GABAergicb ) / Astrocytes (45%)c
aNcardia,   https://ncardia.com/product/cns.4u-sup-sup-kit.html#product_specification (accessed 20.06.2019); bMarkram et al., 2004;
cGörtz   et al., 2004; Tukker et al., 2016

tained from StemCell Technologies (Cologne, Germany). Neu-               plemented BrainPhys™ medium (BrainPhys™ medium supple-
ro.4U® basal medium A and CNS.4U® supplement were provid-                mented with 2% iCell® Neural Supplement B, 1% Nervous Sys-
ed by Ncardia (Leiden, The Netherlands). SynFire® seeding basal          tem Supplement, 1% N2, 1% penicillin/streptomycin and 0.1%
medium, short-term basal medium, long-term basal medium and              laminin). The cell pellet was diluted in dotting medium (supple-
accessory supplements were provided by NeuCyte (Sunnyvale,               mented BrainPhys™ medium with 10% laminin) at a density of
CA, USA). Laminin (L2020), 50% polyethyleneimine solution,               15k cells/µL for iCell® Glutaneurons or 6.6k cells/µL for iCell®
sodium borate, boric acid and all other chemicals (unless stated         Astrocytes. Before plating, iCell® Glutaneurons and iCell® Astro-
otherwise) were obtained from Sigma-Aldrich (Zwijndrecht, The            cytes were premixed to a co-culture containing 120k iCell® Glu-
Netherlands).                                                            taneurons (85%) and 20k iCell® Astrocytes (15%) and then plat-
   Stock solutions of strychnine HCl were made in purity-checked         ed in 11 µL droplets (140k cells/droplet) over the electrode field
dimethyl sulfoxide (DMSO) and stored at 4˚C. 4-Aminopyridine             of pre-coated MEA wells or in a chamber of the µ-slide coverslip.
(4-AP) was freshly dissolved in medium on the day of the exper-          Cells were allowed to adhere for ~1 h before 300 µL (MEA) or
iment. Stock solutions of picrotoxin (PTX) were made in ethanol          200 µL (coverslip) room temperature (RT) supplemented Brain-
(EtOH; VWR, Amsterdam, The Netherlands) on the day of the                Phys™ medium was added. 50% Medium changes with RT sup-
experiment. Final concentration of the solvent in exposure solu-         plemented BrainPhys™ medium took place at DIV1, 2, 4, 6, 8,
tions was kept at or below 0.1% (vol/vol).                               10, 12 and 14.

2.3 Cell culture                                                         CNS.4U ® culture
Primary rat cortical cultures and all hiPSC-derived neuronal             CNS.4U® (Lot# CN39CL_V_2M and CN59CL_V-x2; Ncardia,
co-cultures were kept at 37°C in a humidified 5% CO2 incubator.          Leiden, The Netherlands) were obtained as a mixture of ~40%
48-well MEA plates (Axion BioSystems Inc., Atlanta, GA, USA)             glutamatergic neurons, ~40% GABAergic neurons, ~10% dopa-
and µ-slide 8-well chambered coverslips (Ibidi GmbH, Planegg,            minergic neurons and ~10% astrocytes. Cells were thawed and
Germany) were pre-coated with 0.1% polyethyleneimine solu-               cultured according to the manufacturer’s protocol. Briefly, a vi-
tion diluted in borate buffer (24 mM sodium borate, 50 mM boric          al was thawed in Neuro.4U® basal medium A, and the cell pellet
acid in Milli-Q, pH adjusted to 8.4). See Table 1 for an overview        was dissolved in complete Neuro.4U® medium A (basal medium
of the culture details of the four different models, including the       and supplement) at a density of 12k cells/µL. Cells were plated in
day on which their chemical sensitivity was assessed (exposure           3 µL droplets (36k cells in total) directly over the electrode field
DIV). Notably, the exposure days used to determine the drug re-          of pre-coated MEA wells or in the chamber of a µ-slide coverslip.
sponse differed between hiPSC-derived neuronal models as a               Cells were allowed to adhere for ~1 h before 300 µL (MEA) or
consequence of the manufacturers’ recommendations.                       200 µL (coverslip) RT Neuro.4U® medium was added. At DIV1,
                                                                         7, 14 and 21, 100% medium changes were performed with com-
iCell ® Glutaneurons – iCell ® Astrocytes co-culture                     plete Neuro.4U® medium, and at DIV2, 4, 9, 11, 16 and 18, 50%
iCell® Glutaneurons (Lot# 103288; Cellular Dynamics Interna-             of the medium was replaced with complete Neuro.4U® medium.
tional, Madison, WI, USA) and iCell® Astrocytes (Lot# 11493,
1414 and 1444; Cellular Dynamics International, Madison, WI,             SynFire® iNs co-culture
USA) were thawed and cultured according to the manufacturer’s            SynFire® glutamatergic neurons (Lot#104, 109 and 116), Syn-
protocol. Briefly, each cell type was thawed separately in sup-          Fire® GABAergic neurons (Lot#105, 109, 110 and 116) and

ALTEX 37(1), 2020                                                                                                                        123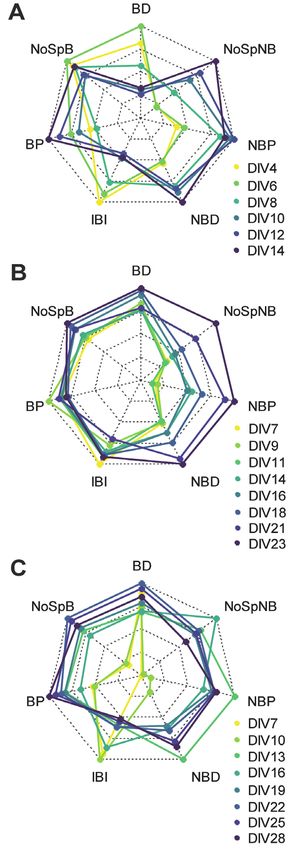
Tukker et al.

SynFire® astrocytes (Lot#12854 and 13029; all from NeuCyte,             200 nM DAPI for nuclear staining was added. Coverslips were
Sunnyvalle, CA, USA) were thawed and cultured according to              again washed thrice with blocking buffer and sealed with 1-2
the manufacturer’s protocol. In short, each cell type was thawed        drops of FluorSave. The coverslips were stored in the dark at 4°C
separately in DMEM-F12 medium. The cell pellet was dissolved            until further use. Immunostained coverslips were visualized with
in complete seeding medium (containing seeding supplement)              a Leica SPEII Confocal microscope (Leica DMI4000 equipped
at a density of 10k cells/µL (for all cell types). Next, a mixture      with TCS-SPE-II) using a 40x oil immersion objective (ACS APO
was made containing 140k glutamatergic neurons (52% of total            IMM NA 0.6). Images were captured as .lif files using Leica Ap-
cell number), 60k GABAergic neurons (22%) and 70k astrocytes            plication Suite Advanced Fluorescence software (LAS AF version
(26%). The mixture was plated in 50 µL droplets (270k cells in          2.6.0; Leica Microsystems GmbH, Wetzlar, Germany).
total) over the electrode field of pre-coated MEA wells or in a
chamber of the µ-slide coverslip. Cells were left overnight to ad-      2.5 MEA measurements
here. On the next day (DIV1), 250 µL (MEA) or 150 µL (cov-              Each well of a 48-well MEA plate contains 16 nanotextured gold
erslip) RT complete short-term maintenance medium (containing           micro-electrodes (~40-50 µm diameter; 350 µm spacing) with
short-term supplement) was added. At DIV3 and 5, 50% medi-              4 integrated ground electrodes, yielding a total of 768 channels
um changes with complete short-term maintenance medium took             that can be recorded simultaneously. Spontaneous electrical ac-
place. The remaining 50% medium changes at DIV7, 10, 13, 16,            tivity was recorded on the days of medium changes and on the
19, 22 and 25 were performed with RT complete long-term main-           day of exposure (Tab. 1) as described previously (Nicolas et al.,
tenance medium (containing long-term supplement A and B).               2014; Tukker et al., 2019). In short, signals were recorded using
                                                                        a Maestro 768-channel amplifier with integrated heating system
Rat primary cortical culture                                            and temperature controller and a data acquisition interface (Axion
Primary rat cortical cells were isolated from PND0-1 Wistar rat         BioSystems Inc., Atlanta, GA, USA). Data acquisition was man-
pups as described previously (Dingemans et al., 2016; Tukker            aged with Axion’s Integrated Studio (AxIS 2.4.2.13) and recorded
et al., 2016). Briefly, PND0-1 pups were decapitated and corti-         as .RAW files. All channels were sampled at the same time with a
ces were rapidly dissected on ice and kept in dissection medium         gain of 1200x and a sampling frequency of 12.5 kHz/channel with
(Neurobasal® -A supplemented with 25 g/L sucrose, 450 µM L-             a 200-5000 Hz band-pass filter. Prior to the recording, MEA plates
glutamine, 30 µM glutamate, 1% penicillin/streptomycin and 10%          were allowed to equilibrate for ~10 min in the Maestro.
FBS, pH 7.4) during the entire procedure. Cortices were dissoci-           To determine effects of the known seizurogenic compounds
ated to a single-cell suspension by mincing with scissors, tritura-     PTX, 4-AP and strychnine on spontaneous activity (spiking and
tion and filtering through a 100 µm mesh (EASYstrainer, Grein-          (network) bursting behavior) of the different cell cultures, activ-
er). The cell suspension was diluted to 2 x 10⁶ cells/mL. Droplets      ity was recorded prior to exposure to generate a baseline record-
of 50 µL (100k cells in total) were placed on the electrode fields in   ing. Immediately following this recording, cells were exposed to
wells of pre-coated MEA plates. Cells were left to adhere for ~2 h      the seizurogenic compounds or the appropriate solvent control,
before adding 450 µL dissection medium. At DIV2, 90% of the             and activity was recorded for another 30 min plus the time it took
dissection medium was replaced with glutamate medium (Neu-              to expose all wells. Concentrations tested were determined by the
robasal® -A supplemented with 25 g/L sucrose, 450 µM L-gluta-           NC3Rs’ CRACK-it team based on the list from the HESI NeuTox
mine, 30 µM glutamate, 1% penicillin/streptomycin and 2% B27            MEA Subteam, and were in line with earlier studies assessing sei-
supplement, pH 7.4) to prevent glial overgrowth. At DIV4, 90%           zure liability (Kreir et al., 2018). Each well was exposed to only
of the glutamate medium was replaced with FBS medium (Neu-              one single concentration of one compound in order to prevent re-
robasal® -A supplemented with 25 g/L sucrose, 450 µM L-gluta-           ceptor (de)sensitization or other compensatory cellular processes.
mine, 1% penicillin/streptomycin and 10% FBS, pH 7.4).                  For each experimental condition, MEA plates from at least two
                                                                        different plating rounds or culture preparations were used.
2.4 Immunocytochemistry
The µ-slide coverslips with different hiPSC-derived neuronal            2.6 Data analysis and statistics
co-cultures were fixated on the day of exposure with 4% PFA in          To determine (modulation of) spontaneous activity, .RAW data
0.1 M PBS (pH 7.4) for 15 min at RT. Following fixation, coverslips     files were re-recorded to obtain Alpha Map files. In this re-record-
were quenched for PFA, permeabilized and incubated for 20 min           ing, spikes were detected with the AxIS spike detector (Adap-
at RT with 20 mM NH4Cl in blocking buffer (2% bovine serum              tive threshold crossing, Ada BandFIt v2) and a variable thresh-
albumin and 0.1% saponin in PBS) as described previously (Tuk-          old spike detector set at 7x (rat primary cortical cultures) or 5.5x
ker et al., 2019). Hereafter, coverslips were incubated overnight at    (all hiPSC-derived neuronal cultures) standard deviation (SD) of
4°C with rabbit anti-βIII tubulin (final dilution 1:500), mouse an-     internal noise level (rms) on each electrode. Post/pre-spike du-
ti-S100β (final dilution 1:500) and chicken anti-MAP2 (final di-        ration was set to 3.6/2.4 ms, respectively. For further data analy-
lution 1:1000) in blocking buffer. Next, coverslips were washed         sis, spike files were loaded in NeuralMetric Tool (version 2.2.4,
thrice with blocking buffer and incubated with donkey anti-rabbit       Axion BioSystems), and only active electrodes (MSR ≥ 0.1
Alexa Fluor® 488, donkey anti-mouse Alexa Fluor® 594 and goat           spikes/s) in active wells (≥ 1 active electrode) were included in
anti-chicken Alexa Fluor® 647 (final dilution 1:100) for 45 min         the data analysis. Bursts were extracted with the Poisson Surprise
at RT in the dark. During the last 2-3 min of this incubation,          method (Legéndy and Salcman, 1985) with a minimal surprise of

124                                                                                                                         ALTEX 37(1), 2020
Tukker et al.
Tab. 2: Overview and description of different metric parameters
Adapted from Tukker et al. (2018).
Metric parameter Description
Mean spike rate (MSR) Total number of spikes divided by recording time (Hz)
ISI coefficient of variation Standard deviation ISI (inter-spike interval) divided by the mean ISI. Measure for spike
regularity: 0 indicates perfect spike distribution, > 1 signals bursting
Number of active electrodes Average number of electrodes with a spike rate of at least 0.1 spike/s
Number of active wells Number of wells that exhibits activity that meets spike criteria
Mean burst rate (MBR) Total number of bursts divided by recording time (Hz)
Number of bursting electrodes Average number of electrodes in the well with number of bursts/second that is higher
than the burst criterion of 0.005 bursts/s
Number of bursting wells Number of wells that meets the bursting criteria
Burst duration Average time from the first spike in a burst till the last spike (s)
Number of spikes per burst Average number of spikes occurring in a burst
Mean inter-spike interval (ISI) within burst Mean inter-spike interval within a burst (s)
Inter-burst interval (IBI) Time between the last spike of a burst and the first spike of a subsequent burst (s)
IBI coefficient of variation Standard deviation of IBI divided by the mean IBI. Measure for burst regularity
Burst percentage Percentage of total number of spikes occurring in a burst
Mean network burst rate (MNBR) Total number of network bursts divided by recording time (Hz)
Network burst duration Average time from the first spike till the last spike in a network burst (s)
Number of spikes per network burst Average number of spikes occurring in a network burst
Mean ISI within network burst Average of the mean ISIs within a network burst (s)
Number of electrodes participating in Average number of electrodes with spikes that participate in the network burst
network burst
Number of network bursting wells Number of wells that meets the network burst criteria
Network burst percentage Percentage of total spikes occurring in a network burst
Network IBI coefficient of variation Standard deviation of network IBI divided by the mean network IBI. Measure of network
burst rhythmicity: value is small when bursts occur at regular interval and increases when
bursts occur more sporadically
Network normalized duration IQR Interquartile range of network burst durations. Measure for network burst duration
regularity: larger values indicate wide variation in duration.
Area under normalized cross-correlation Area under inter-electrode cross-correlation normalized to the auto-correlations.
The higher the value, the greater the synchronicity of the network.
Full width at half height (FWHH) of Width at half height of the normalized cross-correlogram. Measure for network synchrony:
normalized cross-correlation the higher the value, the less synchronized the network is.
10 and a minimum bursting frequency of 0.005 bursts/s. Network number of active wells. Finally, the percentage of network burst-
bursts were determined with an adaptive threshold algorithm. ing wells is the percentage of wells that exhibit network bursts
For developmental curves, full recordings from the days of me- relative to the number of bursting wells. This implicates that only
dium change and the baseline recording of the day of exposure the most active wells are included in the network burst develop-
were used for data analysis, and the means of different network mental analysis, automatically resulting in a relatively high num-
parameters (Tab. 2) were calculated based on well averages. The ber of network bursting electrodes.
percentage of active wells depicts the percentage of wells that ful- The effects of seizurogenic compounds on spontaneous activity
fil the activity criteria relative to the total number of seeded wells. were determined by comparing the baseline activity with activity
The percentage of bursting wells depicts the percentage of wells following exposure. A custom-made MS Excel macro was used
that meet the bursting criteria and is calculated with respect to the to calculate treatment ratios (TR) per well for the different met-
ALTEX 37(1), 2020 125Tukker et al.
Fig. 1: Immunofluorescent images of iCell® Glutaneurons – iCell® Astrocytes co-culture (A), CNS.4U® co-culture (B) and
SynFire ® iNs co-culture (C) illustrating (neuronal) network structures with MAP2 (mature neurons; grey), β(III) tubulin (general
neuronal marker; green) and S100β (astrocytes; red)
Nuclei are stained with DAPI (blue). Scale bar depicts 20 µm.
ric parameters (Tab. 2) by: (parameterexposure /parameterbaseline) marker for astrocytes) antibodies to visualize the heterogeneity
x 100%. Hereafter, TRs were normalized to appropriate vehicle and complexity of the in vitro networks (Fig. 1). The iCell® Glu-
control (medium, DMSO or EtOH). To prevent inclusion of ex- taneurons – iCell® Astrocytes co-culture (A), CNS.4U® co-cul-
posure artefacts, effect analysis was performed in the window of ture (B) and SynFire® iNs co-culture (C) all showed network for-
20-30 min post-exposure for all tested compounds. mation with a high degree of complexity at their corresponding
Wells that showed an effect ≥2x SD above or below average days of exposure (Tab. 1). Images also indicate that neurons and
were considered outliers and removed from further data analy- astrocytes were spread evenly through the cultures.
sis (4% for iCell® Glutaneurons – iCell® Astrocytes co-culture; These results show that all three different hiPSC-derived neu-
3% for CNS.4U® co-culture; 4% for SynFire® iNs co-culture and ronal co-cultures consisted of mature neurons and astrocytes and
5% for rat primary cortical culture). Concentration-dependent ef- indicate that neuronal networks were formed. The network com-
fects were determined by one-way Welch ANOVA followed by a plexity and heterogeneity were comparable to the degree of com-
post hoc Dunnett test. P-values < 0.05 were considered statisti- plexity present in rat primary cortical culture (Hondebrink et al.,
cally significant. All statistical analyses were performed in R ver- 2016).
sion 3.6.02 using the DescTools package version 0.99.283. Spider
plots and heat maps were created in R with the packages fmsb 3.2 Development of spontaneous neuronal activity
version 0.6.34 and pheatmap version 1.0.125, respectively. All and (network) bursting behavior
data are presented as mean ± standard error of the mean (SEM) The different hiPSC-derived neuronal models were cultured ac-
from the number of wells (n) indicated, derived from at least 2 in- cording to continuously improving manufacturer’s recommen-
dependent plating rounds (N). dations up to DIV14 (iCell® Glutaneurons – iCell® Astrocytes
co-culture), DIV23 (CNS.4U® co-culture) or DIV 28 (SynFire®
iNs co-culture) on mwMEAs to assess the development of spon-
3 Results taneous neuronal network activity and bursting behavior over
time. All models developed spontaneous activity (Fig. 2).
3.1 Immunofluorescent staining of the different The mean spike rate (MSR) was relatively stable for the iCell®
hiPSC-derived neuronal models Glutaneurons – iCell® Astrocytes co-culture and CNS.4U®
As a first characterization, the three different hiPSC-derived neu- co-culture (Fig. 2A,B, left), whereas the MSR of the SynFire®
ronal co-cultures were labelled with microtubule-associated pro- iNs co-culture increased over the entire culture period (Fig. 2C,
tein 2 (MAP2, marker for mature neurons), β(III)tubulin (gener- left). The percentage of spiking wells is stable and comparable
al neuronal marker) and S100 calcium binding protein β (S100β, (> 75%) for all models.
2 R: A language and environment for statistical computing. R Foundation for Statistical Computing, Vienna, Austria. https://www.R-project.org/
3 DescTools: Tools for Descriptive Statistics. https://cran.r-project.org/package=DescTools
4 fmsb: Functions for Medical Statistics Book with some Demographic Data. https://CRAN.R-project.org/package=fmsb
5 Pheatmap: Pretty Heatmaps. https://CRAN.R-project.org/package=pheatmap
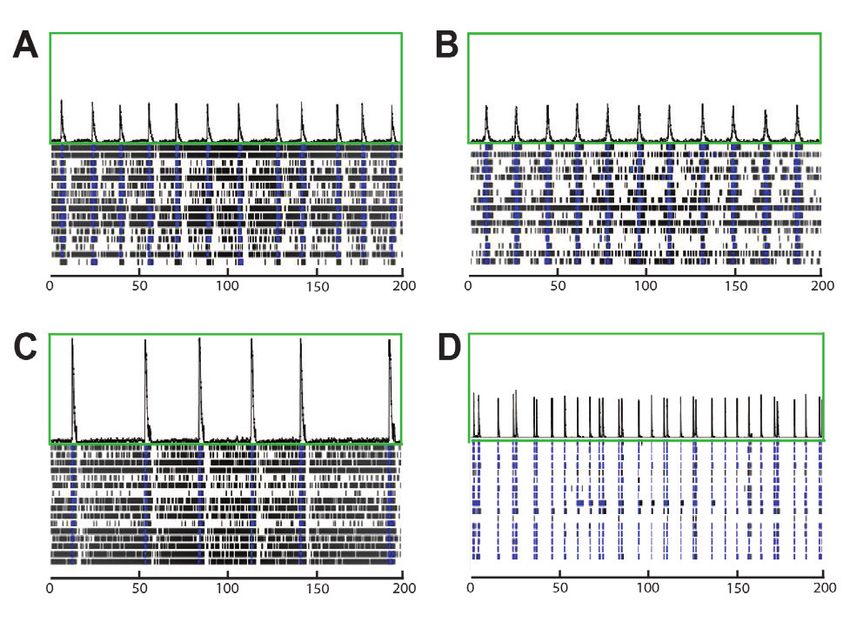
126 ALTEX 37(1), 2020Tukker et al. Fig. 2: Development of mean spike rate (MSR; left), mean burst rate (MBR; middle), and mean network burst rate (MNBR: right) in solid lines and percentage of spiking wells (left), bursting wells (middle), and network bursting wells (right) in dashed lines for iCell® Glutaneurons – iCell® Astrocytes co-culture (A), CNS.4U® co-culture (B) and SynFire ® iNs co-culture (C) Data are expressed as mean ±SEM from n = 26-208 wells, N = 5 plates for the iCell® Glutaneurons – iCell® Astrocytes co-culture; n = 4-170 wells, N = 5 plates for the CNS.4U® co-culture and n= 2-202 wells, N = 8 plates for the SynFire® iNs co-culture. The mean burst rate (MBR) of the CNS.4U® co-culture was ner. Whereas the burst duration became shorter during prolonged stable during the whole culture period, however the rate was low culture of the iCell® Glutaneurons – iCell® Astrocytes co-cul- compared to that of the other two models, especially at the day of ture (Fig. 3A), it increased slightly for the other two models (Fig. exposure (Fig. 2B, middle). The SynFire® iNs co-culture had the 3B,C). For the iCell® Glutaneurons – iCell® Astrocytes co-cul- highest MBR at the end of the culture period (Fig. 2C, middle). ture (Fig. 3A) and the CNS.4U® co-culture (Fig. 3B), the num- The percentage of bursting wells was > 75% for all three models ber of spikes per network burst and network burst percentage at the day of exposure. increased over time, in contrast to the SynFire® iNs co-culture At the beginning of the culture period, the iCell® Glutaneurons (Fig. 3C) where this pattern was relatively stable. The interburst – iCell® Astrocytes co-culture had a high mean network burst interval (IBI) was longest in early culture DIVs for the iCell® rate (MNBR; Fig. 2A, right), especially compared to the other Glutaneurons – iCell® Astrocytes co-culture and the SynFire® two models (Fig. 2B,C, right). However, this rate decreased rap- iNs co-culture, whereas for the CNS.4U® co-culture, the IBI was idly over time to levels comparable with the other 2 models. At relatively stable during the entire culture period. The number of the day of exposure, all cultures exhibited a comparable MNBR, spikes per burst increased during the culture period, resulting but the percentage of wells that exhibited network bursts was low in an increasing burst percentage for the iCell® Glutaneurons – in the CNS.4U® co-culture (< 50%) compared to the other two iCell® Astrocytes co-culture and the SynFire® iNs, whereas this models (> 75%). was relatively stable for the CNS.4U® co-culture. Further analysis of additional (network) burst related param- The pattern of spontaneous electrical activity at the exposure eters revealed additional differences between the models, as is DIV, the day in vitro at which the chemical sensitivity of the depicted in spider plots (Fig. 3). It becomes clear from the lay- compound was assessed, is depicted in spike raster plots (Fig. out of these graphs that the models developed in a different man- 4) and further described by different metric parameters (Tab. 3). ALTEX 37(1), 2020 127
Tukker et al.

                                                                      Fig. 4: Spike raster plots of the different hiPSC-derived
                                                                      co-cultures
                                                                      Each row depicts one electrode, each tick mark represents
                                                                      one spike in a 200 s interval illustrating the pattern of activity of the
                                                                      iCell® Glutaneurons – iCell® Astrocytes co-culture (A),
                                                                      the CNS.4U® co-culture (B), the SynFire® iNs co-culture (C), and
                                                                      the primary rat cortical neurons (D) at the exposure DIV. The
                                                                      cumulative trace (green box) above each plot depicts the
                                                                      population spike time histogram, indicating synchronized activity
                                                                      between the different electrodes.

                                                                      The spike raster plots show that all three models exhibited a ma-
                                                                      ture phenotype with synchronized firing with (network) bursts.
                                                                      The raster plots also confirm that the pattern and level of activi-
                                                                      ty differed between the models. The higher MSR for the iCell®
                                                                      Glutaneurons – iCell® Astrocytes co-culture (Fig. 4A) and Syn-
                                                                      Fire® iNs co-culture (Fig. 4C), as described in Table 3 and Fig-
                                                                      ure 2, is also visible in the raster plots. The spike time histogram
                                                                      (green box, Fig. 4) clearly shows the different levels of synchro-
                                                                      nicity that are outlined in Table 3, and indicate the high num-
                                                                      ber of spikes within a network burst in the SynFire® iNs co-cul-
Fig. 3: Spider plots illustrating the differences in development      ture. Further details regarding the other developmental days of
of neuronal activity between the iCell® Glutaneurons – iCell®         the hiPSC-derived co-cultures can be found in the supplementary
Astrocytes co-culture (A), CNS.4U® co-culture (B) and                 material6 (Tab. S1-S3 and Fig. S1).
SynFire ® iNs co-culture (C)                                             As can be seen in the raster plots, rat primary cortical neurons
The yellow and lighter green lines depict earlier developmental       exhibited a spike frequency comparable to the CNS.4U® co-cul-
DIVs, whereas darker shades belong to DIVs later in development.      ture (Fig. 4D, Tab. 3), whereas the burst frequency was more in
The grey grid represents 0% at the center, whereas the outer          line with the SynFire® iNs co-culture. Network burst activity of
ring represents 100%. For each model, the highest value of a          rat primary cortical neurons occurred in a frequency compara-
parameter during the culture period of that model is set to 100%.     ble to the CNS.4U® co-culture and the SynFire® iNs co-culture.
The axes represent (counter clockwise): burst duration (BD),          The burst duration of the primary rodent culture was much low-
number of spikes per burst (NoSpB), burst percentage (BP),            er than in the hiPSC-derived co-cultures. In rat primary cortical
inter-burst interval (IBI), network burst duration (NBD), network     neurons, most spikes were incorporated in (network) bursts as is
burst percentage (NBP) and number of spikes per network burst         reflected in the (network) burst percentage. This is in sharp con-
(NoSpNB), from n = 15-208 wells, N = 5 plates for the iCell®          trast with hiPSC-derived neuronal models, where single spikes
Glutaneurons – iCell® Astrocytes co-culture; n = 4-167 wells, N = 5   occurred.
plates for the CNS.4U® co-culture; n = 2-202 wells, N = 8 plates
for the SynFire® iNs co-culture.                                      6 doi:10.14573/altex.1907121s

128                                                                                                                            ALTEX 37(1), 2020
Tukker et al.
Tab. 3: Metric parameters at the exposure DIV (mean ±SEM)
Metric parameter (unit) iCell® CNS.4U® SynFire® iNs Rat cortical neurons
Glutaneurons – (DIV23) (DIV28) (DIV11)
iCell® Astrocytes
(DIV14)
MSR (Hz) 64.5 ±2.39 20.5 ±1.60 81.3 ±5.86 21.4 ±0.82
ISI coefficient of variation 1.86 ±0.029 1.93 ±0.046 3.36 ±0.15 4.74 ±0.10
Number of active electrodes 14.4 ±0.13 8.68 ±0.29 13.3 ±0.27 13.4 ±0.23
Number of active wells 208 166 201 236
MBR (Hz) 0.44 ±0.017 0.16 ±0.014 0.69 ±0.057 0.77 ±0.028
Number of bursting electrodes 9.78 ±0.28 3.96 ±0.28 11.5 ±0.43 13.2 ±0.23
Number of bursting wells 208 141 172 234
Burst duration (s) 0.98 ±0.036 1.15 ±0.06 0.97 ±0.033 0.32 ±0.012
Number of spikes per burst 38.9 ±1.35 28.7 ±1.07 73.3 ±3.50 22.7 ±0.55
Mean ISI within burst (s) 0.03 ±0.0007 0.045 ±0.002 0.023 ±0.001 0.02 ±0.001
IBI (s) 33.8 ±0.97 44.0 ±2.22 37.66 ±2.47 25.5 ±0.94
IBI coefficient of variation 0.69 ±0.019 0.80 ±0.031 0.80 ±0.046 0.83 ±0.037
Burst percentage (%) 34.8 ±0.76 34.7 ±1.62 52.3 ±1.84 83.3 ±0.52
MNBR (Hz) 0.1 ±0.006 0.08 ±0.012 0.074 ±0.005 0.073 ±0.002
Network burst duration (s) 0.92 ±0.088 0.88 ±0.076 2.12 ±0.18 0.75 ±0.015
Number of spikes per network burst 306 ±20.1 166 ±22.6 1350 ±106 285 ±7.83
Mean ISI within network burst (s) 0.004 ±0.0002 0.007 ±0.0004 0.003 ±0.0002 0.004 ±0.00
Number of electrodes network burst 13.2 ±0.14 10.1 ±0.36 14.4 ±0.20 13.6 ±0.15
Number of network bursting wells 206 54 154 225
Network burst percentage (%) 37.1 ±1.32 29.8 ±2.87 64.7 ±2.53 93.0 ±0.62
Network IBI coefficient of variation 0.73 ±0.023 0.56 ±0.039 0.83 ±0.064 0.78 ±0.035
Network normalized duration IQR 0.51 ±0.043 0.51 ±0.091 0.56 ±0.13 0.71 ±0.030
Area under normalized cross-correlation 0.11 ±0.003 0.016 ±0.002 0.25 ±0.012 0.56 ±0.011
FWHH of normalized cross-correlation 128 ±1.60 210 ±18.0 734 ±21.3 22.8 ±0.36
3.3 Seizure liability assessment crease started in the SynFire® iNs co-culture at a 3 times lower
Since all models developed spontaneous neuronal activity and concentration. Strychnine significantly decreased the MSR of
(network) bursting behavior, all hiPSC-derived neuronal mod- the iCell® Glutaneurons – iCell® Astrocytes co-culture and the
els were suitable for neurotoxicity testing. To assess their ap- CNS.4U® co-culture. MBR increased in the CNS.4U® co-cul-
plicability for seizure liability assessment, the different models ture, SynFire® iNs co-culture, and rat primary cortical culture
were exposed to known seizurogenic compounds with different (Fig. 5B, left). However, this increase was only significant in
modes of action: strychnine (0.3-30 µM), 4-AP (1-100 µM) and the latter model. At the highest concentration of strychnine test-
PTX (0.1-10µM). We also exposed rat primary cortical neurons ed, the MBR significantly decreased in the iCell® Glutaneurons
as the current gold standard for MEA seizure liability assess- – iCell® Astrocytes co-culture and the CNS.4U® co-culture.
ment. Strychnine exposure significantly increased the MNBR in the
Exposure to the known neurotoxicant strychnine, a glycine rat primary cortical culture (Fig. 5C, left). However, this was
receptor antagonist, resulted in an increase of the MSR followed not observed in the hiPSC-derived neuronal models. Burst du-
by a decrease at higher test concentrations in the SynFire® iNs ration increased in the CNS.4U® co-culture and the iCell® Glu-
co-culture and in the rat primary cortical culture (Fig. 5A, left). taneurons – iCell® Astrocytes co-culture, but only significant-
However, compared to the rat primary cortical neurons, the in- ly in the latter (Fig. 5D, left). A significant decrease in network
ALTEX 37(1), 2020 129Tukker et al. Fig. 5: Toxicological modulation of spontaneous network activity with strychnine (left), PTX (middle) and 4-AP (right) of iCell® Glutaneurons – iCell® Astrocytes co-culture (black), CNS.4U® co-culture (blue), SynFire ® iNs co-culture (green) and rat cortical neurons (striped) Effects are depicted on mean spike rate(MSR; A), mean burst rate (MBR; B), mean network burst rate (MNBR; C), burst duration (D), and network burst duration (E) as average in % change of control (solvent control set to 100%; dashed line) ±SEM from n = 3-17 wells, N = 2-3 plates for iCell® Glutaneurons – iCell® Astrocytes co-culture; n = 2-16 wells, N = 4 plates for CNS.4U® co-culture; n = 3-14 wells, N = 4-5 plates for SynFire® iNs co-culture and n = 19-29, N = 5-8 for rat primary cortical culture. * p < 0.05. 130 ALTEX 37(1), 2020
Tukker et al.

                                                                      burst duration following strychnine exposure was observed in
                                                                      rat primary cortical neurons (Fig. 5E, left).
                                                                         PTX, a widely used seizurogenic reference compound and
                                                                      GABAA-receptor antagonist, showed limited effects on the
                                                                      MSR of iCell® Glutaneurons – iCell® Astrocytes co-culture and
                                                                      CNS.4U® co-culture (Fig. 5A, middle). However, PTX signifi-
                                                                      cantly increased the MSR of the SynFire® iNs co-culture and
                                                                      the rat primary cortical culture at higher concentrations. High-
                                                                      er concentrations of PTX significantly increased the MBR of
                                                                      the SynFire® iNs co-culture and the rat primary cortical culture,
                                                                      but had little effect on iCell® Glutaneurons – iCell® Astrocytes
                                                                      co-culture and the CNS.4U® co-culture (Fig. 5B, middle). In
                                                                      all cultures, PTX increased the MNBR (Fig. 5C, middle), but
                                                                      significantly only in the rat primary cortical culture. A signifi-
                                                                      cant increase of burst duration was observed for the iCell® Glu-
                                                                      taneurons – iCell® Astrocytes co-culture, whereas a decrease
                                                                      occurred in the rat primary cortical culture (Fig. 5D, middle).
                                                                      Network burst duration significantly increased for the iCell®
                                                                      Glutaneurons – iCell® Astrocytes co-culture and the SynFire®
                                                                      iNs co-culture (Fig. 5E, middle). However, network burst dura-
                                                                      tion decreased in the rat primary cortical culture.
                                                                         4-AP, a known CNS stimulant and potassium channel block-
                                                                      er, only increased the MSR of the SynFire® iNs co-culture (Fig.
                                                                      5A, right). MBR increased when the iCell® Glutaneurons –
                                                                      iCell® Astrocytes co-culture and SynFire® iNs co-culture were
                                                                      exposed, although not significantly (Fig. 5B, right). Expo-
                                                                      sure to 4-AP significantly decreased the MBR of the CNS.4U®
                                                                      co-culture. This is in contrast with the increased MNBR follow-
                                                                      ing 4-AP exposure of the CNS.4U® co-culture (Fig. 5C, right).
                                                                      An increase was also observed in the SynFire® iNs co-culture,
                                                                      whereas the iCell® Glutaneurons – iCell® Astrocytes co-culture
                                                                      and rat primary cortical culture were relatively unaffected. Fol-
                                                                      lowing exposure to 4-AP, burst duration significantly decreased
                                                                      in all hiPSC-derived co-cultures, but this decrease occurred at
                                                                      different concentrations (Fig. 5D, right). Network burst duration
                                                                      increased in the SynFire® iNs co-culture, but decreased in the
                                                                      CNS.4U® co-culture and rat primary cortical culture (Fig. 5E,
                                                                      right).
                                                                         The activity patterns of the different models changed following
                                                                      exposure. More details can be found in the supplementary data6
                                                                      (Fig. S2 for strychnine, Fig. S3 for PTX and Fig. S4 for 4-AP).
                                                                         We created a heatmap of the concentration-response curves of
                                                                      the three test compounds on the four different models to further
Fig. 6: Heatmap of the effects of strychnine (0.3-30 μM; top),        illustrate the effects on different metric parameters (Fig. 6). By
PTX (0.1-10 μM; middle), and 4-AP (1-100 μM; bottom) on               the different color pattern in the heatmap, it becomes clear that
selected metric parameters on iCell® Glutaneurons – iCell®            strychnine, PTX and 4-AP have different mechanisms of action.
Astrocytes co-culture (black), CNS.4U® co-culture (blue),             For all compounds, but particularly for PTX, the network burst
SynFire ® iNs co-culture (green), and rat primary cortical            related parameters are most affected when it comes to exci-
neurons (grey)                                                        tation. Burst related parameters are more sensitive to inhibition
Color scaling is based on the magnitude of the % of change relative   especially following 4-AP or strychnine exposure.
to the control based on n = 1-18 wells, N = 2-3 plates for iCell®        Several similarities and differences between the models were
Glutaneurons – iCell® Astrocytes co-culture; n = 1-16 wells, N = 4    observed. Following exposure to strychnine, seizurogenicity
plates for CNS.4U® co-culture; n = 2-15 wells, N = 4-5 plates for     was most noticeable in the network burst related parameters in
SynFire® iNs co-culture and n = 11-30 wells, N = 5-8 plates for rat   the SynFire® iNs co-culture. Inhibition following strychnine ex-
primary cortical culture. For white compartments no average could     posure was most pronounced in the CNS.4U® co-culture.
be calculated.                                                           When the models were exposed to PTX, all showed a clear

ALTEX 37(1), 2020                                                                                                                   131
Tukker et al.
excitation. The iCell® Glutaneurons - iCell® Astrocytes co-cul- – iCell® Astrocytes co-culture, which had the highest number of
ture and the CNS.4U® co-culture reacted in a comparable pat- glutamatergic neurons, exhibited the highest MNBR (Fig. 2C).
tern, whereas the SynFire® iNs co-culture showed more similar- However, at the day of exposure, MNBR was comparable in all
ities with the rat primary cortical culture. cultures. Despite their differences, all the models tested exhibit-
The only model that is excitable with 4-AP in all three tradi- ed a pattern of development comparable to that of the rat primary
tional parameters (MSR, MBR and MNBR) is the SynFire® iNs cortical culture (Brown et al., 2016) with MSR, presence of (net-
co-culture. The iCell® Glutaneurons – iCell® Astrocytes co-cul- work) bursts and synchronized activity increasing over time.
ture shows excitability in burst and network burst parameters at Since all models developed spontaneous activity, a neurotox-
concentrations lower than the rat primary cortical culture. Over- icity screen was performed in each using the known seizurogen-
all, the SynFire® iNs co-culture was most easily excited, whereas ic compounds strychnine, PTX and 4-AP. These compounds are
the CNS.4U® co-culture was most easily inhibited. used in in vivo studies to induce seizures (Peña and Tapia, 2000;
Mackenzie et al., 2002; Alachkar et al., 2018). Strychnine and
4-AP have also been reported to cause seizures in humans (Pick-
4 Discussion ett and Enns, 1996; van Berlo-van de Laar et al., 2015). Over-
all, our data indicate the potential of the hiPSC-derived neuronal
In this study we investigated the applicability of three different models for in vitro seizure liability assessment as all three com-
human iPSC-derived neuronal models for more predictive in vi- pounds increased activity and synchronicity of the networks.
tro seizure liability assessment without the use of animals or an- The potential for seizure liability assessment is further con-
imal tissues. firmed when comparing our data with two seizure prediction
Our immunocytochemistry data (Fig. 1) demonstrated the patterns described by Bradley et al. (2018). Seizure prediction
mixed nature of the different hiPSC-derived neuronal models. pattern 1 is indicative for the response induced by GABAA-re-
The images show that all models formed highly complex neu- ceptor antagonists, such as PTX. This pattern is characterized
ronal networks comparable with the ones formed by rat primary by an overall increase in activity as well as increased organiza-
cortical cultures (Hondebrink et al., 2016). tion and synchronization, reflected in an increased number of
All three models developed spontaneous neuronal network spikes per burst, increased interspike interval (ISI) coefficient
activity and (network) bursting behavior over time (Fig. 2-4). of variation, increased burst duration, and a decrease in IBI. All
However, the level of activity and bursting varied between the four tested models showed an increase in overall activity fol-
different models, despite culturing all models according to the lowing exposure to PTX (Fig. 5). Spiking activity increased
respective manufacturer’s protocol. There are several possible in a concentration-dependent manner only in the SynFire® iNs
explanations for these differences. One likely explanation re- co-culture and primary rat cortical neurons, similar to results re-
lates to cell density, as the amount of cells plated in mwMEAs ported previously for rat primary cortical cultures (Mack et al.,
has been shown to greatly influence the spontaneous firing rate, 2014; Kreir et al., 2018) and hiPSC-derived neuronal co-cul-
with higher densities resulting in a higher spontaneous activity tures (Kreir et al., 2019). An increase in activity was observed
rate (Jun et al., 2007). In line with this notion, the model with for all models in (network) bursting, comparable to results from
the lowest seeding density (CNS.4U® co-culture; Tab. 1) also Kreir et al. (2019). Also, organization and synchronization were
had the lowest spike and burst activity (Fig. 2). The cell densi- enhanced according to prediction pattern 1 (Fig. 6).
ty of the CNS.4U® co-culture is also low compared to densities Seizure prediction pattern 2 is characterized by a decrease in
reported in the literature (Odawara et al., 2016; Matsuda et al., overall activity and a deterioration of network organization, re-
2018; Sasaki et al., 2019). Cell densities of the iCell® Glutaneu- flected in an increased IBI, a decreased number of spikes per
rons – iCell® Astrocytes co-culture and, in particular, of the Syn- burst, and a decreased ISI coefficient of variation and burst du-
Fire® iNs co-culture were more in line with densities reported in ration. This pattern is indicative of exposure to the glycine re-
the literature, and this was paralleled by a higher spontaneous ceptor antagonist strychnine (Bradley et al., 2018). The iCell®
activity level. Glutaneurons – iCell® Astrocytes co-culture and CNS.4U®
The spontaneous firing rate was also enhanced by the pres- co-culture exhibited decreased activity (Fig. 5) and network dis-
ence of astrocytes (Tang et al., 2013; Ishii et al., 2017; Tukker integration (Fig. 6) following the described prediction pattern.
et al., 2018). The higher ratio of astrocytes in the iCell® Glutan- Changes in spike and burst activity at the lowest test concen-
eurons – iCell® Astrocytes co-culture and SynFire® iNs co-cul- tration in the iCell® Glutaneurons – iCell® Astrocytes co-cul-
ture (Tab. 1) may contribute to their higher spike and burst rate ture are statistically significant, indicating a high sensitivity of
(Fig. 2A,B). The SynFire® iNs co-culture was the culture with this model for the tested glycine receptor agonist. However, this
the highest ratio of astrocytes, which coincided with the highest does not necessarily indicate biological relevance. In contrast
degree of synchronization (Fig. 4). to earlier reported findings (Bradley et al., 2018; Kreir et al.,
Additionally, it has been described previously that human iPSC- 2018), activity of the rat primary cortical culture increased fol-
derived neuronal cultures with a high ratio of glutamatergic neu- lowing strychnine exposure. However, this could be due to dif-
rons exhibit more synchronous bursting events compared to cul- ferences in maturation stage between E18-19 and PND1 corti-
tures with a low proportion of glutamatergic neurons (Sasaki et ces. During embryonic development, glycine receptors have an
al., 2019). During the first culture days, the iCell® Glutaneurons excitatory function, whereas they become inhibitory later on
132 ALTEX 37(1), 2020Tukker et al. (Dutertre et al., 2012). However, there are also cases where the rodent and human sys- Exposure to the potassium channel blocker 4-AP is reported to tem show comparable results (Kasteel and Westerink, 2017). follow seizure prediction pattern 1 (Bradley et al., 2018), how- The discrepancies between the rat primary rodent cortical cul- ever our data do not support that notion (Fig. 5, 6). An increase ture and our hiPSC-derived neuronal models should not be the in overall activity is only observed in the SynFire® iNs co-cul- main concern. Rather, attention must be focused on further char- ture and an increase in bursting activity in the iCell® Glutaneu- acterization and optimization of hiPSC-derived neuronal mod- rons – iCell® Astrocytes co-culture (Fig. 5), but the increased els to make them more closely resemble the human brain, spe- organization and synchronization to match pattern 1 is not pres- cifically those parts that are involved in epileptic activity such ent (Fig. 6). Kreir et al. (2019) reported an increase in spike and as the amygdala, hippocampus and neocortex (Rogawski and network burst frequency following exposure of hiPSC-derived Löscher, 2004). neuronal cultures to strychnine. This matches our SynFire® iNS Also, it must be kept in mind that this study was done with a co-culture data. The other cultures showed a decreased activity limited number of test compounds. To fully understand the ap- pattern, but with a network deterioration that did not match pre- plicability of hiPSC-derived neuronal models for in vitro seizure diction pattern 2. Rat hippocampal neurons cultured on MEA liability assessment, a broader set of compounds should be test- plates exhibit increased activity (Fan et al., 2019). It could thus ed, including, besides seizurogenics, anti-seizurogenic and neg- be that a more hippocampal-like phenotype is required to detect ative compounds. the seizurogenic activity of 4-AP. Nevertheless, the current data show that hiPSC-derived neu- When comparing the differences in sensitivity of the models, ronal models may already be used as a first screen for epileptic the aforementioned points with regard to ratio of excitatory to activity before performing follow-up studies. With that we are inhibitory neurons, number of astrocytes present, and seeding one step closer to animal-free in vitro seizure liability assess- density must be kept in mind, since these can all affect chemical ment. To fully move away from animal testing for in vitro sei- sensitivity. Although cells were exposed when they exhibited zure liability assessment, hiPSC-models must be developed in network maturation and according to continuously improving which all targets involved in the onset and duration of seizures manufacturer’s protocols, network complexity (e.g., the num- are present and validated using a large library of diverse refer- ber of contacts that the different cell types establish) can still be ence compounds. With respect to the comparison of hiPSC-de- different among the different models. This may influence how rived neuronal cultures with rodent primary neuronal cultures; the models react to chemical insults. Also, receptor expression such a comparison cannot be performed one on one. Actually, may differ between the different hiPSC-derived neuronal mod- our data show some striking differences between the different els. Spontaneous activity and drug responses are dictated by the models, highlighting the need to move to human model systems, complex interplay of a large number of different receptor types, thereby eliminating the need for interspecies extrapolation. ion channels and transporters, all consisting of different sub- types. To better understand the differences in chemical sensi- tivity between the models, full protein profiles of the expression References levels of the different receptors, channels and transporters pres- Alachkar, A., Łażewska, D., Latacz, G. et al. (2018). Studies on ent must be made. However, not only the numbers of receptors, anticonvulsant effects of novel histamine H3R antagonists in channels and transporters are crucial, also the interplay, location electrically and chemically induced seizures in rats. Int J Mol and distribution of the receptors, channels and transporters de- Sci 19, 3386. doi:10.3390/ijms19113386 fine chemical sensitivity. Anson, B. D., Kolaja, K. L. and Kamp, T. J. (2011). Opportuni- We showed that all tested models were able to form sponta- ties for use of human iPS cells in predictive toxicology. Clin neously active networks with (network) bursting behavior. Our Pharmacol Ther 89, 754-758. doi:10.1038/clpt.2011.9 data also indicated that these models can be used for animal-free Authier, S., Arezzo, J., Delatte, M. S. et al. (2016). Safety pharma- in vitro seizure liability assessment. More importantly, the iPSC- cology investigations on the nervous system: An industry sur- derived models were capable of modeling seizure-like activity vey. J Pharmacol Toxicol Methods 81, 37-46. doi:10.1016/J. at the same level or even better than the rat primary cortical neu- VASCN.2016.06.001 ronal culture. However, in order to detect seizure-like activity in Bradley, J. A., Luithardt, H. H., Metea, M. R. et al. (2018). In vitro with a MEA system, multiple parameters must be assessed. vitro screening for seizure liability using microelectrode ar- When only spike behavior is investigated, seizure-like activity ray technology. Toxicol Sci 163, 240-253. doi:10.1093/toxsci/ may be missed. kfy029 Also, when comparing data from hiPSC-derived neuro- Brown, J. P., Hall, D., Frank, C. L. et al. (2016). Evaluation of nal models with rat primary cortical cultures, it must be kept a microelectrode array-based assay for neural network ontog- in mind that there are differences between rodents and humans. eny using training set chemicals. Toxicol Sci 154, 126-139. Hence, rodent experiments are not always predictive for human doi:10.1093/toxsci/kfw147 risk (Olson et al., 2000). It is thus logical that results can differ Buskila, Y., Breen, P. P., Tapson, J. et al. (2015). Extending the between in vitro assays that are performed using human cells viability of acute brain slices. Sci Rep 4, 5309. doi:10.1038/ and assays using rodent cells (Hondebrink et al., 2017). This in srep05309 turn results in different hits and sensitivities (Malik et al., 2014). Cotterill, E., Charlesworth, P., Thomas, C. W. et al. (2016). A ALTEX 37(1), 2020 133
You can also read