TOWARDS POLICIES TACKLING THE CURRENT YOUTH EMPLOYMENT CHALLENGES IN EASTERN EUROPE AND CENTRAL ASIA - ILO
←
→
Page content transcription
If your browser does not render page correctly, please read the page content below
Towards policies
tackling the
current youth
employment
challenges in
Eastern Europe
and Central Asia

Area of Critical Importance
Jobs and Skills for Youth
Towards policies
tackling the
current youth
employment
challenges in
Eastern Europe
and Central Asia

ILO Decent Work Technical Support Team
and Country Office for Eastern Europe and Central Asia
Copyright © International Labour Organization 2017
First published 2017

Publications of the International Labour Office enjoy copyright under Protocol 2 of the Universal Copyright Convention.
Nevertheless, short excerpts from them may be reproduced without authorization, on condition that the source is
indicated. For rights of reproduction or translation, application should be made to ILO Publications (Rights and
Licensing), International Labour Office, CH-1211 Geneva 22, Switzerland, or by email: rights@ilo.org. The International
Labour Office welcomes such applications.

Libraries, institutions and other users registered with reproduction rights organizations may make copies in accordance
with the licences issued to them for this purpose. Visit www.ifrro.org to find the reproduction rights organization in your
country.

Towards Policies Tackling the Current Youth Employment Challenges in Eastern Europe and Central Asia; ILO Decent
Work Technical Support Team and Country Office for Eastern Europe and Central Asia. – Moscow: ILO, 2017

84 p.

ISBN: 978-92-2-119805-5 (print); 978-92-2-119806-2 (web pdf)

									                                                                            ILO Cataloguing in Publication Data

The designations employed in ILO publications, which are in conformity with United Nations practice, and the
presentation of material therein do not imply the expression of any opinion whatsoever on the part of the International
Labour Office concerning the legal status of any country, area or territory or of its authorities, or concerning the
delimitation of its frontiers.

The responsibility for opinions expressed in signed articles, studies and other contributions rests solely with their
authors, and publication does not constitute an endorsement by the International Labour Office of the opinions
expressed in them.

Reference to names of firms and commercial products and processes does not imply their endorsement by the
International Labour Office, and any failure to mention a particular firm, commercial product or process is not a sign
of disapproval.

ILO publications and electronic products can be obtained through major booksellers or ILO local offices in many
countries, or direct from ILO Publications, International Labour Office, CH-1211 Geneva 22, Switzerland. Catalogues or
lists of new publications are available free of charge from the above address, or by email: ilo@turpin-distribution.com.

Visit our website: www.ilo.org/publns or contact ilopubs@ilo.org.

Printed in Russia
Acknowledgements              3

Acknowledgements

The ILO, addressing the persistent youth employment crisis, has
called upon robust actions based on broad partnerships and innovative
mechanisms of policy formulating and multiplication of efforts. As a
significant step in this direction, and with reference to recently adopted
guiding documents1, the ILO is issuing the report aimed at supporting
its constituents in tackling youth employment challenge through a
coherent and sound approach to macroeconomic policies, employment,
skills development and other relevant issues.

Such approach is suggested to be fostered through a mechanism of
voluntary peer reviews on youth employment policies, which serves
as an arena for mutual learning and elaboration of policy tools and
recommendations with reference to good practices.

The publication provides viable solutions on what works for youth
employment, and can be used as a separate report or together with
the Toolkit for conducting voluntary peer reviews on youth employment
policies and Methodology for conducting youth labour market analysis.

The publication has been inspired and nourished by the practical
experience of a comprehensive peer review process organized within
the frames of the ILO Project “Partnerships for Youth Employment in
the Commonwealth of Independent States (YEP CIS)”. The project has
been implemented by the ILO Decent Work Team and Country Office
for Eastern Europe and Central Asia, with financial support of LUKOIL
company.

The peer review process involved constituents representing nine
countries from Eastern Europe and Central Asia: Armenia, Azerbaijan,
Georgia, Kazakhstan, Kyrgyzstan, the Russian Federation, Tajikistan,
Turkmenistan and Uzbekistan. This publication has been ameliorated
by original and eloquent inputs by all participating countries, which
through the whole process validated the content, checking it against
their concrete experiences of policy making and adequate policy change.      1
                                                                               See resolution and conclusions of the
                                                                             101st session of the International Labour
ILO Decent Work Technical Support Team and Country Office for                Conference, Geneva (2012), “The youth
                                                                             employment crisis: A call for action”, p.3
Eastern Europe and Central Asia (ILO Moscow) gave overall impetus and        (www.ilo.org/wcmsp5/groups/public/@
coordinated the preparation of this report. The gratitude is expressed       ed_norm/@relconf/documents/
to Gianni Rosas, ILO Rome, Olga Koulaeva and Mikhail Pouchkin, ILO           meetingdocument/wcms_185950.pdf),
Moscow, for overall supervision of the process and provision of valuable     and ILC (2014), “Resolution concerning
                                                                             the second recurrent discussion
inputs to the report.
                                                                             on employment”, p.6. www.ilo.org/
                                                                             wcmsp5/groups/public/---ed_norm/---
                                                                             relconf/documents/meetingdocument/
                                                                             wcms_249800.pdf
4 Towards policies tackling the current youth employment challenges in Eastern Europe and Central Asia
The report was developed with the technical support of the Employment
Policy Department of the ILO.
Development of the report will not become possible without collaborative
actions and support of the team of the ILO technical cooperation project
“Partnerships for Youth Employment in the CIS”.
Special thanks go to the international expert Alena Nesporova for writing
substantial parts of the publication, providing insights and sharing the
experience.Table of contents 5
Table of contents
Acknowledgements 3
Introduction 7
Section 1:
Overview of the socio-economic
and labour market situation 9
1.1 The socio-economic situation 11
1.1.1 Economic development 11
1.1.2 Social development 14
1.2 The youth labour market situation 16
1.2.1 Demographic trends 16
1.2.2 Migration developments 17
1.2.3 Youth labour force participation 19
1.2.4 Youth employment 21
1.2.5 Youth unemployment 25
1.3 Youth employment challenges and the ways of tackling them 29
Section 2:
Public and corporate policies
promoting youth employment 33
2.1 Assistance in finding relevant education and training 35
2.2 Improving the access to and the quality and relevance
of vocational education and training 38
2.3 Assistance in transition of young people from school to work 416 Towards policies tackling the current youth employment challenges in Eastern Europe and Central Asia
Section 3:
Policy recommendations on
promoting youth employment 57
3.1 Promote the creation of decent and productive employment 59
3.2 Stimulate formalization of the informal sector and informal employment 61
3.3 Invest in relevant, high quality vocational education and training of youth 62
3.4 Strengthen the national labour market information system 64
3.5 Invest in the capacity building of the Public Employment Services 66
3.6 Expand the provision and increase the impact of labour market policies 68
3.7 Build on partnerships with relevant stakeholders 72
Annex:
Table A1: Key macroeconomic indicators for selected EECA countries, 2000, 2009 and 2015 79
Table A2: Current and projected population structure by main population groups
(per cent of total population) 80
Table A3: Current and projected life expectancy at birth by sex (years) 80
Table A4: Current and projected total, child and old-age dependency ratios (per cent) 81
Table A5: Employment structure by economic sector, 2000, 2008 and 2014
(per cent of total employment) 81
Table A6: Employment structure by status in employment (per cent of total employment) 82
Table A7: Vulnerable employment total and by sex (per cent of total employment by sex) 83
Table A8: Trends in youth unemployment rates by sex and adult unemployment rates
(per cent of youth and adult labour force) 83Introduction 7 Introduction This paper is an outcome of the project “Partnerships for Youth Employment in the Commonwealth of Independent States” implemented by the ILO Decent Work Team and Country Office for Eastern Europe and Central Asia in Moscow and financed by the Russian company LUKOIL. The project helped establish a multi-country youth employment network of nine countries: Armenia, Azerbaijan, Georgia, Kazakhstan, Kyrgyzstan, Russian Federation, Tajikistan, Turkmenistan and Uzbekistan. The network under the guidance of the ILO Moscow Office carried out several rounds of peer reviews on youth employment policies and programmes with the aim to build the capacity of labour market institutions of the participating countries for assessing the relevance and effectiveness of the applied youth employment policies, learn from each other’s experience and improve the impact of these policies. The paper may be used separately or together with the two other papers produced within the project. The first one explains the purpose of peer reviews, how they are organized and what is required from each participating party with regard to the provision of statistical data and policy assessment, preparation and participation in on-site visits and review meetings; it offers practical assistance for all stages of the peer review. The second paper deals with the technical side of the peer reviews. On the basis of a suggested content of the background reports to be prepared by the reviewed and the reviewing countries, it clarifies what comprehensive statistical and policy information needs to be collected in order to properly analyze the labour market situation of young people and identify their key employment challenges, and how to carry out an assessment of applied policies addressing these challenges as to their outcomes, impact and effectiveness. This paper summarizes the lessons learnt from the conducted rounds of the peer reviews, highlights successful policies applied by the network countries and proposes some recommendations for improving the outcomes and effectiveness of the current implemented policies. It is structured into three sections (besides this introduction). Section 1 first shortly reviews economic and social developments in the nine countries participating in the network. It then provides a detailed comparative analysis of the labour market situation in general but mainly of young people that serves for revealing the main employment challenges faced by youth. Section 2 examines public and corporate policies tackling the identified youth employment challenges in the
8   Towards policies tackling the current youth employment challenges in Eastern Europe and Central Asia

                                       nine countries and marks out those that have demonstrated promising
                                       results in addressing the critical issues and could be inspiring for
                                       policy makers in other network countries. It shows the strong points,
                                       underlying conditions but also some weaknesses of these policies.
                                       The section also brings some good practices implemented in other,
                                       mostly economically advanced, countries. Section 3 builds on findings
                                       of the two previous sections and offers for consideration of the peer
                                       review countries some recommendations that would contribute towards
                                       building the analytical and policy-making capacity of the labour market
                                       institutions and increase the relevance and effect of applied policies
                                       promoting youth employment, with a focus on the disadvantaged groups
                                       of young people.

                                       The paper is targeted at governments (and within it primarily ministries
                                       responsible for labour, employment and youth issues), social partners
                                       and other interested institutions not only of the network countries but
                                       also of other groups of countries wishing to undertake voluntary peer
                                       reviews of their policies.
Section 1:
Overview of the
socio-economic
and labour
market situatioNSECTION 1: Overview of the socio-economic and labour market situation 11
SECTION 1:
Overview of
the socio-economic
and labour market
situation
1.1 The socio-economic situation
1.1.1 Economic development
The nine countries participating in the peer review network differ
with regard to their economic level.2 According to the latest World
Bank classification of 1 July 2016, five of them (Azerbaijan, Georgia,
Kazakhstan, Russian Federation and Turkmenistan belong to higher-
middle-income countries and the remaining four countries (Armenia,
Kyrgyzstan, Tajikistan and Uzbekistan) to lower-middle-income
countries.3
After the deep transition crisis in the first half of the 1990s followed
by the period of volatile economic development, all the 9 reviewed
Eastern European and Central Asian (EECA) countries embarked on
rapid economic growth since 1999, making the region one of the fastest
growing world regions (see Figure 1.1). GDP growth rates even reached
double digits in Azerbaijan, Turkmenistan and Armenia. Countries
producing and exporting oil and gas, such as Azerbaijan, Kazakhstan,
the Russian Federation, Turkmenistan and to some extent Uzbekistan,
benefitted from high revenues from export of these commodities (see
2
The World Bank measures economic
level of a country by gross national
Table A1 in the Annex). The export revenues fueled not only increasing income per capita calculated in
investments both into the oil and gas sector and into technical and purchasing power parity in current
social infrastructure but also contributed to rising consumer demand international dollars. This indicator
and mounting imports of consumer goods. Also high foreign direct for the nine countries in 2015 was
the following: Kazakhstan 24,480 $,
investment (FDI) inflows added to rapid economic advancement. The Russian Federation 23,770 $,
strong economic growth in the Russian Federation stimulated boom Azerbaijan 17,170 $, Turkmenistan
in the economies of other EECA countries through linkages in trade 15,760 $, Georgia 9,430 $, Armenia
and investment flows, while also remittances sent by migrant workers 8,770 $, Uzbekistan 6,200 $, Tajikistan
employed in the Russian Federation and Kazakhstan back home played 3,460 $ and Kyrgyzstan 3,310 $.
Source: World Development Indicators
an important role in the expansion of demand for consumer goods and database accessed on 6 January 2017.
housing. The EECA countries dependent on imports of oil and gas were 3
blogs.worldbank.org/opendata/new-
thus able to partially offset the negative effects of rising energy prices country-classifications-201612 Towards policies tackling the current youth employment challenges in Eastern Europe and Central Asia
through remittances, export of other natural resources and agricultural
products (e.g. cotton) and through the expansion of construction and
services. Nevertheless, their trade and current account balances were
deteriorating.
Figure 1.1. GDP annual growth rates in selected EECA
countries, 2000–2016 (per cent)
40
30
20
10
0
2000 2001 2002 2003 2004 2005 2006 2007 2008 2009 2010 2011 2012 2013 2014 2015 2016
-10
-20
Armenia Azerbaijan Georgia
Kazakhstan Kyrgyzstan Russian FederaDon
Tajikistan Turkmenstan Uzbekistan
Sources:
IMF’s World Economic Outlook database, April 2016.
The global financial and economic crisis hit primarily those EECA
countries, such as e.g. Kazakhstan and the Russian Federation, where
the banks, due to their undercapitalization and high involvement
in the provision of housing loans, had to borrow large sums on the
international financial markets. In the crisis housing prices sharply
decreased, national currencies depreciated and many enterprise and
household loans denominated in foreign currencies turned to be non-
performing. Banks burdened by bad loans reduced their lending to the
enterprise sector that fell into recession. Moreover, oil and gas exporters
were also struck by a sharp decline in energy prices that reduced their
export revenues. Economic recession in the Russian Federation and
Kazakhstan contaminated the neighbouring EECA countries throughSECTION 1: Overview of the socio-economic and labour market situation 13
cuts in demand for their exports as well as the reduced amount of
remittances flowing to these countries. As a result, in 2009 GDP
declined in absolute terms in Armenia, the Russian Federation and
Georgia, while other countries experienced the GDP slowdown (see
again Figure 1.1).
The economic crisis was short-lived in the region mainly thanks to the
fast recovery of energy prices but also due to the positive impact of
anti-crisis measures launched by some EECA countries, in particular
Kazakhstan and the Russian Federation. Oil and gas exporting
countries returned to high GDP growth fed by elevated energy prices
and the revival of domestic demand, although the GDP rates did no
longer reach the pre-crisis levels. However, since mid-2014 the newly
plummeting prices of oil and gas have again reduced their export
revenues rather dramatically and, as a result, their economic growth
has significantly slowed down, in the case of Azerbaijan in 2016 and
the Russian Federation in 2015–2016 their GDP even contracted. The
situation has further aggravated because of geopolitical tensions and
the sanctions imposed on Russia. Low revenues from export combined
with national currencies’ devaluation and increasing borrowing costs
on the international financial markets have forced these countries to
sharply reduce imports, while also private consumption and investment
have declined, including the flows of FDI. The accumulated savings
from export revenues in times of high oil prices helped at least partially
to cushion the negative effects of low energy prices on the enterprise
sector as well as on households. The current moderate rise of global
energy prices together with the recovery of domestic production
replacing imported goods have helped the Russian Federation to return
to positive economic growth.
The recent events have once again revealed serious structural weaknesses
of their economies relying excessively on the production and export
of oil and gas. The economic diversification programmes launched in
Azerbaijan, Kazakhstan and the Russian Federation over the past 15
years and aiming to strengthen the non-oil sector and develop high
value-added manufacturing have so far brought only limited results and
the contribution of manufacturing to GDP has remained very low (10.8
per cent in Kazakhstan, 6.9 per cent in the Russian Federation and
5.8 per cent in Azerbaijan in 2015).4 Nevertheless, the current new
Russian economic policy aimed at substituting imports by domestic
production has already contributed to an increase in manufacturing.
4
World Bank, World Development
Indicators database http://databank.
worldbank.org/data/reports.
aspx?source=world-development-
indicators14 Towards policies tackling the current youth employment challenges in Eastern Europe and Central Asia
EECA countries dependent on oil and gas imports also quickly returned
to economic growth since 2010 fed by strong domestic demand resulting
from the renewed inflow of remittances primarily from Russia and also
from Kazakhstan and Azerbaijan5 as well as supported by recovering
export of agricultural products and some other commodities. They
maintained high economic dynamic until 2014 (with the exception of
Kyrgyzstan in 2010 and again in 2012). However, their persistently
large current account deficits contributed to an increase in their
sovereign debts and thus made their economic stability very fragile.
Economic recession combined with currency depreciation in the EECA
oil-exporting countries has reduced demand for exports from the other
EECA countries and caused devaluation of their own currencies, while
also the volume and purchasing power of remittances have declined.
These new developments together with the increasing costs of their
debt service have deepened economic imbalances and resulted in a
significant slowdown of their GDP.
1.1.2 Social development
High economic growth since 1999 brought about a significant poverty
5
The importance of remittances for reduction in all countries of the region. The share of population living
household incomes, consumption and
economic growth of the EECA countries
in extreme poverty6 that had reached 54.3 per cent in Tajikistan, 42.2
– importers of oil and gas – is documented per cent in Kyrgyzstan, 19.4 per cent in Georgia, 16.9 per cent in
by their contribution to GDP: Tajikistan Armenia and 10.1 per cent in Kazakhstan in the period 1999–2001
with 41.7 per cent is in the first place in (in Azerbaijan and the Russian Federation it moved below 3 per cent)
the world and Kyrgyzstan with 30.3 per dropped to zero or close to zero in 2013. Georgia was an exception as
cent in the second place, while in Armenia
remittances contribute 17.9 per cent, in it still recorded 11.5 per cent of population living in extreme poverty
Georgia 12 per cent and in Uzbekistan in 2013. The only available figures on poverty for Turkmenistan and
9 per cent to GDP. On the other hand, Uzbekistan showed that 43.3 per cent of the population were extremely
the Russian Federation was with US$ poor in the former country in 1998 and 66.8 per cent in the latter
32.6 billion the third most important
remittance-sending country globally. For
country in 2003.
comparison, Kazakhstan sent US$ 3.6
billion and Azerbaijan 2 billion. All these The proportion of population living in poverty (the poverty line of
data are for 2014 and come from The US$ 3.10 per day) and its development is depicted in Figure 1.2. The
World Bank Migration and Remittances figure confirms the overall trend towards poverty reduction within the
Factbook 2016.
6
Internationally comparable database region. It also shows that the global economic crisis led to a temporary
on poverty uses two poverty lines: an reversal of this tendency in most countries between 2008 and 2010
extreme poverty line equal to US$ 1.90 (in Kazakhstan only until 2009), followed by a return to the declining
headcount per day (calculated in trend. Still in Armenia the share of poor people in 2013 exceeded
purchasing power parity (PPP) of 2011,
which is an equivalent of US$ 1 per day
its 2008 level. Another striking fact is a relatively limited decline in
measured in 2005 PPP) and a poverty poverty in Georgia, compared to countries at a lower economic level,
line of US$ 3.10 headcount per day such as Kyrgyzstan or Tajikistan (see footnote 1). In 2013, Georgia thus
(calculated in 2011 PPP as an equivalent had the highest share of poor people among the countries participating
of US$ 2 per day measured in 2005 PPP). in the peer review, for which data are available. This would point to a
Data are available in the World Bank’s
World Development Indicators database. larger income inequality in Georgia in comparison with these countries.SECTION 1: Overview of the socio-economic and labour market situation 15
Indeed, Georgia and the Russian Federation have the highest Gini
coefficients in the region, respectively 0.40 and 0.416, and moreover,
income inequality has further increased since 2000.7 In contrast, the
Gini coefficient for Armenia was 0.315, for Kyrgyzstan 0.274 and for
Kazakhstan 0.264 (all data are for 2013), while the latest figure for
Tajikistan from 2009 was 0.308 (data for other countries are either
non-available or very old).
7
Income inequality is usually measured
by the Gini coefficient that moves
between 0 signifying perfect income
equality and 1 for a hypothetical case of
perfect inequality.
Figure 1.2. Poverty* developments, 2000–2013
(per cent of population)
* Poverty is measured as the headcount at US$ 3.10 a day calculated in purchasing
power parity of 2011.
Notes: Data for Azerbaijan are available only until 2005 when the share of poor
population was zero. Data for Tajikistan are available only until 2009. The sole figure for
Turkmenistan is for 1998 and for Uzbekistan for 2000.
Sources:
World Bank’s World Development Indicators database, accessed in September 2016.
(http://databank.worldbank.org/data/reports.aspx?source=world-development-indicators)16 Towards policies tackling the current youth employment challenges in Eastern Europe and Central Asia
Poverty indicators based on national poverty lines mostly record the
same decreasing trend as the two above mentioned international
indicators of poverty: in Armenia the proportion of poor people declined
from 48 per cent in 2001 to 30 per cent in 2014, in Azerbaijan from
50 per cent in 2001 to 6 per cent in 2012, in Kazakhstan from 47 per
cent in 2001 to 3 per cent in 2014, in Kyrgyzstan from 40 per cent
in 2006 to 31 per cent in 2014 and in the Russian Federation from
18 per cent in 2005 to 13 per cent in 2015. National data on poverty
for Russia also show that the current economic recession led to a new
increase in the share of poor population by almost two percentage
points between 2013 and 2015. Other countries provide only few data
on poverty based on their national definition: 32 per cent of population
lived in poverty in Tajikistan in 2014 and 16 per cent in Uzbekistan in
2011 (no data exist on Turkmenistan).
1.2 The youth labour market situation
1.2.1 Demographic trends
The countries participating in the peer review differ a lot with regard to
their population, its demographic composition and trends. As of 1 July
2015 the population of the Russian Federation reached 143.5 million,
followed by Uzbekistan with 29.9 million, Kazakhstan with 17.6 million,
Azerbaijan with 9.8 million, Tajikistan with 8.5 million, Turkmenistan
with 5.4 million, while Kyrgyzstan had 5.4 million, Georgia 4 million
and Armenia 3 million inhabitants.
Armenia, Georgia and the Russian Federation have on average
significantly older population than the remaining countries: the median
age8 of the first group ranged from 34.6 years in Armenia to 38.7 years
in the Russian Federation, while in the second group it moved from
22.5 years in Tajikistan to 30.9 years in Azerbaijan. This cross-country
diversity will further increase in the future according to the latest UN
population projections9: in 2030 (the end year of the UN Agenda for
Sustainable Development) the median age will be between 41.4 years
in Armenia and 42.4 years in Russia for the first group, and between
24.8 in Tajikistan and 37.1 years in Azerbaijan for the second group.
As documented in Table A2, the latter group of countries has high
8
The median age divides the population shares of both children (aged 0–14 years) and youth (aged 15–24)
into exactly two halves: one half of in total population, which will be transformed into large future labour
population is younger and another half
older.
supply. However, this positive demographic dividend will result in
9
https://esa.un.org/unpd/wpp/Download/ accelerated economic development of these countries only when
Standard/Population/ young people get quality education relevant for the labour marketSECTION 1: Overview of the socio-economic and labour market situation 17
(which requires sufficient investment into the education system by
the state and families themselves) and when the economy is able to
absorb them, i.e. create enough productive jobs. On the other hand,
the share of older population above 65 is very low due to shorter life
expectancy at birth especially among men (in Turkmenistan, Uzbekistan
and Kazakhstan men on average die even before reaching 65 years of
age!), lagging behind that of women by 6–9 years (see Table A3). The
total dependency ratio ranges between 38 in Azerbaijan and 60.9 in
Tajikistan and is thus mainly to be attributed to child dependency,
while old-age dependency is very low (Table A4). Between now and
2030 total dependency will sharply rise in Azerbaijan but only slightly
in Kazakhstan and Kyrgyzstan and even decline in the other three
countries as the weight of children will decrease and that of the elderly
rise, most rapidly in Azerbaijan.
In contrast, the first group currently benefits from high levels of working
age population, which will, however, gradually get older and leave the
labour market, while the less numerous young age cohorts will not be
able to replace them (see again Table A2). Labour supply will shrink and
the resulting labour shortages will constrain economic growth, unless
the countries further increase economic activity of the population both
within and beyond the working age, turn to labour-saving technologies
and/or attract larger numbers of labour migrants (and are able to
properly integrate them into the society). Within this group Armenia
and Georgia have higher life expectancy at birth of both sexes and thus
higher shares of older population (see Table A3), compared with the
second group but also with the Russian Federation (that has similar
life expectancy levels as the second group but even larger gender gap,
over 11 percentage points). Nevertheless, total dependency ratios
for all the three countries are similar as for the second country group
because lower child dependency ratios are compensated by higher old-
age dependency (see table A4). Between 2015 and 2030 the total
dependency ratios will sharply increase in these 3 countries mainly
thanks to a fast rise of their old-age part, while child dependency will
also grow in Georgia and Russia but not in Armenia.
1.2.2 Migration developments
Migration can be an additional source of population and labour
force growth in countries receiving migrant workers. Migrant workers
contribute to economic development and wealth creation of the host
country but rather often they have to struggle with discrimination in
employment and remuneration. Conversely, in countries of migration
origin larger-scale emigration may help alleviate tensions in the labour
market and bring additional income for population through remittances.18 Towards policies tackling the current youth employment challenges in Eastern Europe and Central Asia
Nevertheless, the country loses its most valuable resource as emigrants
are usually younger, often better educated and more flexible than the
population back home. And in countries with the ageing population
it will sharpen future labour market shortages, which could affect in
particular Armenia and Georgia.
According to the above mentioned UN population projections, in the
period 2010–2015 the Russian Federation was by far the major recipient
of migrants in the region as 1.1 million more foreign citizens arrived
in Russia than Russian citizens emigrated abroad. Kazakhstan was the
second immigration country with the net increase of 160 thousand
migrants. In all the other 7 countries the numbers of emigrants exceeded
those of immigrants between 2010 and 2015 and the two countries
with the largest net migration outflow were Georgia (296 thousand)
and Uzbekistan (195 thousand persons). While the greatest migration
flows were between the Russian Federation and the other countries of
the region, and between Kazakhstan and other Central Asian countries,
rather huge flows occurred also between the neighbouring countries, in
particular within Central Asia. According to the World Bank, among 30
countries with the highest stock of migrants in the world Russia was
in the fourth place with 11 million and Kazakhstan in the seventeenth
place with 3.5 million immigrants.10 Conversely, with regard to the
number of persons who left their country to live abroad, the Russian
Federation with 10.9 million emigrants was in the third place and
Kazakhstan with 3.8 million on the sixteenth place (these data are
for 2013).
While international migration is relatively massive in the region, internal
migration (mobility within the country) is rather low. For example in
the Russian Federation only 2 per cent of population change their
residence annually.11 According to a global survey on internal migration
undertaken by Gallup in 139 countries, internal mobility was found
rather low in 5 countries of the region (Armenia, Georgia, Kazakhstan,
Kyrgyzstan and the Russian Federation) and very low in the remaining
four countries (Azerbaijan, Uzbekistan, Tajikistan and Turkmenistan).12
10
World Bank, Migration and Remittances
Factbook 2016. Washington 2016.
11
Berglund, T., Promoting labour market
mobility in the Republic of Kazakhstan and
the Russian Federation. ILO, Moscow 2017.
12
Esipova, N., Pugliese, A. and Ray, J., The
demographics of global internal migration.
International Organization for Migration,
Geneva 2014.SECTION 1: Overview of the socio-economic and labour market situation 19
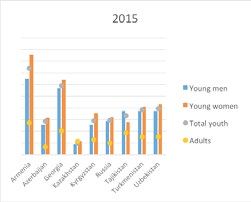
1.2.3 Youth labour force participation
There are large differences among the 9 reviewed countries with regard
to youth labour force participation (LFP) as illustrated by Figure 1.3.13
Central Asian states tend to have higher youth LFP rates compared
with the remaining countries and the gap between Azerbaijan (34.3
per cent) and Tajikistan (47.7 per cent) exceeded 13 percentage
points in 2015. For comparison, in the case of total population the
picture is mixed as the highest LFP rates are recorded by Kazakhstan,
Russia and Georgia, while Turkmenistan, Uzbekistan and Kyrgyzstan
have significantly lower rates and the gap between Kazakhstan with
the highest and Turkmenistan with the lowest rate was again 13
points in 2015. While over the period 2000–2015 economic activity
of total population was steadily increasing in all these countries with
the exception of Kyrgyzstan, youth economic activity grew in Georgia,
Turkmenistan and Uzbekistan, practically stagnated in Armenia and 13
Youth is specified in this report in line
Tajikistan and declined – somewhat in Kyrgyzstan but steeply in with the United Nations definition as
Azerbaijan, Kazakhstan and the Russian Federation. persons between 15 and 24 years of age.
Figure 1.3. Youth labour force participation
total and by sex (in per cent)
2000 2015
Sources:
ILO Key Indicators of the Labour Market (KILM) database, 9th edition, ILO,
Geneva 2015. Table 1a.20 Towards policies tackling the current youth employment challenges in Eastern Europe and Central Asia
Economic activity of young women is significantly lower than that of young
men in all but one country since only in Azerbaijan the rates of both
sexes are very similar – as again illustrated by Figure 1.3. Cross-country
differences in the youth female rates are much smaller in comparison with
the male rates: the female rates ranged from 27.1 per cent in Georgia to
38.9 per cent in Kazakhstan, while the male rates moved between 34.6
per cent in Azerbaijan and 58.7 per cent in Kyrgyzstan in 2015. The
gender gap in economic activity thus widely differed: in Azerbaijan it was
only 0.7 points, while it climbed up to 24.7 points in Georgia and 24.9
points in Turkmenistan. Moreover, compared with 2000 the gender gap
increased in all but one country – Azerbaijan – over the analyzed period as
economic activity of young men either grew more or declined less than that
of women (female activity slightly rose only in Turkmenistan and Uzbekistan
but shrank in all the other countries, while male activity augmented in 6
countries and decreased in 3 countries).
Figure 1.4 reveals that economically active young women have on average
higher education than young men: the share of tertiary educated female
youth is significantly larger and the share of young women with only primary
education much lower in comparison with the analogous proportions for
young men in all 6 countries for which data are available. It confirms that
high education is an important factor for the decision of young women to
enter the labour market. Nevertheless, the significantly lower and declining
labour force participation of young females, compared with young males,
indicates that the recently observed return to traditional cultural norms
(with women engaged in households and family care) plays a significant
role not only in the case of less educated women but may also discourage
young women with tertiary education from joining the labour force.
Figure 1.4. Youth labour force by sex and
educational attainment, 2013
(per cent of persons having a certain level of
education in total youth labour force)
Sources:
ILO KILM database, table 14a.SECTION 1: Overview of the socio-economic and labour market situation 21
1.2.4 Youth employment
Employment-to-population ratio (or the employment rate) of youth
was again higher in Central Asia in comparison with the remaining
countries similarly as youth economic activity (see Figure 1.5) and
ranged from 23.6 per cent in Armenia to 40.5 per cent in Kyrgyzstan.
However, in 6 out of 9 countries its level in 2015 was lower than in 2000;
higher employment rates occurred only in Tajikistan, Turkmenistan
and Uzbekistan. This contrasted with the adult employment rate that
increased in all but 2 countries (Kyrgyzstan and Turkmenistan) over
this period. Economic recession or slowdown in 2009–2010 had only a
marginal effect on these observed longer-term trends. Adult employment-
to-population ratio exceeds that of youth from 1.6 times in Kyrgyzstan
to 2.5 times in Armenia and the difference has deepened since 2000.
The decline in the youth employment rate is to be largely attributed to
higher involvement of young people in the education process, which is
a positive trend. Nevertheless, a certain and increasing part of young
people are either unemployed or inactive as the economy is unable to
create enough jobs to absorb them, despite high economic growth (and
on the top, the quality of employment of many young people is low). All
these issues will be discussed later.
Figure 1.5. Youth employment-to-population
ratio by sex, 2000 and 2015 (in per cent)
2000 2015
Sources:
ILO KILM database, table 2a.22 Towards policies tackling the current youth employment challenges in Eastern Europe and Central Asia
The employment rate of young men is significantly larger in Central
Asian countries than in the other 4 countries and in 2015 Kyrgyzstan
recorded almost double the male rate of Armenia. In the case of
young women the situation is not as clear-cut: in 2015 the highest
rates were achieved by Kazakhstan and Tajikistan and the lowest by
Armenia and Georgia but Russia and Azerbaijan had higher female
rates than Turkmenistan and Uzbekistan. The young male and
female employment rates also had different dynamics over the period
2000–2015. The male rates increased everywhere except for the 3
richest countries (Azerbaijan, Kazakhstan and Russia). In contrast,
the female rate increased only in one country – Uzbekistan – and
in Turkmenistan remained stable, while it declined in all the other
countries. The gender difference in the employment-to-population ratio
of young people that was already quite large in 2000 has widened in
most countries and ranged from 1.7 percentage points in Azerbaijan to
21.9 points in Kyrgyzstan in 2015. As already mentioned above, the
gender gap is mainly associated with higher unemployment (as will be
illustrated later) as well as with inactivity due to women’s engagement
in households and family care, which both result from a gradual return
to traditional cultural norms and from strengthening gender stereotypes.
The employment structure by sector of economic activity still
shows large shares of total employment in agriculture in most countries
with the exception of the Russian Federation but also their steep
decline since 2000 (see Table A5). Employment in industry after its
collapse during the transition crisis has again somewhat increased
in most countries after 2000 (except for Russia and Tajikistan where
it declined), while employment in services has steadily augmented
everywhere. With regard to youth, the available national data show that
in comparison with total population young people are overrepresented
in agriculture (48 per cent of youth vs. 37 per cent of all workers in
Azerbaijan in 2014, 33 per cent of youth vs. 24 per cent of all workers
in Kazakhstan, 8 per cent of youth vs. 7 per cent of all workers in the
Russian Federation and 65 per cent of youth (aged 15–29) vs. 45 per
cent of adult workers (aged 30–59) in Tajikistan. Apart from agriculture
data also suggest that young people are overrepresented in retail trade
and hotels and restaurants. All these sectors are offering low productive
jobs with low earnings.
Data on status in employment reveal large differences across the
countries in the distribution of employment between dependent and
self-employment (see Table A6). In the Russian Federation over 90 per
cent of workers are employees, while their share reaches 69 per cent
in Kazakhstan and exceeds 50 per cent in Armenia, Kyrgyzstan and
Tajikistan. In contrast, in Azerbaijan and Georgia wage employment
contributes only one-third to total employment (all data are for 2013,
only in Tajikistan for 2009). Over the period 2000–2015 the share
of wage employment increased in all the countries for which data areSECTION 1: Overview of the socio-economic and labour market situation 23
available but declined in Armenia. Self-employment is thus a widely
extended type of employment in the region and the bulk of them are
own-account workers, mostly active in agriculture and services. The
proportion of contributing family workers is also high in Armenia,
Azerbaijan, Georgia and Kyrgyzstan. The vast majority of own account
workers and all contributing family workers perform low productive
activities, often without any social protection, and therefore own
account workers and contributing family workers are included into the
category of vulnerable employment.
Informal employment is rather widespread in the region although data
on its incidence are scarce. ILO STAT database offers recent estimates
of informal employment only for a few countries: informal employment
contributed 48.6 per cent to total employment in Armenia (2014),
29.6 per cent in Kazakhstan (2013) and 11.5 per cent in the Russian
Federation (2014). In Armenia and Kazakhstan the share of informal
employment is slightly higher among women, while in the Russian
Federation men are more frequently employed informally than women. 14
The Ministry of Labour and Social Affairs
The Armenian Statistical Agency estimated the share of informal of the Republic of Armenia, Information
employment at 49.9 per cent of total employment in 2014, of whom report on youth employment promotion
policy in Armenia. Yerevan 2016.
50.3 per cent were women and 49.7 per cent men.14 National statistics 15
The Statistical Agency of the Republic
of Kazakhstan puts the level of informal employment at 24 per cent of of Kazakhstan counts as informal workers
total employment in 2013 and notes its decline from 39 per cent in those who are working informally (i.e. are
2008.15 The share of people working without any formal labour contract not registered in the social insurance
system) regardless of whether they work
is estimated at 67 per cent in Azerbaijan. While in Baku informal
in formal or informal sector enterprises
employment contributes some 40 per cent to total employment, in the or households. The decline in 2013
regions their share moves between 70 and 90 per cent.16 In Tajikistan, in comparison with 2008 was also
the 2009 Labour Force Survey put the level of informal employment at affected by methodological changes in
54 per cent of total employment.17 According to the Russian statistics, counting of informal sector enterprises
and informal workers. Source: ILO, Jobs
employment in informal enterprises accounted for 17.1 per cent of and skills for youth: Review of policies
total employment in 2012 and only slightly decreased from its peak of for youth employment of the Republic of
18.4 per cent in 2005.18 Kazakhstan. ILO, Geneva 2015.
16
Pouchkin, M. and Surina, J., Peer review
of youth employment policies in the
With regard to informal employment of young people, their share in
Republic of Azerbaijan: Synthesis report.
total Russian youth employment increased from 15.8 per cent in 2001 ILO, Moscow 2016.
to 25.3 per cent in 2005, then gradually declined to 20 per cent in 17
Pouchkin, M. and Surina, J., Peer review
2010, among others due to job losses during economic recession, and of youth employment policies in the
again rose to 24.4 per cent in 2012. Informal employment is equally Republic of Tajikistan: Synthesis report.
ILO, Moscow 2015.
distributed among young men and women.19 Data for Kyrgyzstan suggest 18
Employment in informal enterprises
that the share of informal employment in total youth employment can, however, include also formal workers.
accounted for 78.2 per cent and in rural areas it even climbed to In contrast, data on informal employment
85.5 per cent. Young men are more exposed to informality than young in formal enterprises and in households
are not available. ILO, Jobs and skills
women: in their case informality concerns 81 per cent of all young male
for youth: Review of policies for youth
workers, in rural areas even 86.8 per cent (all data are for 2012).20 employment of the Russian Federation.
Young people are thus disproportionally represented in informal labour ILO, Geneva 2014.
and although hard data on young informal workers are not available for 19
ILO, Jobs and skills for youth of the
other countries, indirect evidence confirms this finding there as well. Russian Federation, op. cit.
20
Pouchkin, M. and Surina, J., Peer review
of youth employment policies in the
Republic of Kyrgyzstan: Synthesis report.
ILO, Moscow 2014.24 Towards policies tackling the current youth employment challenges in Eastern Europe and Central Asia
Informal employment typically relates to poor quality jobs not covered
by social and legal protection, often performed under hazardous
working conditions and offering low earnings. It is mainly driven by
the lack of good quality employment. However, it also covers so-called
undeclared work (including the payment of a part of wages under the
table or in-kind, or bogus self-employment) associated with deliberate
evasion of taxes and social protection contributions. Both forms of
informal employment can be found in all countries but the former is
widespread in less economically developed countries while the latter
form is more typical for economically advanced countries. Besides
direct negative impacts on informal workers described above, informal
employment reduces tax revenues of public budgets and contributions
to social funds, which could otherwise be used for higher investment
in education, health care and social welfare. Moreover, firms in the
informal sector compete unfairly with formal enterprises, undercut
the wage level and undermine the creation of decent workplaces with
decent wages in the economy.
As data on informal employment for most countries are missing, the ILO
recommends to use vulnerable employment as a proxy (this proxy is
more appropriate for measuring the first type of informal employment,
while it underestimates the second type, non-declared work).
Table A7 shows the most recent data on vulnerable employment in 7
EECA countries as well as their development since the 2000s. It again
confirms the high incidence of vulnerable employment in the region
with the exception of the Russian Federation (which would suggest
that undeclared work is the main form of informal employment in
Russia) and to some extent also of Kazakhstan. In Armenia, Azerbaijan
and Georgia women are more exposed to vulnerable employment than
men, while in Kyrgyzstan, Russia and Tajikistan it is vice versa and in
Kazakhstan their shares are equal. The overall tendency is towards a
decline in vulnerable employment, while in Georgia it has stagnated
but in Armenia it has steeply increased.21 Again, available evidence
shows that young people are overrepresented in vulnerable employment.
21
A sharp rise in vulnerable employment For example, in 2012 the share of youth aged 15–24 in vulnerable
in Armenia is, however, to be attributed employment accounted for 39.6 per cent of total youth employment in
to methodological changes rather than to Kazakhstan, while in the case of total population it was only 29.3 per
actual developments. cent, and in the Russian Federation it was, respectively, 6.8 per cent
22
Data for Kazakhstan are from: ILO,
Jobs and skills for youth of Kazakhstan, and 5.7 per cent.22
op. cit. Figure on the share of youth in
vulnerable employment in total youth Flexible forms of employment23, such as temporary and part-time
employment for the Russian Federation is employment, are rather rare in the region. In Kazakhstan only 4.9 per
from: ILO, Jobs and skills for youth of the
Russian Federation, op. cit., and on the cent of wage workers were employed on a temporary basis in 2012,
share of vulnerable employment in total down from 11.2 per cent in 2008, according to national statistics. In
employment is from: ILO KILM database, the Russian Federation the share of temporary employment accounted
Table 3. for 9 per cent in 2015 as shown by the OECD database and its share
23
Flexible forms other than informal
also declined from 13.9 per cent in 2008.24 Temporary employment is
employment that is actually the most
flexible form of employment. twice as high for youth (18.4 per cent in 2015) in Russia but between
24
http://www.oecd.org/employment/emp/ 2008 and 2015 youth temporary employment declined even faster, by
employmentdatabase-employment.htm 6 percentage points, than for total population. Young men work moreSECTION 1: Overview of the socio-economic and labour market situation 25
often on a temporary basis than young women and the incidence of
temporary employment increases for lower levels of education. Data
on part-time employment are available only for the Russian Federation
(again from the OECD database) and show that 4.2 per cent of
workers worked part-time, and among them more women than men,
in 2015. Young people were once again more represented in part-time
employment (6.6 per cent) compared with total population (4.2 per
cent) and their share stagnated since 2008.
1.2.5 Youth unemployment
The joblessness of young people in 8 EECA countries moved in double
digits from 14.3 per cent in Azerbaijan to as high as 37.2 per cent
in Armenia in 2015 (see Figure 1.6). It exceeded adult joblessness
1.8 times in Tajikistan and 2.2 times in Kyrgyzstan, while for other
countries the gap was from 2.5 times in Turkmenistan to 4.1 times
in Azerbaijan (see Table A8). Kazakhstan is an exception as its youth
unemployment only amounted to 5.1 per cent and was even 0.6
percentage points lower than adult joblessness in 2015, which is rather
unique in the world. Young women are more exposed to unemployment
than young men in 8 out of 9 countries and the gender difference
climbs up to 10.4 percentage points in Armenia, only in Tajikistan
young men face higher joblessness than young women. Between 2000
and 2015 Azerbaijan, Kazakhstan and the Russian Federation were able
to cut their youth unemployment rates significantly, while Tajikistan
reduced it slightly. In all the other countries the youth rate stagnated
or increased, in Georgia even quite substantially – by 9 points. Gender
gap in unemployment increased in most countries over this period,
only in Kazakhstan, Russia and Tajikistan it was somewhat reduced.
Table A8 also documents that the economic recession of 2009–2010
disproportionally hit young people as compared with adults in most
countries, except for Kazakhstan, where the youth rate continued
declining, and for Turkmenistan and Uzbekistan, where it stagnated.26 Towards policies tackling the current youth employment challenges in Eastern Europe and Central Asia
Figure 1.6. Youth unemployment total and by sex,
2000 and 2015 (rates in per cent)
2000 2015
Sources:
ILO KILM database, table 9a.
The incidence of long-term unemployment (over one year) among
young jobseekers is low in Kazakhstan, Kyrgyzstan and the Russian
Federation: 12 per cent of youth unemployment in the first two
countries and 17 per cent in Russia in 2013. However, in Armenia 38
per cent of young jobless persons were long-term unemployed and in
Azerbaijan their share even climbed to 72 per cent. Data on long-term
unemployment are not available for other countries.
Within each country there are large territorial differences in youth
unemployment (as well as in total joblessness). For example, in the
Russian Federation the North Federal District and the Central Federal
District had the lowest youth unemployment rates, respectively 10.7
and 10.8 per cent in 2012, while in the North Caucasus Federal
District one in three economically active young persons were jobless.
However, when considering the lower level territorial entities, the
variation is even much larger: the youth unemployment rate equaled
only 3.2 per cent in Saint Petersburg and 4.7 per cent in Moscow,
while in the Chechen Republic it climbed to 52.8 per cent and in the
Republic of Ingushetia even to as high as 91 per cent.25 In Kazakhstan
25
ILO, Jobs and skills for youth of the diversity in unemployment at the higher, regional level is rather low
Russian Federation, op. cit. and the rates moved between 3.5 per cent in Atyrau Oblast and 7.9SECTION 1: Overview of the socio-economic and labour market situation 27
per cent in Zhambyl Oblast in 2013. However, at the local level the
differences were again much larger.26 Similar territorial disparity in
youth unemployment exists in other countries as well.
In economically developed countries unemployment both of youth
and adults is negatively correlated with the level of education: low
educated persons face the highest unemployment rate while the rate
declines with increasing education level. High education is thus the
best guarantee against unemployment. However, in the EECA region this
relationship is valid only for the Russian Federation, while in Armenia
it is exactly the opposite (see Figure 1.7). In Kazakhstan the rates
are practically of the same low magnitude for all the three education
levels. In Georgia and Kyrgyzstan the joblessness rate of persons with
primary or lower education is below that of tertiary educated persons,
while in Kyrgyzstan secondary educated persons have the lowest
rate and conversely in Georgia they face the highest rate. Figure 1.7
also reveals that higher education pays off for both sexes only in the
Russian Federation and for women in Kyrgyzstan. Young Armenian
women, Georgian men and Kazakh women and men have very similar
unemployment rates irrespective of their level of education, while more
educated young men in Armenia and Kyrgyzstan and better educated
young women in Georgia face significantly higher unemployment than
their low educated peers. These figures would suggest that apart
from Kazakhstan and the Russian Federation the economies of other
countries are not able to generate enough productive jobs for young
educated people and many of them may thus perform jobs requiring
lower education than they possess. For example, data for Tajikistan
show that 20 per cent of workers with tertiary education are working in
blue-collar positions, while in the case of secondary VET graduates this
share climbs to 34 per cent.27
26
ILO, Jobs and skills for youth of
Kazakhstan, op. cit.
27
Pouchkin M. and Surina J., Peer
review of youth employment policies
in the Republic of Tajikistan: Synthesis
Report, op. cit.28 Towards policies tackling the current youth employment challenges in Eastern Europe and Central Asia
Figure 1.7. Youth unemployment by sex and
educational attainment, 2013 (rates in per cent)
Sources:
ILO KILM database, table 14c.
These data also indicate that there are large skill mismatches in
the labour market in a number of countries. According to the latest
World Economic Forum’s assessment of impediments for business
development, inadequately educated workforce was identified as
the most serious impediment for doing business in Georgia, while in
Armenia and Azerbaijan it occupied the fourth place, in Kazakhstan the
fifth place, in the Russian Federation the seventh place, in Kyrgyzstan
the ninth place and in Tajikistan the tenth place.28
While the majority of inactive young people in the age group of 15–24
are engaged in education, there is a certain percentage of youth who are
not for various reasons. They together with unemployed youth represent
a group of NEETs (young people not in employment, education or
training). The size of this group of “idle” young people is an indicator
on the one hand of the availability and accessibility of education and
training for youth and its relevance for the labour market and on the
other hand of the availability of jobs in the labour market. Research
shows that such an “idleness” in young age can have devastating
28
World Economic Forum, The Global impacts on future work career of young people and can lead to their
Competitiveness Report 2015–2016, social exclusion, poverty and in some cases even to criminal activity
Davos 2016. and therefore governments pay high attention to NEETs through various
29
See e.g. ILO, The youth employment
crisis: Time for action. Report V of the re-integration programmes (as will be discussed later).29 Data on NEETs
International Labour Conference, 101st are available for 6 countries and range from 8 per cent of all young
session, ILO, Geneva 2012. people in Kazakhstan in 2013, through 12 per cent in Russia (2012),You can also read