Town of Bolton Housing Production Plan - March 01, 2021 - Mass.gov
←
→
Page content transcription
If your browser does not render page correctly, please read the page content below
Town of Bolton
                       Housing Production Plan

                               March 01, 2021

Housing Production Plan Committee
Mark O’Hagan, Co-Chair
Brian Boyle, Co-Chair
Herb Cabral
Panny Gerken
Eileen Griffin-Wright
Erik Neyland

Erica Uriarte, Town Planner
Table of Contents

1     Executive Summary ..................................................................................................................... 4
2     Introduction .................................................................................................................................. 5
    2.1      Why is Bolton Preparing a Housing Production Plan? ...................................................... 5
    2.2      What is Affordable Housing? ............................................................................................... 6
    2.3      Bolton’s Existing and Proposed Affordable Housing ........................................................ 7
    2.4      Fees / Property In Lieu ....................................................................................................... 10
    2.5      Housing Goals ..................................................................................................................... 11
3     Demographic Profile ................................................................................................................. 12
    3.1      Population Growth.............................................................................................................. 12
    3.2      Age Distribution .................................................................................................................. 13
    3.3      Racial Composition ............................................................................................................. 15
    3.4      Household Composition..................................................................................................... 15
4     Economic Profile ........................................................................................................................ 17
    4.1      Income .................................................................................................................................. 17
    4.2      Poverty ................................................................................................................................. 18
    4.3      Employment ........................................................................................................................ 19
    4.4      Disability Status................................................................................................................... 19
5     Housing Profile and Needs Assessment ................................................................................. 21
    5.1      Housing Growth.................................................................................................................. 21
    5.2      Housing Occupancy ............................................................................................................ 22
    5.3      Housing Values ................................................................................................................... 23
    5.4      Affordability Analysis ........................................................................................................ 24
    5.5      Subsidized Housing Inventory (SHI): Existing and Proposed ....................................... 24
    5.6      Priority Housing Needs ...................................................................................................... 26
6     Constraints and Challenges to Development ......................................................................... 27
    6.1      Infrastructure ....................................................................................................................... 27
    6.2      Zoning .................................................................................................................................. 27
    6.3      Environmental Constraints................................................................................................. 27
    6.4      Transportation ..................................................................................................................... 28
    6.5      Availability of Subsidy Funds ............................................................................................ 28
    6.6      Community Perceptions ..................................................................................................... 28
    6.7      Mitigation of Challenges and Constraints ......................................................................... 28
7     Housing Production Goals ....................................................................................................... 29

                                                                                                                                                       2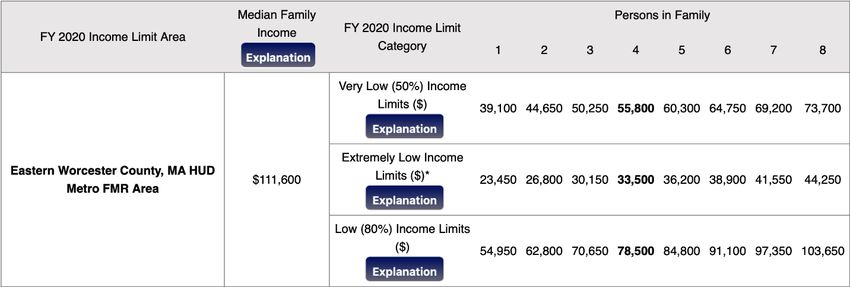
7.1      Housing Goals ..................................................................................................................... 29
    7.2      Production Goals ................................................................................................................. 29
8     Housing Goals Implementation Strategies ............................................................................ 30
    8.1      40B Development ................................................................................................................ 30
      8.1.1         Encourage “Friendly” 40B Developments (LIPs) ...................................................... 30
    8.2      Preserve Affordable Housing Units at Bolton Woods...................................................... 33
      8.2.1         Resolve Expiring Deed Restrictions ........................................................................... 33
      8.2.2         Buy-down Existing Affordable Housing Units ......................................................... 34
      8.2.3         Buy-down Market Rate Units ..................................................................................... 34
    8.3      Build Affordable Units on Town Land .............................................................................. 35
    8.4      Zoning Strategies................................................................................................................. 35
      8.4.1         Rentals .......................................................................................................................... 35
      8.4.2         Cottage Homes / Starter Homes ................................................................................ 36
      8.4.3         Accessory Dwelling Units ........................................................................................... 36
      8.4.4         Mixed Use Village Overlay District ........................................................................... 37
      8.4.5         Smart Growth Zoning ................................................................................................. 37
    8.5      Harmony with Environmental and Architectural Characteristics of Bolton .................. 38
    8.6      Education and Outreach ..................................................................................................... 38
9     Conclusion .................................................................................................................................. 40

                                                                                                                                                       3
1 Executive Summary
Bolton has been a small rural town that is transforming into a more suburban bedroom
community. This is largely a result of the significant growth that the Town has experienced
over the past few decades as development pressures move west from Boston beyond the Route
495 corridor.
Based on currently available information, we believe the key demographic trend that Bolton
should plan for is the increasing share of the “65+ population” in the Town’s overall
population. For example, one study projects that residents in the 65+ age bracket will represent
25% of the Town’s total population by 2030.1 In addition, Bolton’s senior population, many of
whom are retired, has a particular need for affordable housing options because they generally
have fewer financial resources than Bolton’s younger residents, most of whom are employed.
Bolton faces several challenges in promoting affordable housing:
▪ Bolton has no municipal water or sewer services, making denser development more
costly and difficult. This raises concerns among residents about water supply and the
potential water quality impacts of any new denser development.
▪ Local zoning provides substantial obstacles to creating affordable housing
developments. Current regulations would have to be reformed, or in many cases
overridden through “friendly” comprehensive permits,2 to overcome these barriers.
Zoning for accelerated growth raises local concerns about capacity and the small-town
environmental and architectural characteristics of the community.
▪ The Town’s hilly topography, extent of ledge, poor soils for septic systems, wetlands,
and other environmental constraints limit the amount of land that is developable and
make development significantly more costly.
▪ Bolton has one primary transportation artery: Route 117/Main Street. During peak
commuting hours, Route 117 is very congested and slow-moving.
▪ As in other communities, current residents may resist affordable housing developments
or other perceived changes in the status quo.
Despite these constraints, the Town is committed to making progress in boosting its supply of
affordable units. Based on our work over the past year, the Housing Production Plan
Committee (HPPC) believes that one of the Town’s best strategies for increasing its stock of
affordable housing should be to support an appropriately sited rental complex — ideally one
that would also serve the needs of the senior population.
1 See infra Table 3-3. See also Population and Housing Demand Projections for Metro Boston, Regional
Projections and Provisional Municipal Forecasts, prepared by the Metropolitan Area Planning Council
(MAPC), January 2014.
2 See infra Section 5.5.
42 Introduction
The Town of Bolton is located in the metropolitan Worcester area just 10 miles northeast of
Worcester and 30 miles west of Boston. The Town is bordered by Harvard, Stow, Hudson,
Berlin, Clinton, and Lancaster.
In recent years, Bolton has experienced substantial residential development growth. This
activity has been spurred by Bolton’s appeal as an attractive rural community, as well as the
economic growth in the Central Massachusetts region. Local leaders would like to engage in
proactive community planning to better guide continued growth in a way that produces more
affordable housing. This Housing Production Plan update is the first step of a larger process
that will also include updating the Town’s overall Master Plan.
This Housing Production Plan also comes at a time when the Commonwealth of Massachusetts
is experiencing an affordable housing crisis.3 The price of single-family homes in Massachusetts
has risen faster than any other state, and people are also struggling to make rent.4 Employers
are growing concerned that there is not adequate housing available to the workforce. Our
region is also planning for a demographic shift in which seniors occupy a larger slice of the
population. Given these trends, it is essential for Bolton to act boldly to develop affordable
housing options.
2.1 Why is Bolton Preparing a Housing Production Plan?
A Housing Production Plan (HPP) is a document that sets forth a community’s proactive
strategy for planning and developing affordable housing.
Bolton first prepared an HPP in 2003. This 2020 version provides updated information on
demographic, economic, and housing trends and characteristics. It also recommends strategies
to address unmet local housing needs.
There are several benefits of preparing an HPP:
▪ It provides important information on demographic and economic trends that have a
bearing on future local and regional housing needs.
▪ It offers greater local control over affordable housing development. Communities with
a DHCD-certified HPP that make measurable progress in reaching their 10% affordable
housing goal will be able to have more control over determining which Chapter 40B5
comprehensive permit applications are most appropriate and reflective of local needs
for a period of time.
3 See https://medium.com/@MassEOHED/mass-economy-is-at-risk-four-economic-development-chiefs-
say-2e9a4f6f370a (statement from four former Secretaries of Housing and Economic Development).
4 Id.
5 See infra Sections 5.5 and 8.1.
5▪ It provides a detailed analysis of the local and regional housing dynamic, analyzing
how market prices affect residents’ ability to pay based on various income levels and
target populations.
▪ It analyzes potential development opportunities to help diversify local housing to
address the range of identified local housing needs.
▪ It identifies what resources are available to support affordable housing development
and how the Town can most strategically leverage local investment.
▪ It includes important data that can be used in applying for public and private sources of
financial and technical support for affordable housing development or other
community needs.
▪ It offers a useful educational tool to help dispel misinformation and negative
stereotypes regarding affordable housing, with the ultimate goal of strengthening local
public support for new affordable housing initiatives.
▪ It demonstrates the community’s intent to proactively address local housing issues.
2.2 What is Affordable Housing?
In Massachusetts, the Department of Housing and Community Development (DHCD) has
established a goal that each community should have 10% of the community’s year-round
housing stock be deemed “affordable.” For the purposes of DHCD’s definition, the homes must
be affordable to individuals and families at or below 80% of the area’s median income, adjusted
for household size. These homes must also have deed restrictions in place which keep them
affordable over the long term.
Housing affordability is measured by comparing the income of a household against its housing
costs. A generally accepted standard is that housing is affordable when a household pays no
more than 30% of its annual income for rent or mortgage.
More specifically, the federal government identifies units as affordable if gross rent (including
costs of utilities borne by the tenant) is no more than 30% of a household’s net or adjusted
income, or if the carrying costs of purchasing a home (mortgage, property taxes, and insurance)
are not more than 30% of gross income. If households are paying more than these thresholds,
they are described as experiencing housing affordability problems or cost burdens. If they are
paying 50% of more for housing, they have severe housing affordability problems. Affordable
housing is also defined according to its availability to households at percentages of median
income for the area,6 and most housing subsidy programs are targeted to particular income
ranges, depending upon the programs’ goals.
6Bolton is currently part of the Eastern Worcester County, MA U.S. Department of Housing and Urban
Development (HUD) Metro Fair Market Rent (FMR) Area.
6▪ Extremely Low-Income housing is directed to those earning at or below 30% of area
median income (AMI) as defined by the U.S. Department of Housing and Urban
Development (up to $30,150 for a family of three for the Eastern Worcester County area
in FY2020).
▪ Very Low-Income is defined as households earning between 31% and 50% of area
median income (limit of $50,250 for a family of three in our area).
▪ Low to Moderate-Income generally refers to the range between 51% and 80% of area
median income ($70,650 for a family of three in our area).7 This is the group that most
comprehensive permits are targeted to help.
The table below shows the specific income thresholds applicable to Bolton as of FY2020.
Table 2-1: Income Limits for the Eastern Worcester County
MA HUD Metro FMR Area, FY2020
2.3 Bolton’s Existing and Proposed Affordable Housing
Bolton first began to focus on the issue of affordable housing in the early 1990s. The Town
created its Affordable Housing Partnership in 1992, and it issued its first affordable housing
request-for-proposal in 1992 (for Bolton Woods Way).
In 2005, the Bolton Affordable Housing Trust Fund was established to promote the creation and
preservation of affordable housing for low- and moderate-income households. As part of this
fund, the Town formed a Board of Trustees comprised of six members; three of which are
members of the Board of Selectmen. Monies paid into and out of the Trust do not need to be
appropriated, accepted or approved by Town Meeting. The powers of the Board of Trustees are
carried out in accordance with Massachusetts General Laws c.44 §55C.
7A family of three is illustrated here and is used in affordability calculations because the average
household size in Bolton is 3.05 persons according to 2017 census estimates from the American
Community Survey.
7Since 2013, the Town of Bolton has also participated in the Assabet Regional Housing
Consortium along with other local communities including Boxborough, Devens, Harvard,
Hudson, Littleton and Stow. The Consortium works directly with an affordable housing
consultant who provides assistance in monitoring each community’s affordable housing stock
while also performing regional affordable housing activities. These activities have included
affordable housing fairs and Council on Aging workshops to provide education to those
seeking to apply for affordable housing units. The cost associated with participating in this
Consortium is paid from the Affordable Housing Trust Fund.
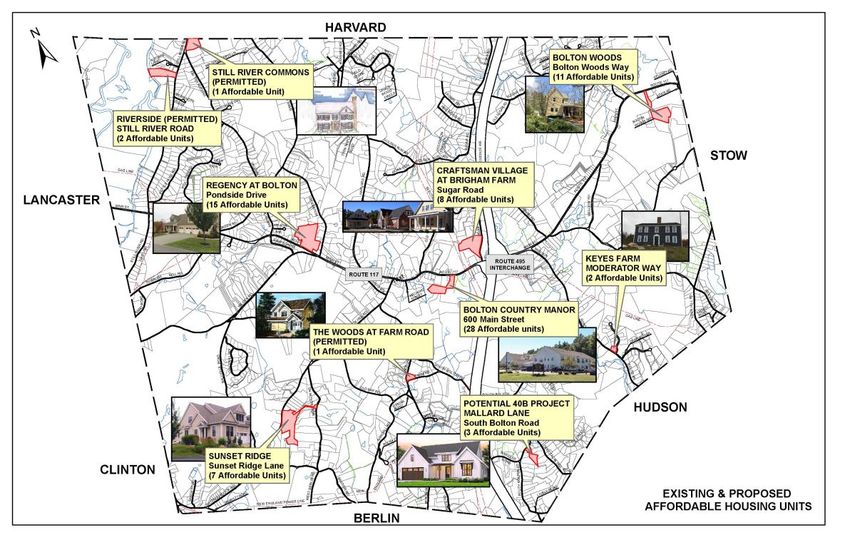
Below are a map and descriptions of Bolton’s existing and proposed affordable housing.
▪ Bolton Woods (1992).8 Bolton Woods is located on Bolton Woods Way off of Main
Street (Route 117) near the Stow town line. It is a community of 28 single family homes
in which 50% (14 units) of the homes were originally sold to income-eligible first-time
homebuyers. Over time, three of the affordable units have been sold off the program
and are no longer included as part of Bolton’s subsidized housing inventory (SHI).
Eleven affordable units remain with non-universal deed restricted units.
▪ Bolton Country Manor (2003). Bolton Country Manor is located at 600 Main Street. It is
a 28-unit elderly housing rental property developed in conjunction with the Bolton
Housing Authority and HUD. Built in 2003, it features community space9 for local
senior citizens and it targets the very low-income seniors in the community. There is an
8 The dates in parentheses reflect the year a comprehensive permit was issued.
9 The Bolton Country Manor is also where the Town’s Council on Aging office is located.
8extensive waiting list to rent one of these units. All 28 rental units are included in
Bolton’s SHI.
▪ Regency at Bolton (2005). The Regency at Bolton is located on Pondside Drive (private
way) off of Main Street near the intersection of Wilder Road. This development is an
affordable, age-restricted (55+) townhouse community consisting of 60 units, 15 of
which are affordable. The project was built through the mid-2000s and completed in
2012. It is located on the site of an old campground, and it has a small clubhouse for
community usage.
▪ Sunset Ridge (2005). Sunset Ridge is located on Sunset Ridge Lane (private way) off of
Wattaquadock Hill Road. This development is an affordable community of 28
townhouses. Built through the 40B program, it was completed in 2014. Of the 28 units,
seven (7) are considered affordable and are included in Bolton’s SHI.
▪ Craftsman Village at Brigham Farm (2015). Craftsman Village at Brigham Farm is
located off of Sugar Road across from Colonial Candies. It is a community of 30
bungalow-style single family homes built within a condominium structure. Eight (8) of
the homes are considered affordable.
▪ Tadmor (2018). Tadmor is located on Goose Pond Path off of Main Street adjacent to the
Department of Public Works facility and the corner of Forbush Mill Road. This is an 11-
lot subdivision being developed in accordance with the Town’s Farmland and Open
Space Planned Residential Development bylaw (§ 250-14). Per the bylaw, either one
affordable unit will be constructed, or the developer will provide a buyout.
▪ Keyes Farm (2018). Keyes Farm is located on Moderator Way off of Hudson Road
(Route 85) near the intersection of Danforth Lane. This is an 18-lot subdivision being
developed in accordance with the Town’s Farmland and Open Space Planned
Residential Development bylaw (§ 250-14). To satisfy the requirements of the bylaw, the
developer provided two units of affordable housing by renovating an existing
farmhouse on the parcel. Once these two units are approved by DHCD, they will be
added to Bolton’s SHI.
▪ Riverside (2007). Riverside is located on Still River Road near the intersection of
Autumn Lane. It is a small, six-unit townhouse property that will provide two units of
affordable housing. A timeframe for construction has not been established.
▪ Mallard Lane (pending). Mallard Lane is located on South Bolton Road near the
intersection of Spectacle Hill Road. It is a proposed 40B development that would consist
of 11 detached cottage style units, three of which would be affordable. These units are
anticipated to be deed restricted to seniors.
▪ Still River Commons (2020). Still River Commons is located on Still River Road at the
Harvard town line. This development consists of four single-family dwelling units, one
of which will be affordable. Construction is anticipated to begin in the spring of 2021.
9▪ The Woods at Farm Road (pending). The Woods at Farm Road is located at the
intersection of Berlin and Farm Roads. This development consists of four single family
dwelling units, one of which would be affordable. Construction is anticipated to begin
in the spring of 2021.
2.4 Fees / Property In Lieu
In addition to creating specific units of affordable housing, Bolton can also support affordable
housing initiatives by receiving fees or property from developers “in lieu of” housing units, in
compliance with Bolton’s Inclusionary Housing Bylaw (§ 250-27). A developer may contribute
a fee or land to the Bolton Affordable Housing Trust Fund or other 501(c)(3) fund as designated
by the Planning Board in lieu of constructing affordable units within the locus of a proposed
housing development. Below is a summary of such fees or property in lieu of actual units:
▪ Century Mill Estates (2007). Century Mill Estates is located on Mill Pond Road off of
Spectacle Hill Road. This 78-lot development was permitted before Bolton had passed
its Inclusionary Housing bylaw (§ 250-27). Through negotiations, the Town secured an
agreement from the developer to either provide three lots for affordable housing or
donate fees-in-lieu based on the undeveloped appraised value of the lots. To date, the
developer has provided $133,056 to the Affordable Housing Trust Fund. Two more
payments are anticipated.
▪ Houghton Farm (2012). Houghton Farm is located on Houghton Farm Lane off of Sugar
Road near the intersection of Golden Run Road. This 15-lot development includes one
buildable lot identified as Lot 15 off of Golden Run Road that was donated to the
Affordable Housing Trust Fund pursuant to the Inclusionary Housing bylaw. The
proposed septic system for Lot 15 is engineered for a five (5) bedroom single family
dwelling.
102.5 Housing Goals
The mission of the HPPC has been to develop a plan of action for a phased growth strategy to
increase the number of year-round affordable housing units in Bolton. Under state law, if fewer
than 10% of the housing units in a community are considered affordable, developers are able to
invoke Chapter 40B to bypass some local planning and zoning regulations. As of 2020, per
DHCD’s SHI, only 3.99% of housing in Bolton was considered affordable.10
This Plan aims to articulate a strategy for achieving growth of affordable housing in Bolton.
This strategy directly addresses Bolton’s housing needs, and is intended to be consistent with
Bolton’s historic environmental and architectural characteristics.
Bolton’s affordable housing goals are to:
▪ Establish a realistic plan to achieve and maintain an SHI of at least 10%.
▪ Increase the diversity of housing types to meet the needs of a greater variety of
households.
▪ Reform local zoning to better direct development and encourage affordable housing.
▪ Ensure that new housing is in harmony with the environmental and architectural
characteristics of the community.
▪ Promote affordable housing through education and outreach.
10 See infra Section 5.5
113 Demographic Profile
This section of the plan examines demographic characteristics and trends to understand the
composition of the population and how it relates to current and future housing needs. 11 Key
questions to be addressed include:
▪ What have been the historical growth trends in the community?
▪ What are the ramifications of increases and decreases of various age groups in regard to
housing needs?
▪ What are the variations in household size and types of households that suggest specific
housing needs?
3.1 Population Growth
Bolton’s population expanded considerably after World War II, growing from 956 residents in
1950 to 1,905 residents by 1970. In addition, economic opportunities in the Central
Massachusetts region (particularly the tech sector) spurred population growth from 1980-2000.
As shown in Table 3-1, Bolton’s population doubled from 1980 to 2017.
Table 3-1: Population Change, 1930-2017
Year Total Population Change in Number Percentage Change
1930 764 n/a n/a
1940 775 11 1.4%
1950 956 181 23.4%
1960 1,264 308 32.2%
1970 1,905 641 50.7%
1980 2,530 625 32.8%
1990 3,134 604 23.9%
2000 4,148 1,014 32.4%
2010 4,897 749 18.1%
2017 5,167 270 5.5%
Source: United States Census; American Community Survey (2013-2017)
Although population growth is affected by a number of factors and therefore not entirely
predictable, it is reasonable to assume that Bolton’s total population will be approaching 6,000
by the year 2030. (See infra Table 3-4.)
11This Housing Needs Assessment includes the most recent available data. The decennial census data is
typically provided because it reflects actual counts. The most recent issue of the Census Bureau’s
American Community Survey (ACS) is also shown where available. However, because the ACS is based
on a sample, it is subject to sampling error and variation.
123.2 Age Distribution
Table 3-2 presents census data on changes in the distribution of ages from 2000 through 2017.
An important trend to note is the portion of Bolton’s population that is age 65 or over. As of
2017, over 12% of residents were in that age group.
Table 3-2: Age Distribution, 2000-2017
2000 2010 2017
Age Range
# % # % # %
Under 5 years 331 8.0% 285 5.8% 253 4.9%
5 - 19 years 977 23.6% 1242 25.4% 1293 25.0%
20 - 24 years 93 2.2% 167 3.4% 187 3.6%
25 - 34 years 389 9.4% 268 5.5% 299 5.8%
35 - 44 years 904 21.8% 696 14.2% 658 12.7%
45 - 54 years 778 18.8% 1064 21.7% 1039 20.1%
55 - 59 years 275 6.6% 411 8.4% 377 7.3%
60 - 64 years 143 3.4% 301 6.1% 427 8.3%
65 - 74 years 156 3.8% 311 6.4% 416 8.1%
75 - 84 years 87 2.1% 103 2.1% 150 2.9%
85+ years 15 0.4% 49 1.0% 68 1.3%
TOTAL 4,148 100.0% 4,897 100.0% 5,167 100.0%
Age 65+ 258 6.2% 463 9.5% 634 12.3%
Median Age 38.3 42.8 42.7
Source: United States Census; American Community Survey 5-Year Estimates
On the next page, Tables 3-3 and 3-4 present population projections for 2020 and 2030. We
have included two sources to offer readers a range of predicted estimates.
13As illustrated below, the trend of an increasing “65+ population” is expected to continue well
into the future. Roughly 20-25% of Bolton’s residents will likely be in that age bracket by the
year 2030.
Table 3-3: Age Distribution, 2010 Census and MAPC Projections for 2020 and 2030
2010 Census 2020 Projection 2030 Projection
Age Range
# % # % # %
Under 5 years 285 5.8% 131 2.6% 162 3.2%
5 - 19 years 1242 25.4% 1041 20.8% 770 15.2%
20 - 24 years 167 3.4% 170 3.4% 146 2.9%
25 - 34 years 268 5.5% 362 7.2% 393 7.8%
35 - 44 years 696 14.2% 586 11.7% 705 14.0%
45 - 54 years 1064 21.7% 862 17.2% 764 15.1%
55 - 59 years 411 8.4% 564 11.3% 360 7.1%
60 - 64 years 301 6.1% 453 9.1% 456 9.0%
65 - 74 years 311 6.4% 554 11.1% 804 15.9%
75 - 84 years 103 2.1% 220 4.4% 400 7.9%
85+ years 49 1.0% 55 1.1% 91 1.8%
TOTAL 4,897 100.0% 4,998 100.0% 5,051 100.0%
Under 20 1527 31.2% 1172 23.4% 932 18.5%
Age 65+ 463 9.5% 829 16.6% 1295 25.6%
Source: Metropolitan Area Planning Council (MAPC), January 2014
Table 3-4: Age Distribution, 2010 Census and Donahue Inst. Projections for 2020 and 2030
2010 Census 2020 Projection 2030 Projection
Age Range
# % # % # %
Under 5 years 285 5.8% 213 3.8% 248 4.1%
5 - 19 years 1242 25.4% 1158 20.5% 1072 17.9%
20 - 24 years 167 3.4% 245 4.3% 272 4.5%
25 - 34 years 268 5.5% 412 7.3% 481 8.0%
35 - 44 years 696 14.2% 628 11.1% 669 11.2%
45 - 54 years 1064 21.7% 982 17.3% 883 14.7%
55 - 59 years 411 8.4% 589 10.4% 566 9.4%
60 - 64 years 301 6.1% 463 8.2% 518 8.6%
65 - 74 years 311 6.4% 642 11.3% 787 13.1%
75 - 84 years 103 2.1% 255 4.5% 409 6.8%
85+ years 49 1.0% 73 1.3% 90 1.5%
TOTAL 4,897 100.0% 5,660 100.0% 5,995 100.0%
Under 20 1527 31.2% 1371 24.2% 1320 22.0%
Age 65+ 463 9.5% 970 17.1% 1286 21.5%
Source: University of Massachusetts Donahue Institute, State Data Center
143.3 Racial Composition
Bolton is not currently very diverse, but the trend has been toward an increasingly diverse
racial composition. Compared to the rest of the state, Bolton is largely racially homogeneous.12
Table 3-5: Racial Information, 2000-2017
Population 2000 2010 2017
Characteristics # % # % # %
White 4,055 97.8% 4,649 94.9% 4,823 93.3%
Minority 93 2.2% 248 5.1% 344 6.7%
Asian 54 1.3% 130 2.7% 231 4.5%
Black 8 0.2% 23 0.5% 21 0.4%
Amer. Ind. 2 0.0% 7 0.1% 0 0.0%
2+ races 20 0.5% 79 1.6% 92 1.8%
Lat./Hisp. 33 0.8% 87 1.8% 193 3.7%
Source: United States Census, 2000 Summary File, 2010 Summary File; ACS 5-Year Estimates
3.4 Household Composition
Household composition in Bolton has remained consistent, with the vast majority of residents
(over 80%) being part of a family household. We also have a consistent trend of owner-
occupied households (roughly 93%) outnumbering renter-occupied households (7%).
Table 3-6: Household Characteristics, 2000-2017
Type of 2000 2010 2017
Household # % # % # %
Households 1,424 100.0% 1,670 100.0% 1,686 100.0%
Families 1,202 84.4% 1,391 83.3% 1,387 82.3%
Married Family 1,097 77.0% 1,241 74.3% 1,345 79.8%
Fem.-head Family 73 5.1% 103 6.2% 19 1.1%
Non-families 222 15.6% 279 16.7% 299 17.7%
Avg. household size 2.91 persons 2.93 persons n/a
Avg. family size 3.18 persons 3.22 persons n/a
Source: United States Census, 2000 Summary File, 2010 Summary File; ACS 5-Year Estimates
12 According to 2019 ACS data, Massachusetts as a whole is approximately 30% non-white.
15Table 3-7: Types of Households by Size, 2000-2017
Households by 2000 2010 2017
Type and Size # % # % # %
Owner-occupied 1,330 100.0% 1,542 100.0% 1,565 100.0%
1-person 117 8.8% 148 9.6% 174 11.1%
2-person 480 36.1% 538 34.9% 470 30.0%
3-person 267 20.1% 303 19.6% 347 22.2%
4-person 300 22.6% 357 23.2% 574 36.7%
5-person 121 9.1% 128 8.3% n/a n/a
6-person 34 2.6% 51 3.3% n/a n/a
7+ person 11 0.8% 17 1.1% n/a n/a
Renter-occupied 94 100.0% 128 100.0% 121 100.0%
1-person 42 44.7% 54 42.2% 72 59.5%
2-person 35 37.2% 41 32.0% 10 8.3%
3-person 8 8.5% 12 9.4% 0 0.0%
4-person 6 6.4% 15 11.7% 39 32.2%
5-person 2 2.1% 5 3.9% n/a n/a
6-person 1 1.1% 1 0.8% n/a n/a
7+ person 0 0.0% 0 0.0% n/a n/a
Total 1,424 1,670 1,686
Source: United States Census, 2000 Summary File, 2010 Summary File; ACS 5-Year Estimates
164 Economic Profile
This section examines income and other issues related to economic status to address the
following questions:
▪ What changes in income levels have occurred and how does this relate to housing
affordability?
▪ Are there growing income disparities among residents?
▪ What are the relative incomes of Bolton residents and those with local jobs?
▪ What are the trends toward educational attainment that can affect employment
opportunities and one’s ability to afford housing?
▪ What proportion of the population is disabled or has other special needs that limit their
employment options and income?
4.1 Income
Generally speaking, Bolton’s current residents are economically well-to-do. In 2017, the median
household income was $125,741.
However, as shown in Table 4-2, Bolton’s senior residents (age 65+) have limited financial
means, with a median income of $59,318.
Table 4-1: Income Distribution by Household, 2000-2017
Income 2000 2010 2017
Range # % # % # %
Under $10,000 23 1.6% 6 0.4% 101 6.2%
$10,000 - 24,999 46 3.2% 98 5.8% 76 4.7%
$25,000 - 34,999 70 4.9% 59 3.5% 51 3.1%
$35,000 - 49,999 122 8.5% 73 4.3% 66 4.0%
$50,000 - 74,999 199 13.9% 152 9.0% 194 11.9%
$75,000 - 99,999 217 15.2% 130 7.7% 146 8.9%
$100,000 - 149,999 392 27.5% 314 18.6% 373 22.8%
$150,000 + 358 25.1% 854 50.7% 627 38.4%
Total 1427 100.0% 1686 100.0% 1634 100.0%
Median
$102,798 $151,618 $125,741
Household
Source: United States Census; American Community Survey 5-Year Estimates
17Table 4-2: Median Income by Household Type, 2017
Type of Household / Householder Median Income
Households $151,618
Families $161,467
Nonfamilies $59,205
Householder age 25 to 44 $165,962
Householder age 45 to 64 $156,453
Householder age 65 or more $59,318
Full-time, year-round male workers $112,024
Full-time, year-round female workers $82,583
Source: United States Census; American Community Survey 5-Year Estimates
Most people in Bolton own a home rather than rent (in 2017, 93% vs. 7%). Table 4-3 illustrates a
difference between renters and homeowners: in general renters are in lower income ranges.
Table 4-3: Income Distribution of Renters/Owners, 2000 & 2017
Renters Homeowners Renters Homeowners
Income Range 2000 2017
# % # % # % # %
Under $10,000 20 21.3% 7 0.5% 0 0.0% 6 0.4%
$10,000-$24,999 11 11.7% 34 2.6% 38 31.4% 60 3.8%
$25,000-$49,999 19 20.2% 165 12.4% 17 14.0% 115 7.3%
$50,000-$74,999 13 13.8% 190 14.3% 10 8.3% 142 9.1%
$75,000-$99,999 25 26.6% 195 14.7% 20 16.5% 110 7.0%
$100,000-$149,000 6 6.4% 376 28.3% 17 14.0% 297 19.0%
$150,000 + 0 0.0% 363 27.3% 19 15.7% 835 53.4%
Total 94 100.0% 1330 100.0% 121 100.0% 1565 100.0%
Source: United States Census; American Community Survey 5-Year Estimates
4.2 Poverty
Although there are few Bolton residents in poverty according to the census data, poverty in the
senior population (age 65+) is ticking up.
Table 4-4: Poverty Status, 2000-2017
2000 2010 2017
Type of Resident
% % %
All Individuals 1.8% 2.3% 1.4%
All Families 1.1% 0.8% 1.4%
Female Headed
Families 7.4% 18.6% 0.0%
Related Children
Under 18 Years 2.0% 1.5% 0.0%
Individuals 65+ 3.5% 0.7% 1.4%
Source: United States Census; American Community Survey 5-Year Estimates
184.3 Employment
The table below shows information about the types of employment taking place in Bolton. It
should be recognized that Bolton is a very traditional “bedroom” community. Commercial
development areas and employment opportunities within the community itself are limited.
Table 4-5: Average Employment and Wages by Industry, 2000-2017
Industry # Establishments Total Wages Average Employment Average Weekly Wage
Construction 15 $1,886,823 91 $1,595
Manufacturing 5 $2,041,101 164 $957
Trade,
Transporation & 26 $4,822,181 278 $1,334
Utilities
Information 7 $344,235 22 $1,204
Financial
16 $581,226 31 $1,442
Activities
Professional & 50 $4,641,769 237 $1,507
Business Services
Education &
23 $5,178,311 392 $1,016
Health Services
Leisure &
11 $2,014,415 316 $490
Hospitality
Other Services 12 $210,146 31 $521
Source: Massachusetts Executive Office of Labor and Workforce Development (Employment & Wages Report, Third Quarter 2018)
4.4 Disability Status
The following two tables provide data about Bolton’s disabled population, including more
specific information about the types of disabilities among the senior population.
Table 4-6: Population Five Years and Over with Disabilities, 2017
Bolton Worcester County Massachusetts
Age Range
# % of total # % of total # % of total
Under 18 years 44 3.1% 8,531 4.8% 61,659 4.5%
18 to 64 years 153 4.9% 51,055 9.9% 389,450 9.0%
65 + years 107 16.9% 38,054 33.3% 330,631 32.7%
Total 304 5.9% 97,640 12.1% 781,740 11.6%
Source: United States Census; American Community Survey 5-Year Estimates
19Table 4-7: Types of Disabilities Among Population Age 65+, 2018
Population Characteristic Bolton % of 65+ State % of 65+
Hearing impairment 13.1% 16.1%
Vision impairment 0.9% 1.5%
Cognition impairment 7.1% 8.3%
Mobility impairment 3.0% 3.9%
Self-care impairment 5.7% 7.9%
Independent living impairment 9.6% 14.3%
Source: Tufts Health Plan Foundation, Massachusetts Healthy Aging Community Profile (Bolton, 2018)
205 Housing Profile and Needs Assessment
Bolton’s housing values continue to be among the highest in the region, so it remains difficult
for lower-income individuals and families to find housing they can afford in the private market.
Without subsidies or zoning relief, the private market is neither able nor interested in
producing housing that is affordable to low- and moderate-income households. As a result, it is
necessary to rely on regulatory relief and housing subsidies to preserve affordable housing and
to produce enough units to meet existing affordable housing needs and demands.
Escalating market prices for both the purchase and rental of housing have generated concerns
that many long-term residents might be experiencing difficulties paying their taxes, maintaining
their homes, or paying their rent. Many residents – particularly seniors – have few options
other than to leave Bolton. Some children who grew up in town cannot find housing in which
to raise their families.
This section presents an overview of the current housing situation in Bolton. It summarizes
housing characteristics and trends, analyzes the housing market from a number of different
sources and perspectives, compares what housing is available to what residents can afford,
summarizes what units are defined as affordable by the state, and helps establish the context for
identifying priority housing needs.
Target Market for Affordable Housing:
Overall, the needs assessment indicates that Bolton needs housing suitable for smaller
families/households, town and regional school district employees, seniors in general, and
seniors with limited means. There is also an identified need for rental housing that could
meet the needs of many of these demographic groups.
5.1 Housing Growth
Over the last half century, the predominant housing type constructed in Bolton has been
detached single family homes on individual lots. These lots have historically had a minimum
threshold of 1.5 to 2 acres of land per homesite, according to local zoning rules.
Table 5-1: Housing Units by Year Structure Was Built
Time Period #of units %
2010 - 2013 97 5.8%
2000 - 2009 333 19.8%
1980 - 1999 582 34.5%
1960 - 1979 395 23.4%
1940 - 1959 96 5.7%
1939 or earlier 183 10.9%
1,686 100.0%
Source: United States Census; American Community Survey (2013-2017)
21Table 5-2: Residential Building Permits, 1999-2018
Year # Building Permits 5-Year
for New Units Average
1999 54
2000 42
2001 34 37
2002 29
2003 26
2004 25
2005 25
2006 17 19.6
2007 25
2008 6
2009 29
2010 38
2011 13 24
2012 20
2013 20
2014 17
2015 22
2016 28 25.6
2017 25
2018 36
5.2 Housing Occupancy
Table 5-3: Housing Occupancy, 2000-2017
Housing 2000 2010 2017
Characteristics # % # % # %
Total Housing Units 1,476 1,738 1,772
Total Occupied Units 1,424 96.5% 1,670 96.1% 1,686 95.1%
Total Vacant Units 52 3.5% 68 3.9% 86 4.9%
Owner-Occupied Units* 1,330 93.4% 1,542 92.3% 1,565 92.8%
Renter-Occupied Units* 94 6.6% 128 7.7% 121 7.2%
Avg. Household Size
2.99 3.01 3.11
(Owner Occupied Unit)
Avg. Household Size
1.87 2.05 2.25
(Renter Occupied Unit)
Source: United States Census, 2000 Summary File, 2010 Summary File; ACS 5-Year Estimates
* = percentage of total occupied units
225.3 Housing Values
As shown in the table below, Bolton’s housing values have increased over the past two decades.
For example, in the year 2000, a total of 40.6% of housing was valued at $299,999 or less. By the
year 2017, only 11% of housing was $299,999 or less. This is likely the result of inflation,13
zoning barriers to affordable housing, and the development of higher priced homes.
Table 5-4: Housing Values of Owner-Occupied Units, 2000-2017
Price 2000 2011 2017
Range # % # % # %
Less than $100,000 7 0.6% 31 2.2% 24 1.5%
$100,000-199,999 108 9.5% 22 1.6% 39 2.5%
$200,000-299,999 345 30.5% 121 8.6% 109 7.0%
$300,000-499,999 513 45.3% 499 35.5% 669 42.7%
$500,000-999,999 148 13.1% 713 50.7% 696 44.5%
$1,000,000 or more 12 1.1% 19 1.4% 28 1.8%
Total 1,133 1,405 1,565
Median $329,200 $512,700 $485,200
Source: United States Census, 2000 Summary File, 2010 Summary File; ACS 5-Year Estimates
The following table shows Bolton’s median sales data for the years 2000 through 2019. For both
single-family and condominium sales, there has been a marked increase in the median sale price
for housing. Given the consistent high prices within the community, private development is
solely focused on creating additional high-priced homes. This dynamic contributes to an
overall lack of housing diversity within the Town.
Table 5-5: Median Sales Data, 2000-2019
Single Family 2-Family 3-Family Condominiums All Sales
Year
Median # Sales Median # Sales Median # Sales Median # Sales # Sales
2019 $ 597,500 78 $ - 2 $ - 0 $ 529,900 7 87
2018 $ 572,500 86 $ - 1 $ - 0 $ 459,000 13 100
2017 $ 541,000 94 $ - 0 $ - 0 $ 452,655 10 104
2016 $ 481,250 106 $ - 1 $ - 0 $ 412,500 10 117
2015 $ 546,250 94 $ - 1 $ - 0 $ 440,000 13 108
2014 $ 465,000 83 $ - 1 $ - 0 $ 360,000 12 96
2013 $ 425,000 67 $ - 0 $ - 0 $ - 2 69
2012 $ 443,375 74 $ - 1 $ - 0 $ 345,000 7 82
2011 $ 465,000 59 $ - 0 $ - 0 $ 337,001 8 67
2010 $ 445,000 59 $ - 0 $ - 0 $ 402,059 16 75
2009 $ 450,000 49 $ - 1 $ - 0 $ 340,263 10 60
2008 $ 532,500 44 $ - 0 $ - 0 $ 275,560 4 48
2007 $ 574,850 62 $ - 1 $ - 1 $ - 0 64
2006 $ 587,500 67 $ - 0 $ - 0 $ - 0 67
2005 $ 585,000 95 $ - 1 $ - 0 $ - 0 96
2004 $ 528,250 88 $ - 1 $ - 1 $ - 0 90
2003 $ 486,000 64 $ - 0 $ - 0 $ - 0 64
2002 $ 455,000 93 $ - 0 $ - 0 $ - 0 93
2001 $ 499,900 73 $ - 1 $ - 0 $ - 0 74
2000 $ 420,000 119 $ - 0 $ - 0 $ - 0 119
Source: The Warren Group - custom data request
13 See https://www.usinflationcalculator.com/.
235.4 Affordability Analysis
Although many of Bolton’s residents are doing well financially, over a quarter of our
population is burdened by housing costs. As shown in Table 5-6 below, 26.5% of Bolton
households are spending 30% or more of their income on housing.
Table 5-6: Housing Costs as Percent of Household Income
% Household Income # of households %
Less than 20 % 809 48.8%
20 - 29 % 410 24.7%
30% or more 440 26.5%
1,659 100.0%
Source: United States Census; American Community Survey (2013-2017)
The housing cost burden is even greater for Bolton’s lower-income residents. As shown in
Table 5-7 below, of the households in Bolton whose income is $75,000 or below, nearly 73% of
them are spending 30% or more of their income on housing.
Table 5-7: Housing Costs for Households Under $75,000
% Household Income # of households %
Less than 20 % 67 18.6%
20 - 29 % 31 8.6%
30% or more 263 72.9%
361 100.0%
Source: United States Census; American Community Survey (2013-2017)
5.5 Subsidized Housing Inventory (SHI): Existing and Proposed
The Massachusetts Comprehensive Permit Law, Chapter 40B, §§ 20-23 of the General Laws, was
enacted as Chapter 774 of the Acts of 1969 to encourage the construction of affordable housing
throughout the state, particularly outside of cities. Often referred to as the Anti-Snob Zoning
Act, it requires all communities to use a streamlined review process through the local Zoning
Board of Appeals for “comprehensive permits” submitted by developers for projects proposing
zoning and other regulatory waivers and incorporating affordable housing for at least 25% of
the units. Only one application is submitted to the ZBA instead of separate permit applications
that are typically required by a number of municipal departments as part of the normal
regulatory process. The ZBA takes the lead and consults with the other relevant departments
(e.g., Building Inspector, Planning, Fire Department, Board of Health, etc.) on a single
application. The Conservation Commission retains jurisdiction under the Wetlands Protection
Act with the Department of Environmental Protection, the Building Inspector applies the State
Building Code, and the Board of Health enforces Title 5.14
14 Title 5 rules specify how to install, use, and maintain septic systems.
24For a development to qualify under Chapter 40B, it must meet all of the following requirements:
▪ Must be part of a “subsidized” development built or approved by a public agency, non-
profit organization, or limited dividend corporation.
▪ At least 25% of the units in the development must be income-restricted to households
with incomes at or below 80% of area median income (or 20% of the units in rental
properties targeted to those earning at or below 50% AMI), with rents or sales prices
restricted to income levels defined each year by the U.S. Department of Housing and
Urban Development (HUD).
▪ Affordability restrictions must be in effect in perpetuity unless there is a justification for
a shorter term that must be approved by DHCD.
▪ Development must be subject to a regulatory agreement and monitored by a public
agency or non-profit organization.
▪ Project sponsors must meet affirmative fair housing marketing requirements.
The current SHI units formally approved by DHCD are listed in the following chart:
25In addition to the 69 units reflected above, the Town anticipates that another 10 units could be
added to the SHI in the next few years:
Table 5-8: Proposed Affordable Housing
Project Housing Total Affordable
Name Location Strategy Type Units Units Status
Keyes Under
Moderator Way Inclusionary Duplex 18 2
Farm Construction
Single Family
Riverside Still River Rd 40B & 1 Attached 6 2 To Be Built
Unit Condo
Goose Pond To Be To Be
Tadmor Inclusionary 11 1
Path Determined Determined
Still River Single Family
Still River Rd 40B 4 1 To Be Built
Commons Condo
The
Single Family
Woods at Farm Rd 40B 4 1 To Be Built
Condo
Farm Rd
Application
Mallard Single Family
South Bolton Rd 40B 11 3 to be
Lane Condo
Submitted
5.6 Priority Housing Needs
Bolton has transitioned from a rural town which was an agriculturally-based community to one
that is essentially a bedroom community for high-tech-based companies located along Route
495 and the greater Boston area. As such, the population has become more affluent, more
mobile, and generally consists of smaller households.
There is currently an increased supply of larger three- to four-bedroom stand-alone homes on
sizeable lots. It has also become clear that home values in Bolton have reached a level that
many children who may have grown up in Town can no longer afford. The increasing real
estate prices are making it difficult for town employees, regional school district employees,
young professionals, young families, and elderly current residents to afford Bolton.
Since the predominant housing type of larger single-family homes has been the focus of local
zoning requirements and building for years, we believe it is imperative to work toward offering
a broader range of housing types to address these changing demographics and housing needs.
Specifically, we believe the priority housing of the HPP should be the creation of smaller homes
for sale and for rent. This aids younger individuals and families in establishing themselves in
Bolton instead of looking at other communities for their first homes. Our growing senior
population would also benefit from housing with better accessibility that allows them to age in
place. Rental communities would aid in providing our more mobile society a base in Bolton,
and can provide an overall less expensive housing option for people who may have difficulty
securing the necessary resources for a mortgage.
266 Constraints and Challenges to Development
Bolton residents have historically preferred sparse residential development, supporting Town
policies and zoning that perpetuate rural development patterns. For example, a “Basic Lot” per
Bolton zoning requires each lot to have 80,000 square feet (just under two acres) of land. The
second common type of lot in Bolton is a “Backland Lot” which requires 4.5 acres of land per
home. These long-standing zoning preferences, along with the physical characteristics of land
in Bolton, create challenges to producing and preserving affordable housing. These and other
development constraints are discussed below.
6.1 Infrastructure
Bolton has no public water or sewer services for residential properties. Residents rely on
private wells and septic systems. Developers who provide appropriate wastewater treatment
facilities face higher development and operating costs. On the one hand, Bolton’s lack of
municipal infrastructure has contained the rate of development and population growth. On the
other hand, it has prevented the creation of more compact and dense developments in the
village areas of Town. Such developments would increase diversity of housing and reduce
pressures on rural, undeveloped land. Recent changes to DEP policies related to Public Water
Supplies have further curtailed the ability to develop smaller, denser communities.
6.2 Zoning
Bolton embraces zoning that maintains low housing densities in order to protect the
environment and maintain its small-town rural character. As described above, the minimum lot
area in the residential and agricultural district is 80,000 square feet, with a minimum frontage of
200 feet (see § 250-13). These requirements substantially constrain the construction of affordable
housing. Although the Town has added zoning which allows some clustering of homes in lieu
of providing open space, the amount of area necessary to build is still substantial.
6.3 Environmental Constraints
Environmental constraints in Bolton include wetlands, floodplains, steep slopes, bedrock, and
poor soils that make much of the Town’s vacant land ill-suited or economically infeasible for
development. For example, thin rocky soil and bedrock outcroppings found throughout Town
make the siting of septic systems particularly challenging. In addition, impervious soil
conditions coupled with shallow bedrock along many hillsides cause some localized wet
conditions. Although these challenges for development help preserve open space and the
Town’s rural character, they also limit the amount of land available for housing. As
development pressures and land values continue to rise, even challenging development sites
will become targets for new building activity, and increased development costs will be reflected
in higher housing prices.
276.4 Transportation
Bolton has very good highway access given the location of Route 495, which essentially bisects
the Town. The interchange at Routes 117 and 495 has been updated over the last several years
and now has signals at both the north and southbound on/off ramps. However, there are no
commuter rail stations in Town, nor are there any regular bus services which could transport
people from Town to a commuter rail station. It is therefore unsurprising that only 88 residents
(3.2% of Bolton’s workforce) claimed to use public transportation, according to 2017 estimates
from the U.S. Census Bureau’s American Community Survey.
6.5 Availability of Subsidy Funds
The Commonwealth of Massachusetts does offer some funds to subsidize certain types of
housing developments. Unfortunately, the availability of these funds has been on the decline,
and often the level of need within a community has been an important aspect of the State grant
scoring. Given the wealth in Bolton relative to other communities, other towns have a greater
opportunity to secure the scarce funding available.
6.6 Community Perceptions
In many communities, current residents are concerned about the impacts new development and
affordable housing could have on local services and the quality of life — and Bolton is no
exception. Some residents also have negative impressions of subsidized housing and question
whether there is a real need for such development in their town. Local opposition to new
affordable units is more the norm than the exception. On the other hand, residents are coming
to realize that increasing real estate prices are making it difficult for people (e.g., town
employees, young families, and elderly current residents) to afford Bolton.
6.7 Mitigation of Challenges and Constraints
Many of the items referenced are difficult to mitigate, but as a community we are making some
headway. We have recently approved a mixed-use zoning district in a section of Town by the
Route 495 interchange which allows for greater density for commercial as well as residential
development. Open Space Zoning has been approved to allow for greater home clustering, and
there was a recent proposal for the creation of Cottage Zoning which would allow for smaller
lots and smaller homes on certain parcels within the community.
With regard to infrastructure constraints, those are presently difficult to mitigate. Bolton is one
of largest and least dense communities in Massachusetts, making the prospect of a municipal
water or sewer system very expensive. As a component of this HPP, we are working to identify
parcels which may be able to support larger scale wastewater treatment facilities and
community water supplies which could support larger projects. We will also encourage
property owners to work together to create systems which may be suitable for multiple parcels
and uses.
287 Housing Production Goals
7.1 Housing Goals
The following goals are a result of the data collection and analysis completed as part of this Plan
to address the housing needs of Bolton.
▪ Establish a realistic plan to achieve and maintain an SHI of at least 10%.
▪ Increase the diversity of housing types to meet the needs of a greater variety of
households.
▪ Reform local zoning to better direct development and encourage affordable housing.
▪ Ensure that new housing is in harmony with the environmental and architectural
characteristics of the community.
▪ Promote affordable housing through education and outreach.
7.2 Production Goals
Bolton seeks to increase its supply of affordable housing units to at least 10% of its year-round
housing stock. Currently only 3.99% (or 69 units) of Bolton’s housing is considered affordable
according to Massachusetts General Laws c.40B, §20 through 23 (“Chapter 40B”) and as listed
on the State’s SHI.
Based upon the 2010 census, Bolton will need an additional 104 units of affordable housing to
reach 10%. Of course, the amount of affordable housing units needed to meet 10% will also be
adjusted based upon the 2020 census that is currently underway. Based upon the number of
building permits which have been issued (See Table 5.2), we estimate that the housing stock will
climb by roughly 245 housing units. This would add roughly another 25 needed units to the
104 needed units referenced above, bringing our total projected need (to reach the 10%
affordability goal) of 129 additional affordable housing units.
A community with a certified HPP can secure “safe harbor” for a period of one or two years if
they are making steady progress towards achieving the overall 10% affordable housing goal.
Specifically, if during a single calendar year a town with an approved HPP has increased its
number of low- and moderate-income year-round housing units, as counted on the SHI, in an
amount equal to or greater than 0.5% or 1.0%, then that town would have the ability to deny a
comprehensive permit for a project it determines is not consistent with local needs. For Bolton,
based upon the 2010 census numbers, this safe harbor would be for a period of one year for
0.5% increases in affordable housing units (9 units), or two years for an increase of 1.0% (17
units) of housing units in Town.
298 Housing Goals Implementation Strategies
Below are outlined five key goals for producing additional affordable housing in Bolton and
expanding the housing alternatives for residents. A timeline is provided for specific activities
over the coming five years that this HPP will be active.
8.1 40B Development
The Massachusetts Comprehensive Permit Law,15 known as Chapter 40B, was enacted in 1969
to promote the development of low- and moderate-income housing. Chapter 40B allows a
developer to apply for a comprehensive permit that suspends existing local regulations that
may be an impediment to affordable housing production. First, the developer must receive
preliminary approval from a state or federal housing subsidy program.16 The developer then
files the preliminary approval with the local Zoning Board of Appeals (ZBA), which coordinates
with other local boards and holds a public hearing to consider the proposed project. If the ZBA
declines to issue a comprehensive permit, the developer can appeal to the Housing Appeals
Committee (HAC) if the community’s affordable housing is below 10% of total year-round
housing units.
Although this program is sometimes viewed unfavorably by local residents and communities, it
can be a great tool to aid in developing specific housing alternatives in areas the Town could
support, without having to pursue time-consuming rezoning or bylaw modifications.
8.1.1 Encourage “Friendly” 40B Developments (LIPs)
The Local Initiative Program is a state program which encourages affordable housing by
providing technical assistance to communities and developers who collaborate to create
affordable housing opportunities. A Local Initiative Project (LIP) offers a “friendly” approach
to the Chapter 40B comprehensive permit process. Under the LIP, a developer will work with
town boards (e.g., the Board of Selectman and the Planning Board) to obtain an official
endorsement of a project.
The use of a “friendly 40B” provides opportunities for the community to work with experienced
developers to try different approaches to housing creation and housing diversity without
having to rework internal zoning controls. It can also help the Town focus development in
certain areas where the existing infrastructure may be better suited for greater density.
The Town should consider supporting a “friendly” 40B rental development where 25% of the
units would be designated as affordable, and 100% of the units would count toward Bolton’s
SHI. For example, if Bolton will soon need about 129 units to meet the 10% threshold (see supra
Section 7.2), then a rental development of 150 units would meet and exceed that threshold.
G.L. c. 40B, §§ 20-23.
15
In Massachusetts, there are four major subsidizing agencies: the Department of Housing and
16
Community Development, MassDevelopment, MassHousing, and Massachusetts Housing Partnership.
30You can also read