Town of Prospect - PLAN OF CONSERVATION & DEVELOPMENT UPDATE Effective February 1, 2014
←
→
Page content transcription
If your browser does not render page correctly, please read the page content below
Town of Prospect

PLAN OF CONSERVATION
    & DEVELOPMENT
        UPDATE

   Effective February 1, 2014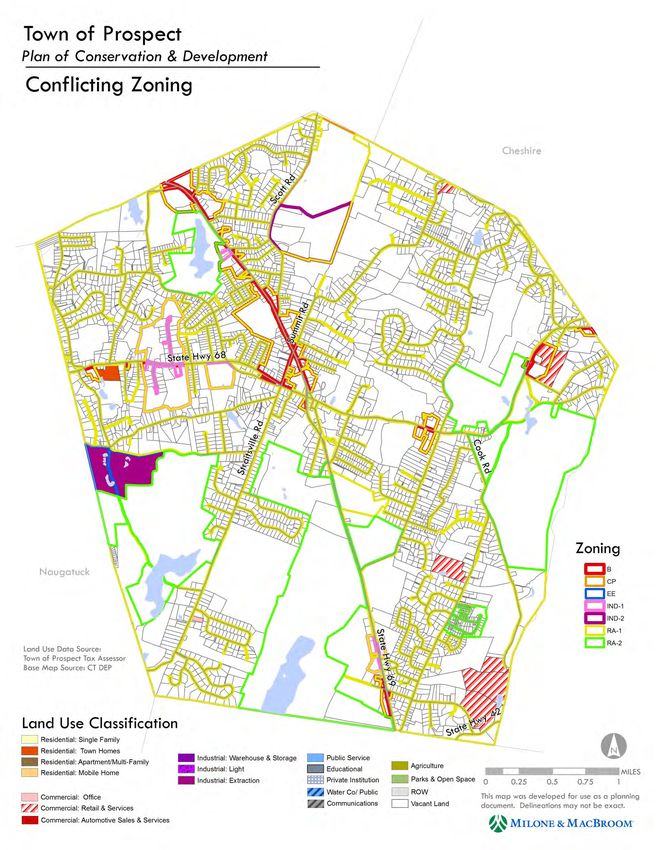
PROSPECT
2013 PLAN OF CONSERVATION
 AND DEVELOPMENT UPDATE

                   Prepared for:
 Town of Prospect Planning and Zoning Commission

                  Prepared by: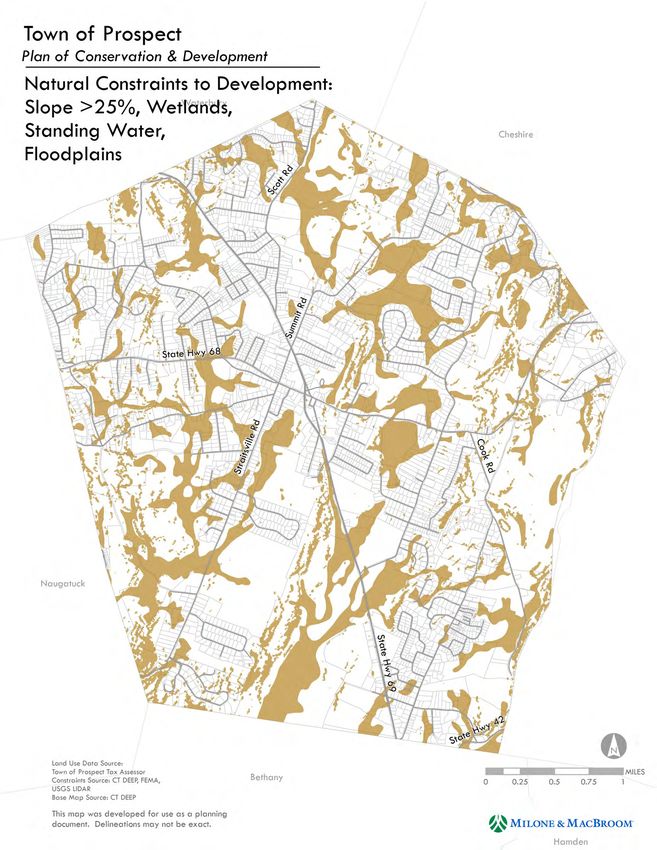
Mayor
   Robert J. Chatfield

   Planning and Zoning Commission
   E . Gil Graveline, Cha i r ma n
   A l an Ha vic an, V ic e‐ Ch a irman
   J a c k C ru mb
   G r e g o ry P lo s k i
   D a v id S an tor o
   E i le en C ra n n ey ( Al t .)

   Tam my DeLoia, C l er k

   Land Use Inspector
   W i l l ia m D ono v an

Prospect 2013 Plan of Conservation and Development   Page ii

C ONTENTS
   INTRODUCTION ............................................................................................................................................................. 1
   CHAPTER 1: DEMOGRAPHICS ........................................................................................................................................3
          Current Population ................................................................................................................................................ 3
          Population Projections ..........................................................................................................................................5
          Elements of Population Change.............................................................................................................................6
          Age ......................................................................................................................................................................... 9
          School Age Population .........................................................................................................................................10
          Racial and Ethnic Composition ............................................................................................................................ 11
          Households ..........................................................................................................................................................12
          Where is Prospect’s Population Heading?........................................................................................................... 14
   CHAPTER 2: HOUSING..................................................................................................................................................15
          Existing Housing Characteristics .......................................................................................................................... 15
          Development Trends ...........................................................................................................................................16
          Affordability Of Housing ......................................................................................................................................21
          Multifamily Housing And Housing For Aging Demographics ............................................................................... 25
          Housing Issues, Trends And Implications............................................................................................................. 25
   CHAPTER 3: LAND USE .................................................................................................................................................26
   CHAPTER 4: DEVELOPMENT POTENTIAL ..................................................................................................................... 30
   CHAPTER 5: CHANGES SINCE 2002 POCD .................................................................................................................... 36
      Land Use Plan ..........................................................................................................................................................36
      Water Line Extension ...............................................................................................................................................36
      Commerce Park Zone ..............................................................................................................................................36
      Recession ................................................................................................................................................................. 36
      Open Space Plan ......................................................................................................................................................36
      Regulatory Changes .................................................................................................................................................36
   CHAPTER 6: POLICIES AND OBJECTIVES ....................................................................................................................... 40
   CHAPTER 7: ACTION AGENDA ......................................................................................................................................60
   CHAPTER 8: INTERGOVERNMENTAL CONSISTENCY .................................................................................................... 63
      State......................................................................................................................................................................... 63
      Region ...................................................................................................................................................................... 63

Prospect 2013 Plan of Conservation and Development                                                                                                                     Page iii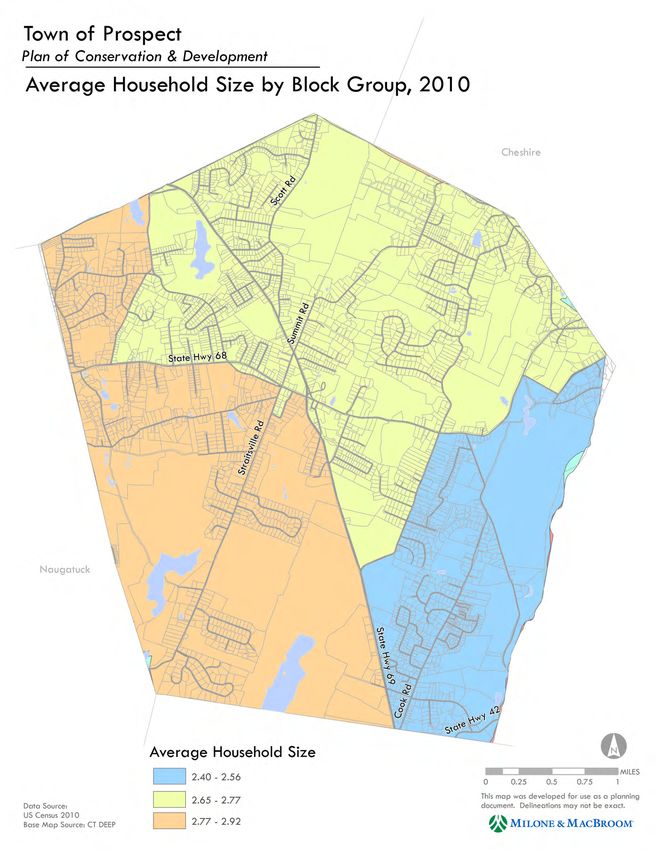
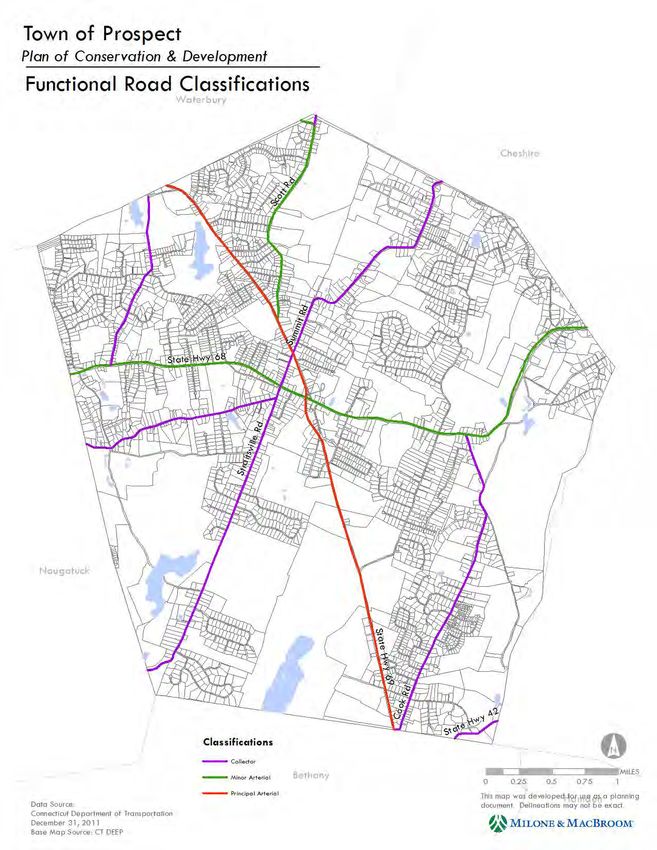
M APS
   Map 1: Population by Block Group, 2010 ...................................................................................................................... 4
   Map 2: Population Change by Block Group ................................................................................................................... 8
   Map 3: Average Household Size ..................................................................................................................................13
   Map 4: Land Zoned for Single Family Residential Use ................................................................................................. 17
   Map 5: Housing Density by Block Group ..................................................................................................................... 18
   Map 6: Existing Land Use .............................................................................................................................................27
   Map 7: Land Use Change: 2002‐2013 .......................................................................................................................... 28
   Map 8: Conflicting Zoning ............................................................................................................................................29
   Map 9: Natural Contraints to Development ................................................................................................................ 32
   Map 10: Residential Development Potential ............................................................................................................... 34
   Map 11: Non‐Residential Development Potential ....................................................................................................... 35
   Map 12: Land Use Plan Map ........................................................................................................................................38
   Map 13: Existing Public Water Supply ......................................................................................................................... 39
   Map 14:Listed Historic Properties ............................................................................................................................... 40
   Map 15:Functional Road Classifications ...................................................................................................................... 41
   Map 16: Gateway Areas ..............................................................................................................................................47
   Map 17: Potential Village District ................................................................................................................................48
   Map 18:State Priority Conservation Areas .................................................................................................................. 64
   Map 19: State Priority Funding Areas ........................................................................................................................ 655

Prospect 2013 Plan of Conservation and Development                                                                                                        Page iv
INTRODUCTION

   The current Prospect Plan of Conservation and Development (POCD) was approved by the Planning and Zoning
   Commission (PZC) as effective on May 1, 2002. This POCD was used as a guide for a comprehensive revision of the
   Prospect Zoning Regulations effective July 1, 2004. The POCD was amended to incorporate the Open Space Plan
   prepared by the Prospect Conservation Commission effective January 1, 2010.
   In accordance with State Statutes, the Prospect PZC initiated a review and update of the 2002 POCD upon the
   tenth anniversary of its effective date. As a result of this review and update process, this draft POCD has been
   prepared. The approach to this planning process has been to identify those aspects of the current POCD that
   require updating due to demographic, land use, and regulatory changes since 2002. Much of the demographic
   updating relates to the availability of the 2010 census. In addition, the PZC has reviewed the policies, goals, and
   actions contained in the 2002 POCD in light of updated statistics, changes in land use patterns and trends,
   recommended actions completed, and a re‐visit to the vision for the future contained in the 2002 POCD.
   From a technical perspective, the Town of Prospect has a much more developed Geographic Information System
   (GIS) than was available in 2002. This has facilitated a more detailed analysis of existing conditions, an estimate of
   potential build‐out, and a higher quality of mapping. This better technology combined with a review of the 2002
   POCD has identified which components need to be updated and which have changed little if at all since 2002. The
   recession over the last portion of the decade, and continuing to some extent today, has contributed to a slowing of
   growth, pressures, and limited changes.
   As a result of this review and planning process, the approach in this update is to retain the 2002 POCD as a
   reference in the complete 2013 POCD. The components newly presented in this 2013 POCD include chapters on
   demographics, housing, land use, development potential, policies and objectives, and recommended actions. This
   material, when appropriate, is supported by mapping, charts, and other graphics.

Prospect 2013 Plan of Conservation and Development                                                           Page 1
C HAPTERS 1 THROUGH 5 ARE ALL NEW ,
                P REPARED FOR THIS UPDATE

Prospect 2013 Plan of Conservation and Development   Page 2
CHAPTER 1: DEMOGRAPHICS
This chapter provides background on Prospect’s population ‐ its characteristics, trends and regional context. This
information will help facilitate planning decisions insofar as it explains current population conditions and recent
and expected trends that will influence future development.
CURRENT POPULATION
The 2010 population of the Town of Prospect reported by the U.S. Census is 9,405, an increase of 8% from 2000.
Census numbers indicate that Prospect and the surrounding towns of Bethany and Cheshire have grown at a
tremendous rate in the past 40 years, far outpacing the County and the State. The Town’s total population has
grown 43.7% since 1970, from 6,543 to 9,405, as demonstrated in Table 1.
Towns of a similar size in New Haven County, specifically Middlebury, Bethany, and Oxford have seen a similar
degree of growth, except for Oxford, whose population has nearly tripled in forty years. Prospect’s population is
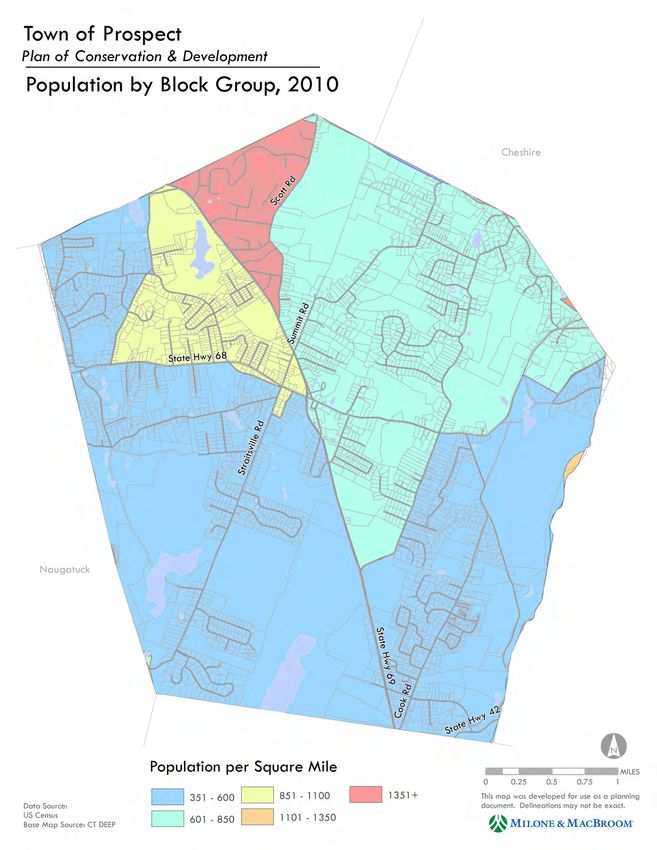
densest in the north of the town, along Route 69, especially in census tract 3471, west of Scott Road, which has
more than 1,350 people per square mile. Population density for 2010 by Census Block Group is shown in Map 1.
The Council of Governments of the Central Naugatuck Valley (COGCNV) compiles an annual demographic profile
for the region1. In 2010, the Central Naugatuck Valley Region (CNVR) population was 287,768, which was an
increase of 5.6% from 2000. The average population density for the region was 931 people per square mile in
2010, which is on average comparable to Prospect, although the areas in the southern portion of the town are
considerably less dense than the regional average.
T ABLE 1
Selected Population Changes in New Haven County 1970‐2010
1970 1980 1990 2000 2010 1970‐2010* 2000‐2010
Change Change
Prospect 6,543 6,807 7,775 8,707 9,405 43.7% 8.0%
Bethany 3,857 4,330 4,608 5,040 5,563 44.2% 10.4%
Cheshire 19,051 21,788 25,684 28,543 29,261 53.6% 2.5%
Middlebury 5,542 5,995 6,145 6,451 7,575 36.7% 17.4%
Naugatuck 23,034 26,456 30,625 30,989 31,862 38.3% 2.8%
Oxford 4,480 6,634 8,685 9,821 12,683 183.1% 29.1%
New Haven County 744,948 761,337 804,219 824,008 862,477 15.8% 4.7%
CNVR ‐ 237,385 261,081 272,594 287,768 21.2%* 5.6%
Connecticut 3,031,709 3,107,576 3,287,116 3,405,565 3,574,097 17.9% 4.9%
* Change for the CNVR is from 1980‐2010.
Source: US Census, Council of Governments: Central Naugatuck Valley, A Profile of the CNVR: 2012
1
Council of Governments: Central Naugatuck Valley, A Profile of the CNVR: 2012
Prospect 2013 Plan of Conservation and Development Page 3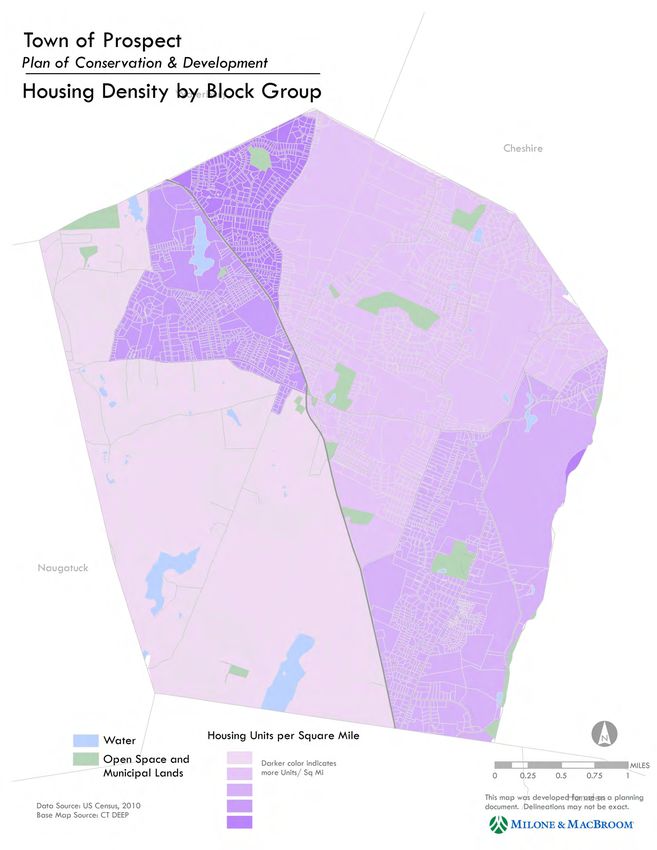
M AP 1

Prospect 2013 Plan of Conservation and Development   Page 4
P O P U L A T I ON P R O J E C T I O N S
   The Connecticut State Data Center at the University of Connecticut has projected populations for Prospect based
   on levels of fertility. The projections are shown in Figure 1 and listed in Table 2. The projections show an overall
   continued increase in the population over the next ten years. The fertility level projection shows a relatively small
   but stable increase in the population of approximately 0.2‐0.3% per year, or an increase of 6.91% from 2010 to
   2025. The Connecticut Department of Transportation also compiles its own population projections, which have
   been plotted in Figure 1, as well.
   In comparison, fertility rate population projections for the State and New Haven County out to 2025 show a 4.8%
   and 6% increase, respectively, over 15 years. In addition, the neighboring communities of Cheshire and Bethany
   are projected to decrease by 1.13% and increase by 8.57% from 2010 to 2025, respectively. As shown in the trend
   line in Figure 1, the average growth in Prospect since 1970 was 1% per year, though the trend is not necessarily
   projected to continue.

   F IGURE 1

                 Prospect Historic and Projected Population 1970 ‐ 2040
   12,000
                                                                                                           11,689

                                                                                               10,944
   11,000

                                                                              10,184

   10,000
                                                           9,405                         10,055
                                                                               9,864

    9,000                                          8,707

    8,000                               7,775

                             6,807
    7,000
                6,543

    6,000
                1970         1980        1990      2000      2010   2015       2020      2025       2030       2040
                                                CT Data Center         DOT             Trend
     Sources: U.S. Census, Projections from CT State Data Center and UCONN, June 2012 and CT DOT Population

Prospect 2013 Plan of Conservation and Development                                                            Page 5
Table 2 presents a comparison of population projections by The Connecticut State Data Center at UConn and the
Connecticut Department of Transportation, as well as 2000 and 2010 census counts, for Prospect and the
surrounding towns and region.
T ABLE 2
Population Projections
Census Population UConn CTSDC CT DOT
Projection Projection
2000 2010 2020 2040
Prospect 8,707 9,405 9,864 11,689
Cheshire 28,543 29,261 29,120 35,831
Bethany 5,040 5,563 5,910 6,648
Middlebury 6,451 7,575 8,471 8,964
Oxford 9,821 12,683 14,714 18,001
Naugatuck 30,989 31,862 32,877 36,615
Connecticut 3,405,565 3,574,097 3,702,472 4,013,596
New Haven County 824,008 862,477 898,513 948,647
Source: UConn CTSDC, CT DOT
Prospect 2013 Plan of Conservation and Development Page 6ELEMENTS OF P O P U L AT I O N C H A N G E
Population changes result from natural increase (births minus deaths) and net migration. Overall, annual births in
Prospect have declined during the last decade, as shown in Table 3. However, other communities and the State as
a whole have experienced a more significant decline in annual births than the Town of Prospect. Indeed, national
fertility and birth rates have declined precipitously since 2007 according to the National Center for Health
Statistics.
Annual births are down 13% from 2000 to 2010 in Connecticut, compared to an 18% decline in Prospect (from
1999‐2009). However, given Prospect’s small population, it is important to also look at the average change in
births, which was a decrease of 0.48% per year, or 4.8% for the same ten years.
The number of deaths each year has remained relatively stable, however after 2008, the number of deaths
outpaces births resulting in a net natural decrease. The Town’s natural increase from 2000 to 2010 was
approximately 198 people. Given that the 2010 Census indicated a gain of 698 residents between 2000 and 2010,
one can assume the community experienced an in‐migration of approximately 500 people over the last decade.
T ABLE 3
Prospect Natural Increase 1998‐2009
Births Deaths
1998 82 72
1999 93 61
2000 102 78
2001 86 73
2002 110 71
2003 84 74
2004 104 76
2005 100 73
2006 79 83
2007 88 64
2008 75 75
2009 76 81
Total 1,079 881
Source: CT Dpt of Public Health, Office of Vital
Statistics
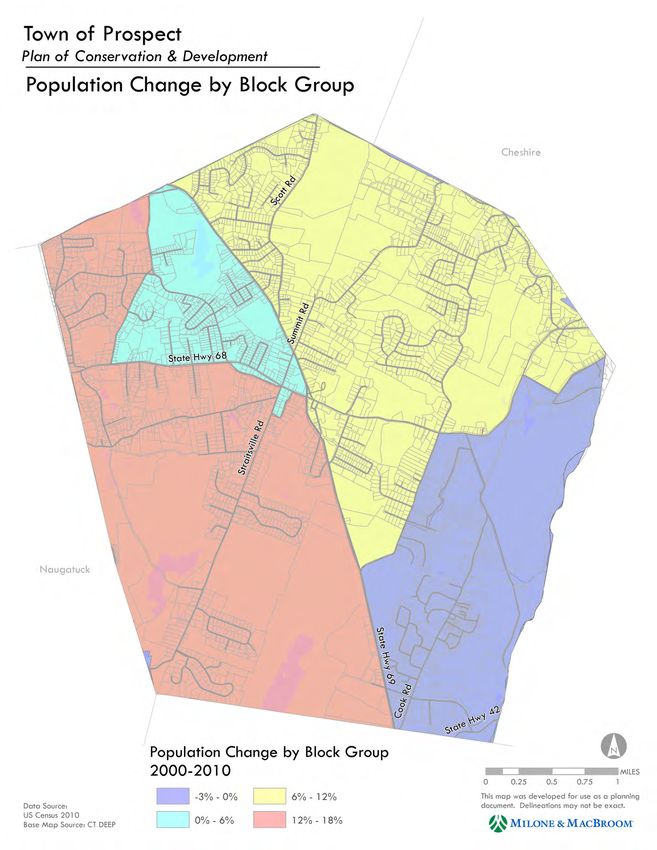
As is the case in all communities, the population in various areas of the community changes at different paces.
Map 2, Population Change by Block Group, shows changes in Prospect by census block groups.
Prospect 2013 Plan of Conservation and Development Page 7M AP 2 Prospect 2013 Plan of Conservation and Development Page 8
AGE
   In line with state and regional trends, Prospect’s population aged between 2000 and 2010. The median age in
   Prospect was 43.8 in 2010, up 11 % from 2000 figures. These numbers reflect the overall national and state trends
   of an aging population.
   Looking more specifically at changes in population by age cohorts within Prospect, it is evident that Prospect has
   experienced a loss in the young family age population, including infants. Figure 2 shows changes by age groups
   from 2000 to 2010, and Figure 3 shows projected changes by age groups from 2010 to 2020, using the UConn
   model. The increases in the 15 to 30‐year old population and the sizeable 50 year and older population suggest the
   trend of young single working people staying in or moving to the area, and people over 50 (generally the ‘baby
   boomer’ population) keeping their homes. The increase in population over 50 may also be a result of recent age
   restricted developments in the Town. The loss of young families and increase in older age groups has implications
   on facilities and service planning for the Town. It also affects the type of housing that may be required to support
   the changing population.

   F IGURE 2

                Prospect Change in Population by Age Group,
                               2000-2010
    85 years and over
       80 to 84 years
       75 to 79 years
       70 to 74 years
       65 to 69 years
       60 to 64 years
       55 to 59 years
       50 to 54 years
       45 to 49 years
       40 to 44 years
       35 to 39 years
       30 to 34 years
       25 to 29 years
       20 to 24 years
       15 to 19 years
       10 to 14 years
          5 to 9 years
        Under 5 years
                     -400     -300    -200    -100     0    100       200    300     400
                                                 Total Change

   Source: US Census

Prospect 2013 Plan of Conservation and Development                                                         Page 9
F IGURE 3
Prospect Change in Population by Age Group,
2010-2020
85 years and over
80 to 84 years
75 to 79 years
70 to 74 years
65 to 69 years
60 to 64 years
55 to 59 years
50 to 54 years
45 to 49 years
40 to 44 years
35 to 39 years
30 to 34 years
25 to 29 years
20 to 24 years
15 to 19 years
10 to 14 years
5 to 9 years
Under 5 years
-300 -200 -100 0 100 200 300 400
Source: US Census Total Change
S C H O O L A G E P OP U L A T I O N
A projected decline in school aged population can have an effect on present school facilities. Although a decline in
the number of students would not negatively impact the adequacy of existing facilities (versus a sudden increase),
the subsequent lack of state funding tied to enrollment could affect the overall school district. Because Prospect is
part of a regional school district, the effects of the enrollment for the entire district would have to be analyzed to
gauge any impact to the facilities or budgets, however actual enrollment figures from the Connecticut Department
of Education included in Figure 4 , shows that Region 16 and Prospect have seen a similar proportion of declining
enrollment.
F IGURE 4
Change in School Enrollment
3000
2500
2000
1500 Prospect Students
Total Students, Region 16
1000
500
0
2006-2007 2007-2008 2008-2009 2009-2010 2010-2011
Source: CT CEDAR
Prospect 2013 Plan of Conservation and Development Page 10RACIAL AND ETHNIC COMPOSITION
Prospect’s racial composition is less diverse than the composition of New Haven County or the Central Naugatuck
Valley Region.
Figure 5 shows the breakdown of Prospect’s population by race. The majority, or 95%, is white. This is less diverse
than New Haven County where the 2010 population was 75% white, or the CNVR which was 79.4% white in 2010.
The COGCNV report found, however, that 76.9% of the region’s minority population resides in Waterbury. As
shown in Table 4, Prospect has seen an increase in all races. Some of these increases may be the result of self‐
reporting differences. Figure 5 shows racial composition in graphic form.
The Hispanic population, of any race, in Prospect was 3% in 2010. That is significantly less than the Hispanic
population throughout New Haven County, which was about 15% 2010, or the CNVR, which was 14.8% in 2010.
The COGCNV report found that as with minorities in general, 81% of Hispanics in the region reside in Waterbury.
T ABLE 4
Change in Prospect Racial Composition, 2000‐2010
RACE 2000 2010 Change
One race 8,644 9,299 7.6%
White 8,386 8,964 6.9%
Black or African American 124 177 42.7%
American Indian and Alaska 8 12 50.0%
Native
Asian 63 73 15.9%
Some other race 63 73 15.9%
Two or more races 63 106 68.3%
Source: US Census
F IGURE 5
Prospect 2010 Racial Composition
4.7% (all
others)
White
Black or African American
American Indian and
Alaska Native
Asian
Some other race
Two or more races
95.3%
Source: US Census
Prospect 2013 Plan of Conservation and Development Page 11HOUSEHOLDS
In addition to changes in age and racial composition, the types of households in which Prospect residents live are
changing. The Town experienced a moderate increase in total households between 2000 and 2010, of 337 or about
11%. More significantly, the number of single‐person households, especially households over 65 and non‐family
households, increased as did the number of female households with children (see Table 5 below). The COGCNV
report indicates that even as married‐couple families are the majority of households in the region, their numbers
are declining. This is not the case for Prospect, as shown in Table 5. Married‐couple families overall grew by 4%,
although the number of married‐couple families with children declined by the same amount.
T ABLE 5
Households by type 2000 2010 Change % Change
Total households 3,020 3,357 337 11.2%
Family households (families) 2,456 2,616 160 6.5%
With own children under 18 years 1,087 1,088 1 0.1%
Married‐couple family 2,142 2,226 84 3.9%
With own children under 18 years 974 934 ‐40 ‐4.1%
Male householder, no husband present N /A 125
With own children under 18 years N /A 48
Female householder, no husband present 214 265 51 23.8%
With own children under 18 years 76 106 30 39.5%
Nonfamily households 564 741 177 31.4%
Householder living alone 456 602 146 32.0%
Householder 65 years and over 202 282 80 39.6%
Households with individuals under 18 years 1,161 1,173 12 1.0%
Households with individuals 65 years and over 727 953 226 31.1%
Average household size 2.83 2.76 ‐2.5%
Average family size 3.16 3.15 ‐0.3%
Source: US Census
While the number of households in the entire Town of Prospect increased between 2000 and 2010, the average
household size and average family size both decreased. As Map 3 indicates, the average population size varies by
area, with larger households mostly located in the southwest section of the Town, and the smallest households in
the southeast.
Additionally, while Prospect experienced only 11% growth in the overall number of households, the number of
households headed by a person age 65 or older grew by 31%, from 727 in 2000 to 953 in 2010. This aging of
householders has implications for the future of housing units in the community, especially when the real estate
market recovers and householders decide to leave their family homes.
Prospect 2013 Plan of Conservation and Development Page 12M AP 3 Prospect 2013 Plan of Conservation and Development Page 13
WHERE IS P R O S P E C T ’ S P O P U L AT IO N H E A D I N G ?
Prospect’s population has grown quite steadily for the last 30 years. While incremental changes in population
characteristics have occurred and will continue, the Town’s trend of relatively high growth is expected to taper off.
The following demographic trends can be expected over the next decade.
Stable population – Prospect will likely maintain a steady population of around 10,000.
Aging population ‐ The population will continue to age, not just in Prospect, but across the Region
and State.
Decreasing household sizes – Prospect’s household sizes will continue to decrease as fewer families
with fewer children occupy housing units.
Prospect 2013 Plan of Conservation and Development Page 14CHAPTER 2: HOUSING As one of the principal land uses within a community, housing and housing‐related issues affect all residents. The form, layout, condition, and cost of housing available within a community are key to the quality of life within a community. Prospect’s current housing status will be examined in this chapter to determine what housing needs exist and to formulate courses of action to address those needs in the coming decade. Current and past housing data comes from several sources. The US Census Bureau collects housing data in its decennial census via comprehensive surveying methodology. It has released housing data relating to total numbers of vacant and occupied housing units for the most recent (2010) Census. These numbers are shown in Table 6. It has not yet released more detailed housing data from the 2010 Census, so in its place, data from the Census Bureau’s American Community Survey (ACS) has been used. This data is collected from a far smaller survey group than the decennial census, and is therefore generally less accurate; however, general trends can be ascertained. To supplement both data sets, building permit data from the CT Department of Economic and Community Development has been used. While these data sets are not considered entirely accurate, they are used together to present an overall idea of housing characteristics and changes in Prospect. EXISTING HOUSING CHARACTERISTICS The 2010 Census recorded 3,474 housing units in Prospect. Ninety‐six point six percent (96.6%) of the housing units were occupied leaving a 3.4% vacancy rate. Of the total 3,357 occupied housing units, 92.4% were owner‐ occupied and the remaining 7.6% were renter‐occupied units. According to Census counts, 117 housing units were vacant. Table 6 depicts the housing unit characteristics of Prospect compared to its neighboring communities, New Haven County and the State of Connecticut. The Town’s vacancy rate of 3.4% was lower than the New Haven County and State rates of 7.6% and 7.9%, respectively. In terms of local communities, Prospect at 3.4% had the lowest vacancy rate, with the more urbanized Waterbury having the highest and Naugatuck the second highest. The towns with a similar high percentage of single family housing units all had very low vacancy rates, well below the State and County rates. Prospect’s percentage of rental units (7.6%) is considerably lower than the New Haven County and State of Connecticut rates. The communities in the immediate region all have renter percentages that are much higher than Prospect with the exception of Bethany, which has an even lower rental rate than Prospect. Thus, Prospect has a housing stock whose composition in terms of occupancy of units is characteristic of a small community in the region. This fact is indicative of Prospect’s single family dominant housing stock, and the lower percentage of rental stock may also be explained by the high number of rental units in surrounding communities that satisfy much of the demand for rental housing in the immediate area. Prospect 2013 Plan of Conservation and Development Page 15
T ABLE 6
                                                  Housing Unit Characteristics: 2010
                                                Prospect and Surrounding Communities
                       Total Housing                                              Total Occupied          % Owner       % Renter
                                               % Occupied         % Vacant
                           Units                                                       Units              Occupied      Occupied

     PROSPECT             3,474                  96.6%                3.4%               3,357             92.4%          7.6%
      Cheshire            10,424                 96.3%               3.7%               10,041             86.7%          13.3%
     Waterbury            47,991                 89.1%              10.9%               42,761             47.0%          53.0%
     Naugatuck            13,061                 94.5%               5.5%               12,339             67.9%          32.1%
      Bethany              2,044                 96.4%              3.6%                 1,971             92.9%          7.1%
     New Haven
                         362,004                 92.4%                7.6%              334,502            63.4%          36.6%
      County
    Connecticut        1,487,891              92.1%                   7.9%           1,371,087             67.5%          32.5%
    Source: U.S. Bureau of the Census, Decennial Census.

   DEVELOPMENT TRENDS
   Prospect’s housing stock of 3,397 units, as enumerated by the 2011 American Community Survey and shown in
   Table 7, consisted of 90.1% single family detached housing; 2.0% single family attached (generally Town Homes);
   1.5% multi‐family housing (5 units or more); 2.5% two, three and four family housing; and 4.0% mobile home or
   other.
   Zones that allow for single family residential use are illustrated on Map 4, Land Zoned for Single Family Residential
   Use, and housing density is illustrated in Map 5, Housing Density by Block Group. The densest areas of housing in
   Prospect are generally found in the northern and eastern parts of the town.
   T ABLE 7
                                        Change in Housing Units by Structure Type: 2000 to 2011
                                                            Prospect, CT
                          Total Housing          % of       Total Housing                         Change in          % Change
                                                                             % of Housing
          Type Of          Units 2000          Housing       Units 2011                             Units             Between
                                                                                Stock
         Structure           Census             Stock           ACS*                              2000‐2011          2000‐2011
    1 unit, detached           2,847            92.0%           3,059           90.1%                212                7.4%
    1 unit, attached             22             0.7%              67            2.0%                 45                204.5%
    2 to 4 units                 78             2.5%              85            2.5%                  7                 9.0%
    5 or more units              17             0.5%              50            1.5%                 33                194.1%
    Mobile home,
    trailer, other                130           4.2%            136             4.0%                 6                 4.6%

         TOTALS               3,094                            3,397                                303                9.8%
    Source: U.S. Bureau of the Census, ACS

   Table 7 illustrates changes that have occurred in the Town’s housing stock between the 2000 Census and 2011.
   According to available data from the 2000 Census and the 2011 ACS 5‐Year Estimates (which are based on a 5‐year
   rolling average of estimates between 2007 and 2011), between 2000 and 2011 the number of housing units in
   single family detached structures increased by an estimated 212 units. Single family attached units increased by 45
   units or 204.5% and multi‐family housing (50 or more units) increased by 33 units or 194.1%. Both of these large
   percentages represent very small changes in the total number of units, but nevertheless show a decline in the
   overall percentage of single‐family detached units, and an increase in those housing units that either single family
   attached, or buildings with five or more units. It can be assumed that a majority of the attached units are in the
   Toll Brothers development. The total estimated number of housing units in Prospect as of 2011 was 3,397. Figures
   6 and 7 display these statistics in graphic form.

Prospect 2013 Plan of Conservation and Development                                                                     Page 16
M AP 4 Prospect 2013 Plan of Conservation and Development Page 17
M AP 5

Prospect 2013 Plan of Conservation and Development   Page 18
F IGURE 6                                                       F IGURE 7

   Based upon these figures, most of the increase in housing units since the 2000 Census have been in single family
   detached structures (212 out of 303).
   In addition to the U.S. Census data, the State Department of Economic and Community Development (DECD)
   maintains an annual inventory of permits for housing units issued by town, current to 2011. As of 2011, DECD
   reported that Prospect had an estimated 3,411 housing units, an issuance of 564 permits since the 2000 Census.
   Of these units, 3,154 (92.5%) were single family attached and detached units, 73 (2.1%) were in two family
   structures, 2,058 (11.3%), and 39 (1.1%) were in structures with five units or more. There were no three or four
   family structures. There were also 145 mobile homes. It should be noted that often building permits are issued but
   the units are not built. This was specifically true with the burst of the housing bubble.
   To quantify the housing unit growth that occurred in the Town during the last 10 years, statistics from the State of
   Connecticut Department of Economic and Community Development were used to determine housing construction
   authorizations by structure type by year. These statistics are presented in Table 8. All of Prospect’s new housing
   development during the last decade was in the form of single‐family detached housing and single‐family town
   homes. Although 372 new housing permits were issued in Prospect between 2002 and 2011, the Town only
   experienced a net gain of 261 units during this period due to a number of demolitions. Since 2008, the Town
   ranked in the top twenty of Connecticut communities in terms of annual net gain in housing permits. Housing
   construction has remained extremely steady in Prospect, even as the number of net housing units Statewide has
   dropped.

Prospect 2013 Plan of Conservation and Development                                                          Page 19
T ABLE 8

                                      Housing Units & Construction Activity Authorized: 2002‐2011
                                                          Town of Prospect
                          Total Units                                  3&4                                                Net         Rank in State by
          Year            Authorized          1 Unit      2 Unit       Units         5 or More       Demolitions          Gain           Net Gain
         2011                 49                49          0           0                 0              0                 49                12
         2010                 48                48          0           0                 0              2                 46                14
         2009                 36                36          0           0                 0              1                 35                16
         2008                 57                57          0           0                 0             na                 na                 na
         2007                 39                39          0           0                 0             na                 na                 na
         2006                 14                14          0           0                 0              6                 8                  67
         2005                 33                33          0           0                 0              2                 31                 104
         2004                 37                37          0           0                 0              0                 37                 90
         2003                 28                28          0           0                 0              0                 28                 103
         2002                 31                31          0           0                 0              4                 27                 110
         Totals              372               372          0           0                 0             15                261
     Source: State of CT Department of Economic and Community Development, “Connecticut Housing Production and Permit Authorized Construction Report.”

   Prospect has very little diversity in housing stock and type. The Town almost entirely consists of single family
   detached housing built after middle of the twentieth century. There is a mix of moderately‐valued residential
   structures with a mix of higher‐end residential structures, although most structures are moderate in size and value.
   This value balance often has housing implications, including situations where a household experiences a decrease
   in income or size, and is in the market for a new home that is smaller or more affordable. Such units may be more
   difficult to find in Prospect; however, they are often abundant in surrounding communities, which may lead
   households in Prospect with shrinking sizes to leave the Town for more desirable housing stock in the surrounding
   towns.
   An indicator of housing condition and housing variety in a community is the age of the housing stock. The age of
   housing stock generally affects both aesthetic appeal as well as the availability of a variety of housing types. As
   shown in Figure 8, only 26.1% of Prospect’s housing stock was built before 1960. The number of housing units
   produced has been relatively stable every decade since then. 13.8% of the Town’s total housing stock (468 units)
   was built from 2000 to the present.

    F IGURE 8
                     Age of Housing Units, Prospect, CT
                             Total Units: 3,397

    Built 1939 or earlier                           189
      Built 1940 to 1949                             205
      Built 1950 to 1959                                                       492
      Built 1960 to 1969                                                             561
      Built 1970 to 1979                                           365
      Built 1980 to 1989                                                                   624
      Built 1990 to 1999                                                       493
      Built 2000 to 2004                                   265
      Built 2005 or later                            203

    Source: US Census

Prospect 2013 Plan of Conservation and Development                                                                                           Page 20
A F F O R D A B IL I T Y O F H OU S I N G
The issue of housing affordability is a state‐wide problem but is most acute in towns with a majority of single
family housing built after the middle part of the twentieth‐century. Affordability on a regional basis is also
complex and defies simple solutions. The cost of housing is the result of a variety of factors including, but not
limited to, the demand for a specific location, availability of buildable land, interest rates, and labor and material
costs. Other factors, such as the age and quality of the existing housing stock as well as the introduction of new
product to the market greatly affect the cost of housing. Other factors independent of housing cost, such as job
growth and local economic conditions, all work together to influence the cost and availability of housing. Most of
these factors are beyond the control of local governments.
The State of Connecticut requires that the issue of affordable housing be addressed in each community’s Plan of
Conservation and Development. Development over the years in Prospect has resulted in a housing stock that is
not diverse in terms of housing types, density, and styles. Current zoning regulations do not allow much flexibility
in terms of providing a wide range of allowable densities and housing types.
According to recent real estate market statistics for the period of 2002 to 2011 from The Warren Group, an
average of 81 single family homes per year were purchased in Prospect. As shown in Table 9 & 10 and Figure 9
median single‐family residential sales prices were on an upward trend until 2007, and have since decreased and
leveled off.
F IGURE 9
Median Sales Price, 2000‐2012
Prospect, CT
$400,000
$350,000
$300,000
$250,000
$200,000
$150,000
$100,000
$50,000
$0
2000 2001 2002 2003 2004 2005 2006 2007 2008 2009 2010 2011 2012
Median Sales Price 1‐Fam Median Sales Price Condo Median Sales Price All
Source: The Warren Group
Prospect 2013 Plan of Conservation and Development Page 21T ABLE 9 & 10
Number of Sales & Median Sales Price in Prospect Number of Sales & Median Sales Price in Prospect
Single Family Homes, 2002‐2012 Condos, 2002‐2012
Year Number of Sales Median Sales Price Year Number of Sales Median Sales Price
2002 114 $205,250 2002 ‐
2003 88 $234,950 2003 ‐
2004 102 $250,250 2004 ‐
2005 74 $277,500 2005 16 $252,900
2006 92 $269,950 2006 11 $285,900
2007 97 $290,000 2007 6 $288,500
2008 77 $273,000 2008 38 $342,756
2009 73 $251,000 2009 40 $339,399
2010 55 $253,000 2010 24 $330,730
2011 45 $230,000 2011 34 $352,833
2012 77 $235,000 2012 23 $319,000
Source: The Warren Group Source: The Warren Group
Compared to adjacent communities, over the past several years Prospect’s median single‐family sales prices have
remained considerably lower than the comparable communities as shown in Table 11. Bethany is the highest‐
priced town in the immediate area. Although its sales prices were on par with Cheshire and Prospect in 2002,
Bethany far outpaced both through 2007. Bethany’s median sale price has dropped most precipitously since,
although it is still nearly $100,000 more than Prospect. Between 2002 and 2012, the median sales price in
Prospect increased by 14.5%, while Cheshire increased by 18.8% and Bethany by 34.0%. Housing prices in
Naugatuck, which has very different housing stock and housing characteristics, has decreased by 1.9%.
T ABLE 11
Comparison of Median SF Home Sale Prices
Prospect and Surrounding Communities, 2002‐2012
2002 2003 2004 2005 2006 2007 2008 2009 2010 2011 2012
Prospect $205,250 $234,950 $250,250 $277,500 $269,950 $290,000 $273,000 $251,000 $253,000 $230,000 $235,000
Bethany $242,500 $335,000 $320,000 $372,500 $415,000 $435,000 $362,500 $314,000 $317,500 $300,000 $325,000
Cheshire $261,000 $290,000 $329,000 $344,000 $360,500 $342,250 $327,000 $339,900 $307,000 $335,000 $310,000
Naugatuck $158,000 $169,900 $195,000 $235,000 $239,900 $234,900 $220,000 $176,000 $177,000 $165,500 $155,000
Source: The Warren Group
Much of the housing development in Prospect since 2007 has been the construction of new town homes
developed by Toll Brothers in the northern part of the Town. Since 2008, town homes prices have outpaced single‐
family housing prices, as seen in Table 9 & 10. In 2012, the median sale price for a condominium/ town home in
Prospect was directly on par with the single‐family housing prices in Cheshire and Bethany. For comparison, the
median sales prices of a condominium/ town homes in Cheshire was $173,500 in 2012, while it was $319,000 in
Prospect. This is attributed to the newer, higher quality units within the Toll Brothers development. All such units
in Prospect were in 55 adult communities.
Prospect 2013 Plan of Conservation and Development Page 22Like many communities in Connecticut, Prospect experienced a dramatic climb in home sales prices from the latter
half of the 1990s to 2007. A strong residential market had numerous positive impacts on communities like
Prospect, such as rising assessments of residential properties (and thus increasing tax revenues from these
properties) and attracting new residents to the Town.
Table 12 illustrates the number of single‐family town home sales listings for the last week of December 2012 in
Prospect. The vast majority of properties, 79% of the homes listed for sale, are clustered between $200,000 and
$499,999. There were only 9 properties listed below $200,000 and none below $100,000 which creates a
significant affordability barrier.
T ABLE 12
Single Family Town Home
Real Estate Listings by Price: December 2012
# of % of
Listings Listings
Less than $100,000 ‐ 0.0%
$100,000‐$199,999 9 16.4%
$200,000‐$299,999 20 36.4%
$300,000‐$499,999 24 43.6%
$500,000 or more 2 3.6%
Total 55 100.0%
Source: Realtor.com (2012); compiled by MMI
With an average home sales price of $303,646 and a 20% down payment to avoid mortgage insurance, a new
homeowner would need a mortgage of $243,000 and a down payment of nearly $61,000. At an assumed interest
rate of 4%, a $243,000 mortgage would result in principal and interest payments of approximately $1,054 per
month. Assuming roughly $1,000 per year in homeowner’s insurance and a mil rate of 27.58, an additional $572
per month in taxes and insurance would be added, leading to a total monthly housing cost of $1,626. Using the
standard calculation of 30% of gross household income for housing costs, a household would need to earn
approximately $65,040 per year to afford an average home in Prospect. This income level is 30.5% lower than
Prospect’s 2011 median household income ($93,631), which itself is 49.8% more than the median household
income for New Haven County as a whole ($62,497).
On a regional basis, Prospect has the seventh highest median home sales price of the 13 municipalities in the
Central Naugatuck Valley Council of Governments (COGCNV) for which data is available. In addition, statistics
provided by HOMEConnecticut, an initiative of the Partnership for Strong Communities organization, indicate that
Prospect has only a small “gap” in terms of raw dollars between its median household income and the qualifying
income needed to purchase a home at the median sales price in the Town. Prospect’s median household income is
relatively high, as previously stated, and therefore many residents will have the average qualifying income needed
to purchase a home. It should be noted that the median household income represents households already in
place. The barrier to affordability in Prospect may be, therefore, in retaining the new households created by
current residents (by providing smaller units, for example) or in attracting new residents to move into Prospect,
especially given the high expected down payment.
In a community such as Prospect, an additional barrier to affordability is the lack of diversity of housing stock.
Housing is almost entirely larger, single family detached homes. Even though the prices in Prospect are affordable
for families seeking this type of housing, the lack of small units and rental units which appeal to both new families
and downsizing families, limits the diversity in population, and the overall affordability of Prospect. Because the
income levels are relatively high, this may simply be a supply side problem. The addition of more units, and more
diversity of units could expand affordability without reducing existing housing value significantly.
Detailed housing figures from the 2011 American Community Survey included statistics on gross rent for renter‐
Prospect 2013 Plan of Conservation and Development Page 23occupied units. With 169 specified renter‐occupied units, Prospect’s median rent in 2011 was $893. As shown in
Table 13, this rent level is the second lowest among the surrounding communities, including the more urban
community of Naugatuck. This suggests that the quality of rental units in Prospect may be lower than surrounding
communities that receive higher median rents. As to be expected, Naugatuck and Waterbury contain the vast
majority of the area’s rental housing. In 2011, 34.2% of the area’s rental units fell within the $750 to $999 gross
rent cohort, followed by 32.5% of the units falling within the $1,000 to $1,499 gross rent cohort. Units renting for
$1,500 or more per month in the area accounted for 6.0% of the area’s total.
T ABLE 13
Gross Rent for Specified Renter‐Occupied Units: 2011
Prospect and Surrounding Communities
Bethany Cheshire Naugatuck Prospect Waterbury
Units Percent Units Percent Units Percent Units Percent Units Percent
Occupied units
66 1,260 3,586 169 20,505
paying rent
Less than $200 0 0.0% 50 4.0% 17 0.5% 0 0.0% 988 4.8%
$200 to $299 0 0.0% 20 1.6% 32 0.9% 0 0.0% 880 4.3%
$300 to $499 0 0.0% 83 6.6% 297 8.3% 0 0.0% 1,221 6.0%
$500 to $749 0 0.0% 78 6.2% 523 14.6% 28 16.6% 3,756 18.3%
$750 to $999 8 12.1% 197 15.6% 1,100 30.7% 74 43.8% 6,908 33.7%
$1,000 to $1,499 6 9.1% 427 33.9% 1,407 39.2% 60 35.5% 5,976 29.1%
$1,500 or more 52 78.8% 405 32.1% 210 5.9% 7 4.1% 776 3.8%
No Cash Rent 29 121 226 33 951
Median Rent $1,738 $1,238 $966 $893 $881
Source: US Census, American Community Survey
HUD publishes, on an annual basis, a schedule of Fair Market Rents for counties and metropolitan areas across the
United States. HUD’s FY 2013 Fair Market Rents provide a better picture of actual rents in these areas at the
present time. Fair Market Rents are based upon Census data that is updated through various rental housing
survey tools. For 2013, the Fair Market Rents for the Waterbury, CT HUD Metro FMR area (of which Prospect is a
part) was $572 for a studio apartment, $772 for a one‐bedroom apartment, $942 for a two‐bedroom apartment,
$1,173 for a three‐bedroom apartment and $1,275 for a four‐bedroom apartment. These numbers are far below
fair market rents in all other metropolitan areas in the State, and are less than half of the rents for the highest
Metropolitan area of Stamford‐Norwalk. Norwich‐ New London, which has the second lowest fair market rent
levels in the State, is at least $100 higher per month than the Waterbury area for a comparable unit.
To supplement Census and HUD data on market rents, a survey of units currently for rent were examined. Data
sources included the Republican American rental listings, Craigslist.com rental listings, Rent.com and
Apartmentguide.com listings. There were no complexes with rental available found in the Town of Prospect, and
overall, only two private houses for rent. This suggests that of the 169 rental units in Prospect, most are long‐
term, private rentals.
The 2011 ACS statistics indicate that 181 owner‐occupied households in Prospect, or 20.4%, paid thirty percent or
more of household income for monthly housing costs. Rental households paying thirty percent or more of
household income for gross rent were 112 households or 69.2% of total renter households. These households do
not meet State and Federal housing affordability guidelines, which mandate housing affordability as paying less
than 30% of ones income for housing expenses. The disparity between the percentage of owner and renter
occupied units not meeting the affordability guideline suggests that many households who cannot afford to own a
house in Prospect leave the town, and those that remain and choose to rent instead, have limited incomes. As
previously stated, the rents in Prospect are generally lower than the surrounding communities, and therefore the
high percentage of renters who do not meet affordability guidelines is a particular concern.
Prospect 2013 Plan of Conservation and Development Page 24M U L T I F A M IL Y H O U S I N G A N D H O US I N G F O R A G I N G D E M O G R A P H I C S
Of the 3,397 housing units in Prospect, only 1.5% are multifamily units (buildings with 5 or more units), but an
additional 2.5% of the inventory is in 2 to 4 unit structures. Currently, multifamily dwellings are not permitted by
the zoning regulations in Prospect, except specifically age restricted units, with a minimum of 15% of the units
designated as age‐restricted, affordable. Such housing is currently permitted in any Residential (RA‐1 or RA‐2) or
Commerce Park (CP) zone, and as a single parcel with a minimum of 5 acres, although not more than 8 units per
acre can be built, and no building shall contain more than eight units.
Housing for an aging population is a critical concern for most communities. As the population ages, it is important
that a community provide alternative living arrangement options. This gives the population opportunities to
continue to reside in the community where they have spent the majority of their years and not be forced out by
escalating housing prices. Housing product can include a range of types and supporting services, from
conventionally designed housing units intended to promote mobility (e.g., one‐level, grab bars, ramps, etc.) to
provision of medical and support of daily living functions, there are many variations of housing product. The main
distinguishing characteristics of the housing types are the level of medical assistance and the extent of communal
facilities provided.
Future demand for housing in Prospect will depend upon market conditions, the economy and similar outside
forces that cannot be predicted. However, with almost 34% of Prospect’s population being between the ages of 45
and 64, it is reasonable to expect the demand for housing options for older persons in Prospect will increase over
the next decade.
When thinking about multifamily housing and housing for aging demographics in Prospect, it is important to
consider Prospect’s unique character, density and urban design elements to establish reasonable criteria for
multifamily housing to increase the supply of affordable housing. Careful planning for the future possibility of
these types of units can guide developments to areas in Prospect which meet these criteria.
HOUSING ISSUES, TRENDS AND IMPLICATIONS
In terms of planning for the next ten years and beyond, several housing issues and trends in Prospect have future
implications. These include:
An aging population will increase the demand for smaller, age in place units;
A minimal diversity of housing type, size, age, and design in the existing housing stock may require an
expansion of the type of units cited above;
A shortage of rental units resulting in low vacancy rates and very little turnover of units will limit the
opportunities for older households desiring a downsizing as well as younger persons who grew up in
Prospect and desire to remain in the community;
A shortage of areas zoned to permit multifamily housing, which limits the potential to diversify the
housing stock.
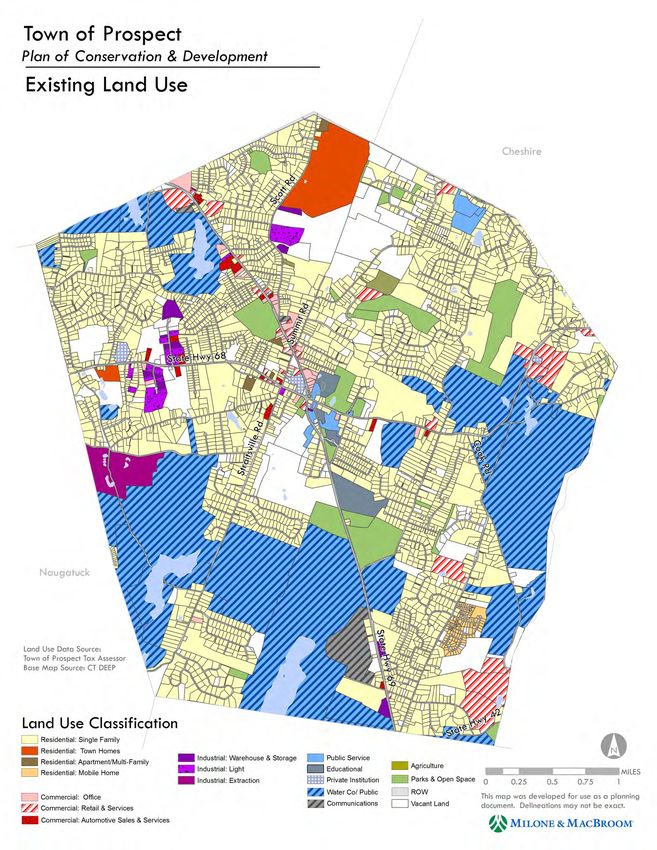
Prospect 2013 Plan of Conservation and Development Page 25CHAPTER 3: LAND USE As part of the update to the Prospect Plan of Conservation and Development, in cooperation with the Town Assessor and Land Use Inspector, records were accessed to assemble a variety of statistics for each parcel in Prospect. These statistics include the land use for each of the parcels. This information was entered into the GIS database for mapping purposes. The attached Existing Land Use Map presents this information broken down into nineteen categories. This updates the map prepared in 2002 as part of the preparation of the current plan. This map is identified as Map 6, Existing Land Use. Map 7, Land Use Change – 2012‐2013, highlights those parcels which have changed land use in the period since 2002. There are some individual residential parcels within subdivisions that have changed from 'vacant' to 'developed' since 2002. For purposes of clarity, these parcels are not highlighted on the map. However, the extent of these parcels is not significant enough to impact neither the plan revision nor any policies that might be contained in the update. Map 8, Conflicting Zoning, shows those parcels on which there are land uses that are in conflict with the Town Zoning District Map. As can be seen from a review of this map, the number of such parcels is quite small when one considers the total number of parcels in the town. This is evidence that the current plan and zoning map have been used effectively by the Planning and Zoning Commission in the guiding of development in Prospect. In terms of the overall development pattern in the town, a calculation of the percentage land use on an acreage basis has been completed. Table 14 presents the result of this calculation. Similar to the current plan, the dominant land uses are single‐family residential and water company properties. Municipal and open space uses are the third highest land use category by acreage. What is interesting is the small amount of vacant land. Therefore, it can be expected that future development will result from the subdivision of large residential parcels currently occupied by a single residence and redevelopment/change of use on currently developed parcels. Such parcels will often contain nonresidential uses that, due to changing market conditions, have become undervalued and offer the potential for more economic returns. Prospect 2013 Plan of Conservation and Development Page 26
M AP 6

Prospect 2013 Plan of Conservation and Development   Page 27
M AP 7

Prospect 2013 Plan of Conservation and Development   Page 28
M AP 8

Prospect 2013 Plan of Conservation and Development   Page 29
T ABLE 14

   Town of Prospect 2013 Land Use
   LAND USE CATEGORY                         ACRES    PERCENT OF TOTAL
   Commercial: Office                          51           0.6%
   Commercial: Automotive Sales & Services     36           0.4%
   Commercial: Retail & Services               160          1.7%
   Communications                               8           0.1%
   Educational                                 69           0.8%
   Industrial: Extraction                      88           1.0%
   Industrial: Light                           60           0.7%
   Industrial: Warehouse & Storage             69           0.7%
   Parks & Open Space                          380          4.1%
   Private Institution                         30           0.3%
   Public Service                              63           0.7%
   ROW                                         491          5.3%
   Residential: Condominium/ Active Adult      181          2.0%
   Residential: Apartment/Multi‐Family         19           0.2%
   Residential: Single Family                 3,991         43.3%
   Residential: Mobile Home                    37           0.4%
   Vacant Land                                1,076         11.7%
   Water Co/ Public                           2,407         26.1%
   TOWN TOTAL                                 9,218         100%

   Source: MMI, Tax Assessor Data

Prospect 2013 Plan of Conservation and Development                       Page 30
CHAPTER 4: DEVELOPMENT POTENTIAL

   The 2002 Plan of Conservation and Development presents an analysis of the development potential if all vacant
   land in Prospect is developed. The methodology used to arrive at an estimate for residential and nonresidential
   development included identification of the amount of vacant land in each zoning district. An analysis of
   development constraints was undertaken to identify land which is not feasible for development due to wetlands,
   steep slopes, and floodplains. In addition, water company lands were not included. Map 9, Natural Constraints to
   Development, displays these constraints on a town‐wide basis. This land was subtracted from the total of vacant
   land to compute a net amount of land available for development. The zoning requirements for the specific district
   were then used to estimate the number of dwelling units or nonresidential square footage that could be
   potentially developed. It should be noted that these estimates are for a total build out which, in practicality, will
   never occur.
   This 2002 analysis resulted in an estimate of the potential for 1,877 dwelling units and 4,900,000 square feet of
   nonresidential development. The basis for this estimate was the amount of lot area needed for each dwelling unit
   and 35% lot coverage in one story buildings for nonresidential development. Alternative zoning scenarios were
   calculated that would reduce this potential. For residential use, the approach was to increase the minimum lot
   area for residential use by changing R‐1 districts within public water supply areas to R‐2. For nonresidential
   development, the building coverage was reduced from 35% to 25% and 20%.
   For the 2013 update, a process similar to the one described above has been completed. The GIS‐generated parcel
   map and link to the assessor's data has increased the accuracy of the process. In addition, the Existing Land Use
   map contains changes in use since 2002, as well as changes in zoning regulations. Tables 15 & 16 contain
   estimates of the potential amount of development of residential and non‐residential land, respectively. GIS has
   been used to prepare maps that display both the development constraints and the development potential.

   T ABLES 15 & 16

                                Prospect Vacant or Underutilized Residential Lands, 2013
                                                                                                               Potential Dwelling
    Zone Total Acres Constrained Acres Net Buildable Land (Acres)* Minimum Lot Size (SF)                            Units**
     RA-1   1,580           511                  1,037                   40,000                                       822
     RA-2    119             32                    83                    80,000                                        36
   Subtotal 1,699           543                  1,120                                                                858
   * Net excludes those parcels that do not mean minimum building requirements after excluding constrained acres
   ** Net buildable area minus 20% utility allowance/ Minimum lot size

                                       Prospect Vacant Non-Residential Lands, 2013
                                                                                      Minimum Lot Size
                                                                                       (SF)/ Maximum               Potential Floor
     Zone Total Acres Constrained Acres Net Buildable Land (Acres)*                       Coverage                   Area (SF)
      B       11              2                      8                                   20,000/35%                   128,038
    IND-1     82             14                     68                                  40,000/ 35%                  1,042,962
    IND-2     92             33                     59                                  40,000/ 35%                   900,087
   Subtotal  185             49                    136                                                               2,071,087
   * Net excludes those parcels that do not mean minimum building requirements after excluding constrained acres

   Source: MMI

Prospect 2013 Plan of Conservation and Development                                                                       Page 31
You can also read