Tracing the Photoaddition of Pharmaceutical Psoralens to DNA - MDPI
←
→
Page content transcription
If your browser does not render page correctly, please read the page content below
molecules
Article
Tracing the Photoaddition of Pharmaceutical
Psoralens to DNA
Janina Diekmann , Isabell Theves , Kristoffer A. Thom               and Peter Gilch *
 Institut für Physikalische Chemie, Heinrich-Heine-Universität Düsseldorf, Universitätsstr. 1, 40225 Düsseldorf,
 Germany; janina.diekmann@hhu.de (J.D.); isabell.theves@hhu.de (I.T.); kristoffer.thom@hhu.de (K.A.T.)
 * Correspondence: gilch@hhu.de

 Received: 30 September 2020; Accepted: 7 November 2020; Published: 10 November 2020

 Abstract: The psoralens 8-methoxypsoralen (8-MOP), 4,50,8-trimethylpsoralen (TMP) and 5-methoxypsoralen
 (5-MOP) find clinical application in PUVA (psoralen + UVA) therapy. PUVA treats skin diseases like
 psoriasis and atopic eczema. Psoralens target the DNA of cells. Upon photo-excitation psoralens
 bind to the DNA base thymine. This photo-binding was studied using steady-state UV/Vis and IR
 spectroscopy as well as nanosecond transient UV/Vis absorption. The experiments show that the
 photo-addition of 8-MOP and TMP involve the psoralen triplet state and a biradical intermediate.
 5-MOP forms a structurally different photo-product. Its formation could not be traced by the present
 spectroscopic technique.

 Keywords: psoralen; 8-MOP; TMP; 5-MOP; DNA damage; PUVA; photochemistry; UV/Vis
 spectroscopy; IR spectroscopy; time-resolved spectroscopy

1. Introduction
      The light-dependent PUVA (psoralen + UVA) therapy is a well-established symptomatic treatment
of skin diseases like psoriasis [1,2], atopic eczema [3], vitiligo [4,5] and cutaneous T-cell lymphoma [6,7].
In the treatment, patients are administered psoralen derivatives and the affected skin regions are
exposed to UVA radiation [8]. Concerning the molecular mechanism of the therapy, it was shown that
the uptake of psoralens in the cellular nuclei is the first step [9]. While the main targets of the psoralen
are the nucleic acids, minor interactions with other biomolecules like lipids and proteins in other
parts of the cell can take place [10]. Concerning DNA as a target, there is consensus that psoralens
intercalate into DNA, that is, they insert themselves between the base pairs. Upon photo-excitation,
the intercalated psoralens may bind to the DNA base thymine (see Scheme 1). A cyclobutane ring
forms involving the 40 and 50 positions of the psoralen (furan side) and the five and six positions of the
thymine base [11–13]. The formation of a cyclobutane ring involving the three and four positions of
the psoralen (pyrone side) was also found. The ratio of the two adducts depends on the substitution
pattern [14]. Photo-excitation of the furan side adduct can trigger another photoaddition which results
in DNA crosslinking. The damage done to DNA by (mono-) adducts and crosslinks can induce
apoptosis of the affected cells, ultimately resulting in the relief of symptoms [15].
      The mechanism of this photoaddition was addressed by steady-state [11] and time-resolved
spectroscopy [16–18] as well as quantum chemistry [19–22]. In a recent study, we traced
the photo-addition of psoralen to DNA in real-time [23]. The study addressed the derivative
40 -aminomethyl-4,50 ,8-trimethylpsoralen (AMT) and a DNA double-strand consisting of alternating
adenine (A) and thymine (T) bases (AT-DNA in the following). AMT was selected as it features a high
water solubility [24], a relatively high intercalation affinity (see below) and a high quantum yield for
the photoaddition of 0.12 [25]. For AMT intercalated into DNA bearing guanine (G) and cytosine (C)
base pairs, a photo-induced electron transfer (PET) was observed. This PET reduces the propensity for

Molecules 2020, 25, 5242; doi:10.3390/molecules25225242                         www.mdpi.com/journal/molecules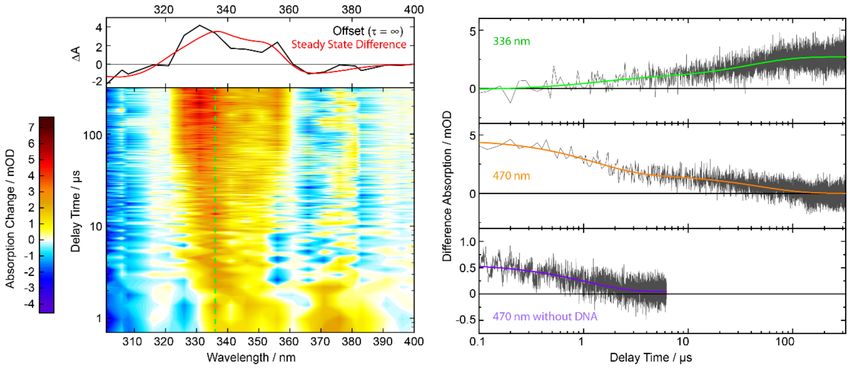
Molecules 2020, 25, 5242                                                                                 2 of 16

the photoaddition [26]. Therefore, experiments were conducted with AT-DNA. AMT predominantly
forms the furan side adduct. With nanosecond UV/Vis and IR spectroscopy, it was shown that the
photo-addition of AMT proceeds via a local triplet state. This state features lifetimes in the range
1–10 µs. The spread is presumably due to heterogeneity of the sample. The decaying local triplet
state feeds a triplet biradical in which the AMT moiety is connected with a thymine base via a
C-C single bond. Formation of the second bond and thereby the final photo-product takes ~50 µs.
AMT has favorable properties for a spectroscopic characterization and potentially for clinical use.
However, AMT has no approval for clinical applications. Psoralens which received approval are
8-methoxypsoralen (8-MOP), 4,50 ,8-trimethylpsoralen (TMP) and 5-methoxypsoralen (5-MOP) [8].
In most countries, the commonly used psoralen is 8-MOP [7]. While in the United States, 8-MOP is
the only derivative available for clinical use [6], in some European countries TMP and 5-MOP find
application [1,4]. Yet, TMP and 5-MOP are less studied and only rarely administered [8].
     Here, it will be investigated in how far the mechanistic picture derived from experiments on
AMT can be transferred to psoralens (8-MOP, TMP and 5-MOP) used in clinics. While for AMT
a combination of time-resolved UV/Vis and time-resolved infrared (IR) spectroscopy was used to
resolve the kinetics of the photo-addition, herein we use solely the technique of time-resolved UV/Vis
spectroscopy available in our lab. The small quantum yields and/or water solubilities of these
derivatives are very challenging for the small signals in time-resolved IR spectroscopy. It will be shown
that for a comparison between derivatives the not as demanding and less resource-intensive method
of time-resolved UV/Vis spectroscopy can still show distinct similarities and differences between
derivatives. To this end, dissociation constants characterizing the intercalation, reaction quantum
yields, spectroscopic patterns as well as kinetic parameters of the photo-addition were recorded. Based
on the results, some guidelines for the rational improvement of PUVA agents shall be given.

      Scheme 1. Structures of relevant psoralen derivatives and their photoaddition to DNA. Reaction via
      the 40 -50 -double-bond results in the furan monoadduct. The DNA is represented by the thymine base.

2. Results
     The following results show spectroscopic measurements on psoralen derivatives with and without
DNA. Synthetic DNA double strands with alternating adenine (A) and thymine (T) bases, AT-DNA in
the following, were employed. They were formed by annealing 50 -(TA)20 -30 single strands. All three
psoralen derivatives have, as opposed to AMT, low water solubility ranging from few micromolar
for TMP to a few hundred micromolar for 8-MOP [27]. The apparent solubility increases when the
psoralen can intercalate into DNA [28].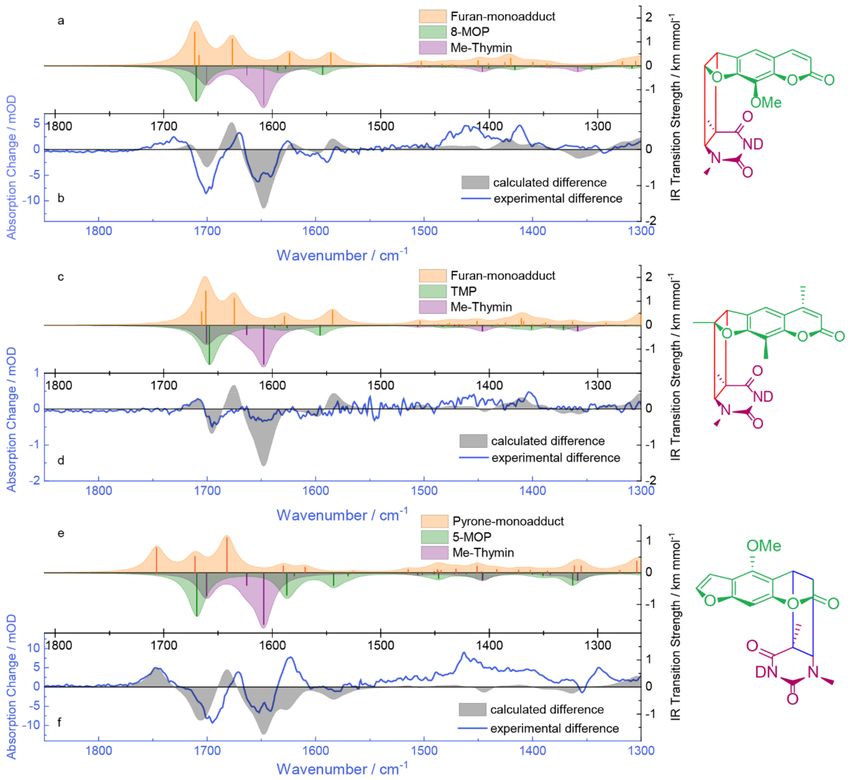
Molecules 2020, 25, 5242                                                                                 3 of 16

2.1. Intercalation
    Intercalation of psoralens into DNA is a prerequisite for the photoaddition and, thus, has to be
characterized. The propensity for intercalation is commonly quantified by the dissociation constant
KD [24]:
                                             cPso, f ree ·cDNA, f ree
                                      KD =                            .                           (1)
                                                     cPso,int
cPso, f ree is the concentration of free (non-intercalated) psoralen, cPso,int stands for the concentration
of intercalated psoralen and cDNA, f ree the concentration of DNA base pairs which are not hosting a
psoralen. All concentrations refer to equilibrium conditions. A small KD value represents a strong
intercalation affinity. The dissociation constant KD can be determined by a titration experiment [25,29]
which relies on the hypochromic effect in the UV/Vis absorption of psoralens upon intercalation [30].
In the titration, the total concentration of psoralen cPso, f ree + cPso,int was kept constant and the total DNA
concentration cDNA gradually reduced (see Reference [25] for details). Results of such a titration for
8-MOP and AT-DNA are summarized in Figure 1. In the respective UV/Vis absorption for wavelengths
larger than 300 nm—the spectral region below cannot be covered due to the high DNA absorption—the
impact of DNA on the 8-MOP absorption is clearly visible. For high DNA concentration and thereby a
large fraction of intercalated 8-MOP the absorption is relatively small. For low DNA concentration
and thereby mostly free 8-MOP the absorption is higher. This is in line with the hypochromic effect of
intercalation. From the dependence of the absorption at 302 nm on the total DNA concentration the
dissociation constant KD can be determined. The procedure relies on Equation (1) as well as Beer’s law
and is specified in Reference [25]. The KD value of 8-MOP and AT-DNA derived thereby amounts
to 1.1 × 10⁻³ M. For 8-MOP and calf thymus DNA, Isaacs et al. have determined a similar value of
1.3 × 10⁻³ M [27]. Deviation in KD values can be expected for differing DNA sequences and ionic
strength of the sample [31]. For AMT and AT-DNA, a somewhat smaller value of 4.4 × 10⁻⁴ M [25]
was reported. With the same procedure (data not shown) a dissociation constant KD of 1.8 × 10⁻⁴ M
for 5-MOP and AT-DNA was determined. A higher intercalation affinity compared to 8-MOP is in
line with early reports [32]. The low solubility of TMP in water renders a KD determination by the
above procedure difficult. Therefore, only the order of magnitude is estimated for the constant KD .
For this estimate solid TMP was added to a solution of AT-DNA in amounts exceeding its solubility.
Under these conditions the concentration cPso, f ree ought to equal the saturation concentration of TMP.
The concentration of intercalated TMP cPso,int was determined photometrically. From these values,
a KD value of the order of 10−4 M was estimated.

      Figure 1. Intercalation behavior of 8-MOP: (a) UV/Vis absorption spectra of 8-MOP (15 µM) with
      increasing concentration of AT-DNA in phosphate-buffered saline (PBS). The contribution of DNA to
      the absorption was subtracted; (b) Absorption at 302 nm versus the concentration of AT-DNA. A fit
      yields the dissociation constant KD of 1.1 × 10⁻³ M.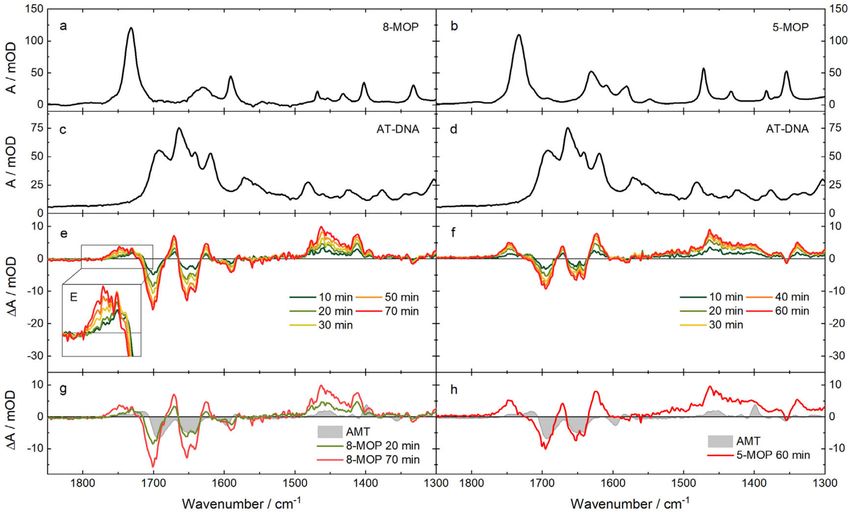
Molecules 2020, 25, 5242 4 of 16
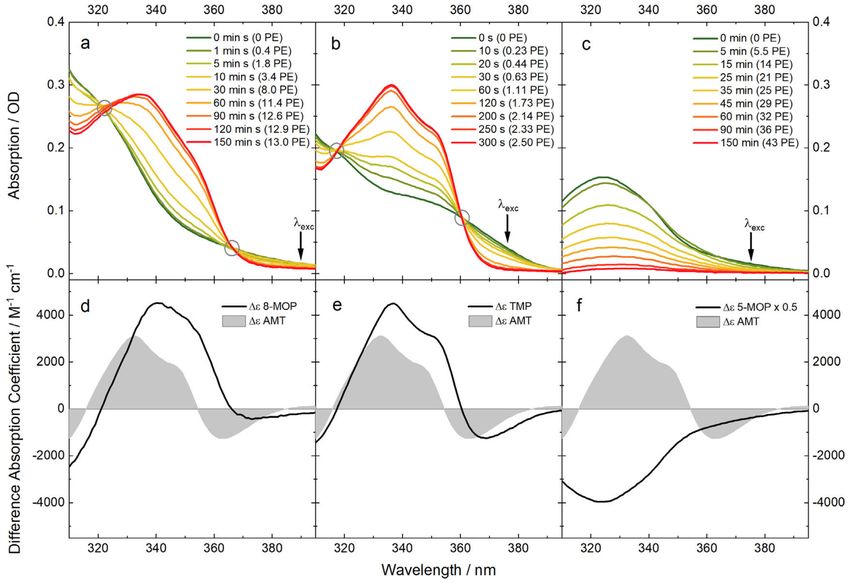
2.2. UV/Vis Absorption Signatures of the Photoadditions
All three psoralen derivatives absorb light in the UVA range (315–400 nm). The absorption
coefficients are high at the lower end of the UVA (5000–15,000 M−1 cm−1 ) and low or close to zero
around 400 nm. The DNA has very low to zero absorption in this range. The spectrum of 8-MOP
intercalated into AT-DNA shows an absorption up to 400 nm (Figure 2a, green). Irradiation at 390 nm
causes changes to the absorption spectrum. The irradiation times are converted into photon equivalents
(PE) which is a measure of the light dose (see Materials and Methods). A PE value of one implies that
each molecule has absorbed one photon. With the irradiation time or PE value, the absorption between
322–366 nm increases and below 322 and above 366 nm decreases. The last spectrum, the spectrum of
the photoproduct, features a maximum at 340 nm and a shoulder at ~352 nm. These features indicate
the formation of the furan monoadduct [12,33–35]. Longer irradiation at 390 nm causes the absorption
to decrease throughout the whole UVA spectrum (not shown here). Even though the absorption of the
monoadduct is almost zero at 390 nm, the small absorption seems to cause the formation of a secondary
photoproduct, presumably a crosslink. Neither the pyrone monoadduct nor the crosslink absorb
light in the UVA range [12]. Difference absorption coefficients for the monoaddition were extracted
from these spectra. A plot of the absorption versus irradiation time (not shown here) indicates that
after ~150 min the monoaddition is terminated. Therefore, the concentration of the photo-product
ought to equal the initial concentration of intercalated 8-MOP. From that, the difference absorption
coefficients can be computed (Figure 2d). The spectrum has a maximal difference absorption coefficient
of ~4000 M−1 cm−1 and the spectral pattern is red-shifted by 8 nm with respect to that of AMT [23].
With the knowledge of the light power impinging on the sample, a reaction quantum yield ΦR of 0.04
was computed. The value is higher than yields determined for 8-MOP in calf thymus DNA (0.013 [27],
0.0065 [36] and 0.0046 [37]). The difference could be related to the PET quenching occurring in the
DNA-samples bearing guanine.
Figure 2. Photoaddition of psoralens to AT-DNA traced by UV/Vis absorption. Irradiation intervals
are given in seconds and in photon equivalents (PE). Circles mark isosbestic points. Absorption
contributions of the DNA were subtracted: (a) Spectra of 8-MOP (33 µM) and AT-DNA (4 mM) in PBS
buffer after indicated irradiation times (λexc = 390 nm, P = 9.5 mW, V = 2.2 mL, d = 1 cm); (b) Spectra of
TMP (38 µM) and AT-DNA (3.3 mM) in PBS buffer after indicated irradiation times (λexc = 375 nm,
P = 7.5 mW, V = 2.4 mL, d = 1 cm); (c) Spectra of 5-MOP (18.4 µM) and AT-DNA (2 mM) in PBS buffer
after indicated irradiation times (λexc = 375 nm, P = 15 mW, V = 2 mL, d = 1 cm); (d–f) Difference
absorption spectra obtained from the data above are compared to the one of AMT with AT-DNA [23].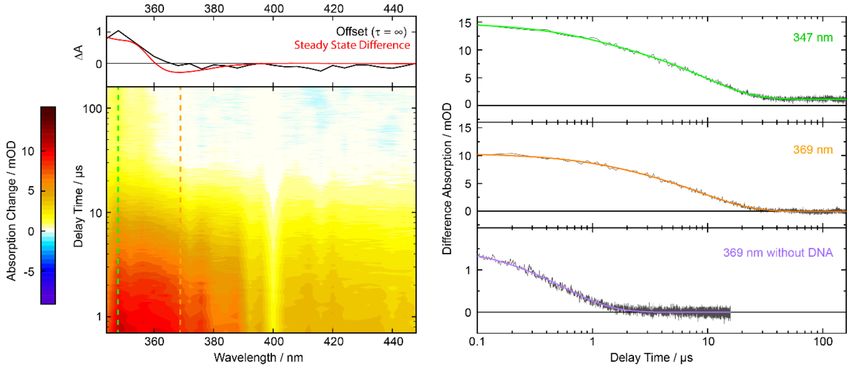
Molecules 2020, 25, 5242                                                                         5 of 16

     Similar spectroscopic signatures are observed for the photoaddition of TMP to AT-DNA
(see Figure 2b). Upon irradiation with 375 nm light, absorption increases are observed between
317 and 360 nm and decreases beyond these values. In comparison to 8-MOP, the isosbestic points
are better defined. This might be related to a lower propensity of TMP to form crosslinks [33,35].
Assuming that after 300 s or a PE of 2.5 the monoadduct formation has come to a halt, a difference
spectrum was computed (see Figure 2e). The spectrum is very similar to the one of the AMT furan
monoadduct. A reaction quantum yield ΦR of 0.4 was determined. Therefore, the psoralene derivative
TMP is three times more efficient in binding to AT-DNA then AMT with a quantum yield ΦR of
0.12 [23]. A higher reaction quantum yield for TMP in comparison to AMT is consistent with the
previous studies [27,31]. In these studies, the photoaddition to calf thymus DNA was examined,
allowing for no direct comparison of the values.
     The spectral changes caused by the irradiation of intercalated 5-MOP are very different from
the two discussed above (Figure 2c). The absorption spectrum of intercalated 5-MOP is similar to
the one of 8-MOP, although slightly red-shifted. Upon irradiation with 375 nm light a decrease of
the absorption in the whole spectral range covered is observed. With increasing irradiation time or
PE value the spectrum decays to essentially zero. The difference spectrum is therefore nothing else
than the inverted absorption spectrum of intercalated 5-MOP. As such it bears no resemblance with
the difference spectra of TMP and 8-MOP. The reaction quantum yield ΦR was determined to 0.017.
The spectral changes may be explained by the formation of the pyrone monoadduct. The pyrone
monoadduct does not absorb light in the shown UVA region [38]. In comparison to TMP and 8-MOP
there are less studies on the photoproducts of 5-MOP. The results shown here are in agreement with
the assumption that for 5-MOP the pyrone side monoadduct seems more favorable [38,39].

2.3. IR Absorption Signatures of the Photoaddition
      Due to the low water solubility, the signals of intercalated TMP in the IR are very small in
relation to the noise. Hence, the focus will be on 8-MOP and 5-MOP here. The IR spectra of 8-MOP
and 5-MOP without DNA were recorded in deuterated acetonitrile because of solubility reasons
(Figure 3a,b). The spectrum of 8-MOP features one very strong vibration band at 1732 cm−1 . It is
attributed to the carbonyl stretching vibration [40,41]. One broad band at 1632 cm−1 and a more
distinct one at 1591 cm−1 are attributed to C=C stretching vibrations. The spectrum of 5-MOP features
a strong vibration band at 1733 cm−1 which can be attributed to the carbonyl stretching vibration [41].
The bands at 1631, 1609, 1581 and 1549 cm−1 can be assigned to C=C stretching vibrations. For the
reason of IR transparency AT-DNA and 8-MOP were studied using buffer solutions based on D2 O.
This causes exchangeable protons of DNA to be replaced by deuterons, that is, NH vibrations are not to
be expected. AT-DNA features four distinct bands in the upper-frequency range (Figure 3c). The bands
at 1693 cm−1 and 1663 cm−1 can be assigned to carbonyl stretching vibrations of the thymine base
and the one at 1641 cm−1 and 1619 cm−1 to C=C stretching vibrations of the thymine and adenine
base respectively [42]. In a solution of 8-MOP (1.3 mM) and AT-DNA (20 mM) in buffer, roughly 95%
of 8-MOP is intercalated. When irradiated with an LED emitting at 375 nm, the absorption changes
(Figure 3e). Distinct negative absorption changes can be seen at 1701 cm−1 , 1653 cm−1 , 1641 cm−1 and
at 1590 cm−1 . Sharp positive absorption changes are located at 1671 cm−1 , 1626 cm−1 and 1411 cm−1 .
A broad one is located around 1750 cm−1 as well as between 1480–1440 cm−1 . For the assignment to
certain vibrations of the reagents one has to keep in mind, that the IR spectrum of 8-MOP was recorded
in deuterated acetonitrile and that the frequencies and transition strengths of the vibrations also
differ between intercalated and free psoralen [23]. Negative absorption changes around 1700 cm−1 are
probably due to the bleach of carbonyl stretching vibrations of 8-MOP as well as thymine. The absence
of strong bands of 8-MOP around 1650 cm−1 suggests that bleaches at 1653 cm−1 and 1641 cm-1 are
due to thymine. A more detailed assignment can be achieved with the help of quantum chemical
calculations (see below). The positive band at around 1750 cm−1 features a slight shift to higher
wavenumbers with longer irradiation time (Figure 3E). This temporal behavior suggests that this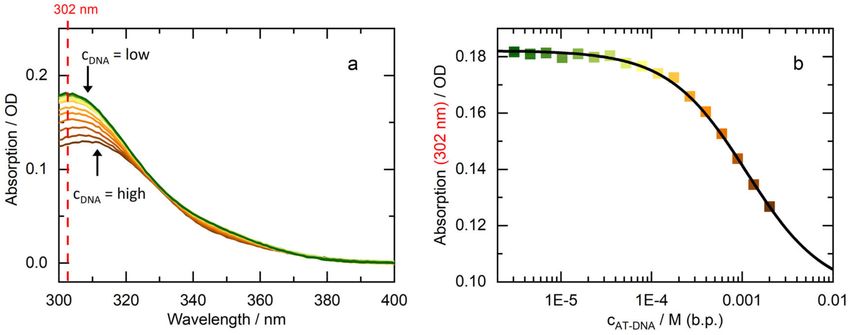
Molecules 2020, 25, 5242                                                                                    6 of 16

feature is due to secondary photochemistry, that is, crosslink formation. The propensity of 8-MOP
for crosslinks was already observed by UV/Vis spectroscopy (see above). The difference spectrum
for 8-MOP after 20 min of irradiation is very similar to the one obtained for AMT (Figure 3g), except
for positive difference absorption bands at 1671 and 1626 cm−1 which are not visible for AMT. After
70 min of irradiation, the spectra differ at 1750 cm−1 indicating that crosslink formation is more likely
for 8-MOP than for AMT.

      Figure 3. Steady-state IR spectra of the photoaddition of 8-MOP (left) and 5-MOP (right) to AT-DNA:
      (a) 8-MOP (11 mM) in acetonitrile-d3; (b) 5-MOP (10 mM) in acetonitrile-d3; (c,d) AT-DNA (7.7 mM)
      in PBS buffered D2 O; (e) Difference spectra of the irradiation of 8-MOP (1.3 mM) with AT-DNA
      (20 mM) in PBS buffered D2 O (λexc = 375 nm, P = 26 mW). (e) Magnification of the marked range;
      (f) Difference spectra of the irradiation of 5-MOP (0.7 mM) with AT-DNA (20 mM) in PBS buffered
      D2 O (λexc = 375 nm, P = 26 mW); (g,h) Comparison of difference spectra obtained from the data in (e,f)
      with the one of AMT (1.5 mM) with AT-DNA (6.5 mM) (λexc = 375 nm, P = 15 mW) [23].

     In a solution of 5-MOP (0.7 mM) and AT-DNA (20 mM), 99% of 5-MOP is intercalated. At first
sight, changes due to irradiation with a 375 nm LED (Figure 3f) are similar to the ones of 8-MOP.
A shift in absorption is not visible, which is an indication that no secondary photoreaction took place.
The difference spectrum of 5-MOP features similar bleaching bands as the one of AMT (Figure 3h).
The positive difference absorption for 5-MOP, which is very similar to the one of 8-MOP after 70 min of
irradiation, indicates a different photoreaction, which is presumably the pyrone adduct formation.

2.4. Quantum Chemical Computations of the IR Signatures
      Quantum chemical calculations support the interpretation of the experimental infrared spectra.
Spectra were computed relying on density functional theory (DFT) using the B3LYP functional
and a 6–31 + G* basis set as implemented in Gaussian 09 [43]. The self-consistent reaction field
(SCRF) method accounted for the solvent environment implicitly. The DNA environment was
not treated explicitly in the computation. Instead, a continuum approach was applied. Hereby,
the dielectric constant of pyridine (~13) was chosen to approximate the DNA environment. Water, with
a dielectric constant of 78, gave similar results, albeit the carbonyl stretching vibrations being located
at slightly lower wavenumbers (∆e     ν~−7 cm−1 ). Acidic protons were exchanged for deuteron. After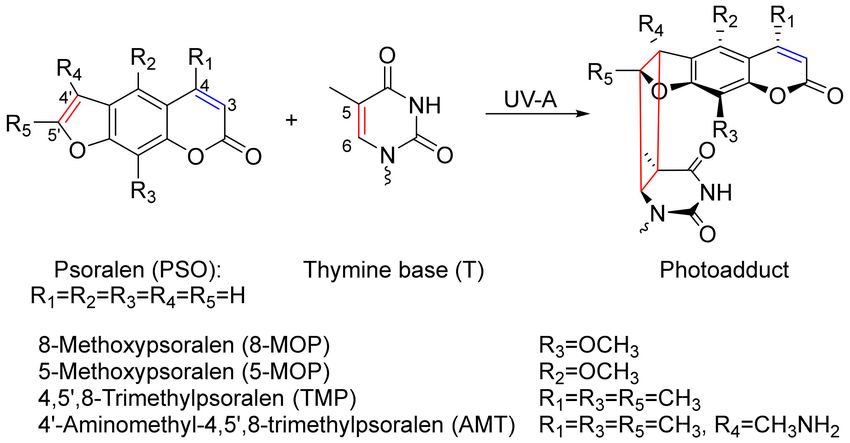
Molecules 2020, 25, 5242                                                                              7 of 16

geometry-optimization, the wavenumbers and IR transitions strength were computed. The harmonic
frequencies were scaled by a factor of 0.96 [44].
     For the calculation of the IR spectra of 8-MOP, Cambridge Structural Database (CSD) entry
XANTOX was used as starting geometry [45]. The carbonyl stretching vibration at 1670 cm−1
features the highest transitions strength (Figure 4a, green). Three weaker bands are located at 1595,
1588 and 1553 cm−1 and can be assigned to C=C stretching vibrations. The computed spectrum
shows high similarity to the experimental one in acetonitrile-d3 (compare Figure 3a), though the
experimental spectrum is shifted to higher wavenumbers by ~+60 cm−1 . No attempts to treat (a part
of) the double-stranded DNA by quantum chemistry were made. Instead only the IR spectrum of
1-methylthymine was computed. Three bands at 1661, 1624 and 1608 cm−1 can be seen. The ones with
higher transition strengths are the carbonyl stretching vibrations, while the one at 1624 cm−1 can be
assigned to a ring deformation mode [42]. Base pairing and stacking as well as other effects influence
the vibrations of thymine as part of DNA [46], explaining the difference in frequency and strength
of the vibrations in the experimental spectrum of AT-DNA (compare Figure 3b). For the structure of
the monoadduct Protein Data Bank (PDB) entry 203D, which is based on nuclear magnetic resonance
(NMR) measurements, was used as starting geometry [47]. Hereby, the DNA part was reduced to
the respective 1-methylthymine moiety. The carbonyl vibration of 8-MOP at 1671 cm−1 experienced
almost no shift. The carbonyl vibrations of thymine at 1667 and 1637 cm−1 are shifted by +6 and
+29 cm−1 respectively. At 1591, 1584 and 1546 cm−1 the C=C stretching vibrations of 8-MOP can be
seen, although the one at 1591 cm−1 has lost in strength as it is almost not visible. A synthetic difference
spectrum was obtained by subtracting the computed 8-MOP and 1-methylthymine spectrum from
the computed adduct spectrum. If one neglects the fact that the computed pattern is located at lower
wavenumbers by ~−40 cm−1 , the two patterns match rather well. The bleach at 1702 cm−1 , although
not as pronounced in the calculation, is due to the shifts in the carbonyl vibration of 8-MOP and one of
the carbonyl vibrations of thymine. The positive feature around 1670 cm−1 in the experiment can be
explained with the shift of the other thymine carbonyl vibration to higher wavenumbers. The bleach
contributions at 1653 cm−1 and 1641 cm−1 seen in the experimental difference spectra are according to
the computation due to carbonyl and C=C stretching vibrations of thymine. The fingerprint region is
not very well matched, which at this level of calculation is plausible.
     In the case of TMP, CSD entry LINTUX served as a starting geometry for calculating IR spectra [48].
The carbonyl stretching vibration is located at 1658 cm−1 and features the highest transition strength
(Figure 4c, green). Frequencies and transition strengths of C=C vibrations of TMP and TMP as
part of the furan monoadduct are very similar to the ones of 8-MOP and its furan monoadduct
(compare Figure 3a,c). The synthetic difference spectra are almost identical (compare Figure 3b,d).
The experimental difference absorption is, as explained above, due to the low signal to noise ratio not
discussed in detail. The region around 1700 cm−1 matches rather well, which supports the furan side
product formation.
     For the calculation of the IR spectra of 5-MOP, CSD entry ARARIW was used as starting
geometry [49]. The carbonyl stretching vibration at 1669 cm−1 features the highest transition strength
(Figure 4e, green). Bands at 1587, 1580, 1543 and 1530 cm−1 are attributed to C=C vibrations.
All these bands can be found in the experimental spectrum in acetonitrile-d3 as well (compare
Figure 3b). The starting geometry for the pyrone monoadduct was extracted from PDB entry 204D [47].
The carbonyl vibration of 5-MOP experiences a major shift (+37 cm−1 ). The thymine vibrations are
shifted by +10 and +33 cm−1 respectively. Bands at 1590 and 1570 cm−1 are attributed to C=C stretching
vibrations of 5-MOP. The synthetic difference spectrum shows high similarity to the experimental
one, with exception of the fingerprint region. The positive difference absorption around 1750 cm−1 is
due to the shift of the 5-MOP carbonyl vibration, which cannot be seen in the calculation of the furan
monoadducts. Hence, it can be seen as an indicator of the photoaddition on the pyrone side.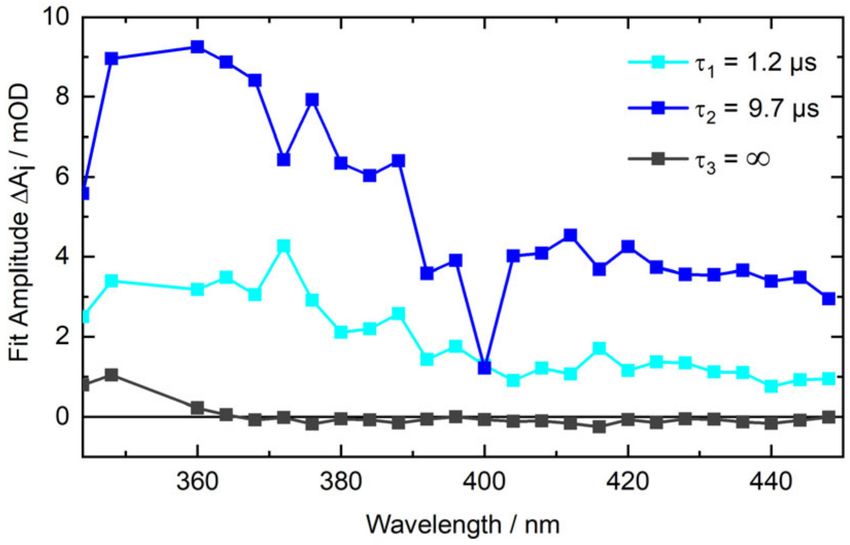
Molecules 2020, 25, 5242                                                                                    8 of 16

      Figure 4. IR signatures of photoaddition computed by quantum chemistry in comparison with the
      experimental data: (a,c,e) IR spectra of psoralens, 1-methylthymine and their respective photo-products
      obtained from a DFT calculation with the B3LYP functional and a 6-31 + G* basis set (scaling factor
      0.96). Stick spectra were converted into the presented ones by convolution with Lorentzians (full
      width at half maximum (FWHM) of 20 cm−1 ). The spectra of the psoralens and 1-methylthymine are
      inverted to highlight possible bleach contributions; (b,d,f) Comparison of calculated difference and
      experimental difference absorption. The blue X-axes (experimental difference) is shifted by 40 cm−1
      to higher wavenumbers relative to the black X-axes (computational differences). Structures of the
      respective photo-products are depicted on the right.

2.5. Nanosecond Transient UV/Vis Absorption Signatures of the Photoaddition
     Solutions of 8-MOP and TMP with AT-DNA were excited with UVA laser pulses and probed in
the UV/Vis region. Due to the lack of spectroscopic signatures of the 5-MOP photo-product in the
accessible UV/Vis region, only 8-MOP and TMP are treated in the following.
     A solution of 8-MOP and AT-DNA in buffered water was excited with nanosecond laser pulses
centered at 355 nm (Figure 5). At these concentrations ~70% of 8-MOP is intercalated. For the
absorptions employed, the detection wavelengths below 340 nm were not accessible. The spectral
pattern around time zero, featuring an absorption band peaking at ~360 nm, is similar to the one
reported for the triplet state of non-intercalated 8-MOP [50,51]. So, it is very likely that the time zero
signature is due to the triplet state of intercalated and partly due to non-intercalated 8-MOP. For the
conditions employed here, the measurement reveals a triplet decay time of 0.6 µs for non-intercalated
8-MOP (see Figure 5, violet). The value is in good agreement with the literature [51], if one takes the
intrinsic first-order decay (2.5 × 10⁵ s-1 ), self-quenching (3.8 × 10⁹ M−1 s−1 ) and quenching by oxygen
Molecules 2020, 25, 5242 9 of 16
(4 × 10⁹ M−1 s−1 ) into account. For non-intercalated 8-MOP the signal at large delay times is essentially
zero. For these delay times, the intercalated 8-MOP features a distinct difference absorption signal at
wavelengths smaller than 360 nm.
Figure 5. Nanosecond transient absorption of 8-MOP (0.3 mM) with AT-DNA (3 mM) in aerated buffer
solution after excitation at 355 nm. Left: The transient absorption in the contour plot is color-coded.
The dashed lines mark the respective time trace shown on the right. On top is the offset spectrum in
comparison with the steady-state signature (red, scaled to match the offset spectrum) after irradiation
at 390 nm. Right: Time traces at 347 and 369 nm. The third time trace shows 8-MOP (0.2 mM) without
DNA in water. The colored lines show bi-exponential (green and orange) or single exponential (violet)
fits of the data.
The decay pattern of intercalated 8-MOP (see Figure 5, green and orange) is also in stark contrast to
the behavior of non-intercalated one (Figure 5, violet). The decay is bi-exponential with time constants
of τ1 = 1 µs and τ2 = 10 µs (values obtained by global analysis). In the time traces for intercalated
8-MOP, no indications for a tri-exponential decay are observed. One could therefore reason, that the
time constant τ1 of 1 µs is due to residual non-intercalated 8-MOP which features a time constant close
to 1 µs. However, in an oxygen-saturated solution (~1 bar) of 8-MOP and AT-DNA (data not shown),
the 1 µs time constant persists. Since one expects significant oxygen quenching for non-intercalated
8-MOP [52], the time constant τ1 of ~1 µs can be attributed to intercalated 8-MOP.
The respective decay associated difference spectra (DADS) of the data above are shown in Figure 6.
Both bear resemblance with the 8-MOP triplet spectrum [50,51]. The global analysis also yields an
offset spectrum (τ3 = ∞) which matches the steady-state difference spectrum of the photo-addition
(cf. Figure 5, top).
Figure 6. DADS from a multi-exponential global analysis of the nanosecond transient absorption data
of 8-MOP with AT-DNA. The time trace at excitation wavelength 355 nm was not included in the fit.Molecules 2020, 25, 5242 10 of 16
The photoreaction of TMP and AT-DNA was traced by the same approach. A solution of TMP
and AT-DNA in buffered water was excited with nanosecond laser pulses centered at 355 nm (Figure 7).
Due to the low solubility of TMP, signal levels are smaller than those of 8-MOP. Furthermore, the higher
reaction quantum yield ΦR of TMP compared to 8-MOP implies that the reactants are converted to
photo-product after fewer scans. We, therefore, covered only the spectral region centered around
350 nm. In this range, the signature of the photo-product is expected. Around time zero a negative
transient absorption for wavelengths smaller than ~320 nm is observed. This is due to ground state
bleach. For longer wavelengths, a positive signal is detected. The signature is in line with the triplet
signatures of non-intercalated TMP. The respective spectra feature a maximum around 470 nm [17].
Indeed, a single wavelength scan at 470 nm (see Figure 7, orange) reveals a relatively strong time zero
signal. For non-intercalated TMP the signal decays to essentially zero within ~1 µs. The decay for
intercalated TMP proceeds bi-exponentially with time constants of τ1 ~1 µs and τ2 ~40 µs. This decay
goes along with the built-up of an offset signal between 320–360 nm, which matches the steady-state
difference spectrum of the photo-addition. Relative to the time zero signal the offset signal is higher
than the one of 8-MOP. This matches the expectation based on the reaction quantum yield ΦR .
Figure 7. Nanosecond transient absorption of TMP (17 µM) with AT-DNA (1.6 mM) in aerated buffer
solution after excitation at 355 nm. Left: The transient absorption in the contour plot is color-coded.
The green line marks the respective time trace (336 nm) shown on the right. On top is the offset
spectrum in comparison with the steady-state signature (red, scaled to match the offset spectrum) after
irradiation at 375 nm. Right: Time traces at 336 and 470 nm. The third time trace shows TMP (6 µM)
without DNA in water. The colored lines show bi-exponential (green and orange) or single exponential
(violet) fits of the data.
3. Discussion
Our previous results on the furan side photo-addition of AMT to AT-DNA [23] showed that this
addition proceeds via the local triplet state of AMT and a triplet biradical. The present study indicates
that this mechanism also applies to 8-MOP and TMP.
For 8-MOP intercalated into AT-DNA a bi-exponential decay with time constants of τ1 ~1 µs
and τ2 ~10 µs were observed. We assign the time constant τ1 to the decay of the 8-MOP triplet state,
which presumably goes along with the formation of a triplet biradical in which the psoralen at 50
position (see Scheme 1) is connected with the thymine moiety at position 6 by a single bond. The time
constant τ2 would then be associated with the decay of the biradical and formation of the final product.
Seemingly in conflict with this interpretation is the observation that the spectral signatures do not
change much during the τ1 process (cf. Figure 6). Presumably, this is due to similar spectral signatures
of the local triplet state and the triplet biradical. Such similarity was already observed for AMT andMolecules 2020, 25, 5242 11 of 16
AT-DNA [23]. For this system, the intermediary of a triplet biradical found strong support from
time-resolved IR spectroscopy.
For a triplet state as a precursor, the reaction quantum yield ΦR is given by the triplet quantum
yield ΦT times the reaction efficiency of the triplet state ηTR ≤ 1, that is, ΦR = ΦT ·ηTR . The reaction
quantum yield ΦR for the addition of 8-MOP to AT-DNA was determined to be 0.04. The triplet yield
ΦT of non-intercalated 8-MOP was reported to be 0.06 [51]. If this value also applies to intercalated
8-MOP, the efficiency ηTR amounts to 0.67. A similar value is derived from a different approach.
The efficiency ηTR can be obtained from
cPP ct=∞
ηTR = = t=0 , (2)
cT c
cPP is the concentration of the photo-product in the time-resolved experiment. This concentration
is measured at “infinite” times (ct=∞ ). cT is the triplet concentration which is measured at time zero
(ct=0 ). Concentrations cPP and cT can be obtained from the respective difference absorption signals ∆A
and coefficients ∆ε,
∆At347
=∞
nm
∆εT370 nm
ηTR = · . (3)
∆εPP
347 nm
∆A370
t=0
nm
For the photo-product the signal ∆At347=∞
nm
and coefficient ∆εPP
347 nm
at 347 nm, as determined here,
were inserted. For the triplet state the signal ∆At370 =0
nm
, corrected for the intercalated fraction and
coefficient ∆ε370 nm at 370 nm [51] were used. The coefficient ∆ε370 nm refers to 8-MOP in water. With
T T
these values an efficiency ηTR of ~0.6 results. This implies that–compared to AMT–the 8-MOP triplet is
somewhat more reactive (ηTR of AMT: 0.3–0.4 [23]). Due to the smaller triplet yield ΦT of 8-MOP its
overall reaction quantum yield ΦR is smaller (ΦR of AMT: 0.12).
Also, for TMP a bi-exponential decay pattern is observed. The time constants of τ1 = 1 µs and
τ2 = 40 µs are very close to the one reported for AMT intercalated into AT-DNA [23]. Taking the
structural similarity of AMT and TMP into account, this is not surprising. It is therefore also likely
that like with intercalated AMT the time constant τ1 describes the decay of the local triplet state
accompanied by the biradical formation. The time constant τ2 is therefore assigned to the biradical
decay and the formation of the photo-product. The high reaction quantum yield ΦR of 0.4 is somewhat
surprising. The reported triplet yield ΦT of non-intercalated TMP is ~0.1 in methanol [17]. This would
imply an unphysical efficiency ηTR > 1. Our present interpretation of this is that the triplet yield ΦT of
intercalated TMP is substantially larger than the one for non-intercalated TMP. Indications for that
were already observed for AMT [23].
The behavior of 5-MOP is qualitatively different for the one of AMT, 8-MOP and TMP. In line with
earlier studies, our UV/Vis and IR measurements indicate that the photo-addition proceeds via the
pyrone side of the psoralen and not the furan side. Unfortunately, due to the lack of a spectroscopic
signature of this adduct in the accessible UV/Vis range, the formation could not be traced in real-time.
Time-resolved IR experiments ought to be conducted to clarify this in the future.
4. Materials and Methods
4.1. Samples
8-MOP and 5-MOP were purchased from TCI (Tokyo, Japan, >98%) and TMP from Sigma-Aldrich
(Steinheim, Germany, ≥98%). The lyophilized oligonucleotide 50 -(TA)20 -30 was purchased from
Sigma-Aldrich. The manufacturer purified the sample by HPLC. Annealing of the oligonucleotide
strands in solution was performed within 24 h before the measurements by heating the solution in a
water bath up to 93 ◦ C and letting it cool down to room temperature within several hours. Solvents
used were pure water (Fisher Chemical, Loughborough, UK, HPLC gradient grade), deuterium oxide
(Deutero GmbH, Kastellaun, Germany, 99.9% D) and acetonitrile-d3 (Sigma-Aldrich, ≥99.8% D).Molecules 2020, 25, 5242 12 of 16
Solutions of the oligonucleotides were buffered with PBS (Sigma Aldrich, one tablet dissolved in
200 mL yielded 10 mM phosphate buffer, 2.7 mM potassium chloride, 137 mM sodium chloride, pH 7.4
at 25 ◦ C).
4.2. Steady-State Spectroscopy
Absorption spectra in the UV/Vis were recorded with a Lambda 19 spectrometer from Perkin
Elmer. Fused silica cuvettes with path lengths of 0.1, 1 and 5 cm from Hellma were employed.
Absorption spectra in the IR were recorded with an FT-IR-spectrometer Vertex 80v from Bruker Optik.
A custom-made cuvette with a Teflon spacer for a path length of 0.1 mm was used. CaF2 windows of
3 mm thickness from Korth Kristalle were employed. The spectra were corrected for the absorption of
aqueous vapor and HDO, if necessary. All measurements were performed at room temperature.
For the irradiation in the steady-state experiments, LEDs emitting at 375 nm or 390 nm were used.
For the determination of the quantum yield in the UV/Vis experiments the solutions were stirred while
irradiating. With the light power P and the irradiation time t photon equivalents PE were computed
via the equation:
R t R t
nabs (t) I0 · 0
1 − 10−AEx (t) dt P· 0
1 − 10−AEx (t) dt
PE(t) = = = . (4)
nPso nPso h· λcEx ·NA ·nPso
Here, nabs is the amount of the absorbed photons and nPso the amount of psoralen molecules. AEx
refers to the absorption at excitation wavelength λEx . h is defined as the Planck’s constant, c as the
speed of light and NA as Avogadro’s number. A PE of one implies that on average each psoralen
molecule has absorbed one photon.
4.3. Nanosecond Transient Absorption in the UV/Vis
The nanosecond transient absorption data were acquired with a laser flash photolysis spectrometer
LP980 from Edinburgh Instruments in a right-angle geometry. The frequency tripled output (355 nm)
of a Nd:YAG laser (Spitlight 600, InnoLas, Germany) with a repetition rate of 5 Hz and a pulse duration
of 12 ns (FWHM) was utilized for photoexcitation. The excitation energy ranged from 4–17 mJ per
pulse. The diameter of the pump beam was ~8 mm. A pulsed xenon lamp (Osram XBO 150 W/CR OFR)
generated the probe light. Fused silica flow-through cuvettes from Hellma with different path lengths
in pump and probe direction were employed. To gain the best signal to noise ratio while keeping the
turnover rate low, cuvettes with different dimensions (1.5 × 3 mm, 2 × 10 mm or 5 × 10 mm) were used,
depending on the sample. The transmitted probe light was dispersed by a grating monochromator and
detected by a photomultiplier (Hamamatsu, Japan, R928). The signal was digitized by an oscilloscope
(MDO 3022, Tektronix, Beaverton, OR, USA) and the absorption change was calculated based on
measurements with and without laser excitation. For every time trace three sets of 8 consecutive
measurements were averaged. If indicated, solutions were purged with oxygen or nitrogen (99.999%,
Air Liquide, Düsseldorf, Germany). The measurements were performed at 17 ◦ C.
4.4. Data Analysis
The time-resolved data were analyzed with a global multi-exponential fit function
n
− τt
X
∆A(λ, t) = IRF ⊗ ∆Ai (λ)·e i , (5)
i=1
which is convoluted with an instrumental response function (IRF). The IRF was approximated by a
Gaussian with an FWHM of 0.1 µs. The fit yields time constants τi and decay associated difference
spectra (DADS) ∆Ai (λ) [53].Molecules 2020, 25, 5242 13 of 16
5. Conclusions
The photoaddition of three pharmaceutical psoralens (5-MOP, 8-MOP and TMP) to AT-DNA
was studied by steady-state and time-resolved spectroscopy. IR spectroscopy proved to be useful in
distinguishing pyrone side (5-MOP) and furan side (8-MOP and TMP) photoadditions. The furan side
additions were shown to proceed via a local triplet state and a triplet biradical. The present results,
thus, underscore the importance of triplet states for the photo-reactivity. Once this state is populated,
the investigated psoralens add to thymine with high efficiency. So, when optimizing psoralens for
the PUVA therapy, a small dissociation constant KD [54], a low propensity for PET quenching by
guanine [25] and a high triplet yield should be aimed at. Optimizations along these lines are presently
undertaken by us.
Author Contributions: Conceptualization, J.D. and P.G.; methodology, J.D. and P.G.; formal analysis, J.D.;
investigation, J.D., I.T. and K.A.T.; data curation, J.D.; writing—original draft preparation, J.D. and P.G.;
writing—review and editing, J.D. and P.G.; visualization, J.D.; supervision, P.G.; project administration, P.G.;
funding acquisition, J.D. and P.G. All authors have read and agreed to the published version of the manuscript.
Funding: This research was funded by the Deutsche Forschungsgemeinschaft, grant number GI 349/6-1 and the
Jürgen Manchot Stiftung (scholarship for J.D.).
Acknowledgments: Computational infrastructure and support were provided by the Centre for Information and
Media Technology at Heinrich Heine University Düsseldorf. The authors thank Klaus Kelbert for technical support.
Conflicts of Interest: The authors declare no conflict of interest. The funders had no role in the design of the
study; in the collection, analyses, or interpretation of data; in the writing of the manuscript, or in the decision to
publish the results.
References
1. Pathirana, D.; Ormerod, A.; Saiag, P.; Smith, C.; Spuls, P.; Nast, A.; Barker, J.; Bos, J.; Burmester, G.-R.;
Chimenti, S.; et al. European S3-Guidelines on the systemic treatment of psoriasis vulgaris. J. Eur. Acad.
Dermatol. Venereol. 2009, 23, 1–70. [CrossRef] [PubMed]
2. Menter, A.; Korman, N.J.; Elmets, C.A.; Feldman, S.R.; Gelfand, J.M.; Gordon, K.B.; Gottlieb, A.; Koo, J.Y.M.;
Lebwohl, M.; Lim, H.W.; et al. Guidelines of care for the management of psoriasis and psoriatic arthritis.
J. Am. Acad. Dermatol. 2010, 62, 114–135. [CrossRef] [PubMed]
3. Sidbury, R.; Davis, D.M.; Cohen, D.E.; Cordoro, K.M.; Berger, T.G.; Bergman, J.N.; Chamlin, S.L.; Cooper, K.D.;
Feldman, S.R.; Hanifin, J.M.; et al. Guidelines of care for the management of atopic dermatitis. J. Am.
Acad. Dermatol. 2014, 71, 327–349. [CrossRef] [PubMed]
4. Taieb, A.; Alomar, A.; Böhm, M.; Dell’Anna, M.L.; De Pase, A.; Eleftheriadou, V.; Ezzedine, K.; Gauthier, Y.;
Gawkrodger, D.J.; Jouary, T.; et al. Guidelines for the management of vitiligo: The European Dermatology
Forum consensus. Br. J. Dermatol. 2013, 168, 5–19. [CrossRef] [PubMed]
5. Oiso, N.; Suzuki, T.; Wataya-kaneda, M.; Tanemura, A.; Tanioka, M.; Fujimoto, T.; Fukai, K.; Kawakami, T.;
Tsukamoto, K.; Yamaguchi, Y.; et al. Guidelines for the diagnosis and treatment of vitiligo in Japan.
J. Dermatol. 2013, 40, 344–354. [CrossRef] [PubMed]
6. Olsen, E.A.; Hodak, E.; Anderson, T.; Carter, J.B.; Henderson, M.; Cooper, K.; Lim, H.W. Guidelines for
phototherapy of mycosis fungoides and Sézary syndrome: A consensus statement of the United States
Cutaneous Lymphoma Consortium. J. Am. Acad. Dermatol. 2016, 74, 27–58. [CrossRef]
7. Knobler, R.; Berlin, G.; Calzavara-Pinton, P.; Greinix, H.; Jaksch, P.; Laroche, L.; Ludvigsson, J.; Quaglino, P.;
Reinisch, W.; Scarisbrick, J.; et al. Guidelines on the use of extracorporeal photopheresis. J. Eur. Acad.
Dermatol. Venereol. 2014, 28, 1–37. [CrossRef]
8. Ling, T.C.; Clayton, T.H.; Crawley, J.; Exton, L.S.; Goulden, V.; Ibbotson, S.; McKenna, K.; Mohd Mustapa, M.F.;
Rhodes, L.E.; Sarkany, R.; et al. British Association of Dermatologists and British Photodermatology Group
guidelines for the safe and effective use of psoralen-ultraviolet A therapy 2015. Br. J. Dermatol. 2016,
174, 24–55. [CrossRef]
9. Sasaki, M.; Meguro, F.; Kumazawa, E.; Fujita, H.; Kakishima, H.; Sakata, T. Evidence for uptake of
8-methoxypsoralen and 5-methoxypsoralen by cellular nuclei. Mutat. Res. Mol. Mech. Mutagen. 1988,
197, 51–58. [CrossRef]Molecules 2020, 25, 5242 14 of 16
10. Schmitt, I.M.; Chimenti, S.; Gasparro, F.P. Psoralen-protein photochemistry—A forgotten field. J. Photochem.
Photobiol. B Biol. 1995, 27, 101–107. [CrossRef]
11. Hearst, J.E.; Isaacs, S.T.; Kanne, D.; Rapoport, H.; Straub, K. The reaction of the psoralens with deoxyribonucleic
acid. Q. Rev. Biophys. 1984, 17, 1. [CrossRef] [PubMed]
12. Cimino, G.D.; Gamper, H.B.; Isaacs, S.T.; Hearst, J.E. Psoralens as photoactive probes of nucleic acid structure
and function. Annu. Rev. Biochem. 1985, 54, 1151–1193. [CrossRef] [PubMed]
13. Kitamura, N.; Kohtani, S.; Nakagaki, R. Molecular aspects of furocoumarin reactions: Photophysics,
photochemistry, photobiology, and structural analysis. J. Photochem. Photobiol. C Photochem. Rev. 2005,
6, 168–185. [CrossRef]
14. Kanne, D.; Rapoport, H.; Hearst, J.E. 8-Methoxypsoralen-nucleic acid photoreaction. Effect of methyl
substitution on pyrone vs. furan photoaddition. J. Med. Chem. 1984, 27, 531–534. [CrossRef] [PubMed]
15. Vowels, B.R.; Yoo, E.K.; Gasparro, F.P. Kinetic Analysis of Apoptosis Induction in Human Cell Lines by UVA
and 8-MOP. Photochem. Photobiol. 1996, 63, 572–576. [CrossRef] [PubMed]
16. Bensasson, R.V.; Land, E.J.; Salet, C. Triplet excited state of furocoumarins: Reaction with nucleic acid bases
and amino acids. Photochem. Photobiol. 1978, 27, 273–280. [CrossRef]
17. Beaumont, P.C.; Parsons, B.J.; Phillips, G.O.; Allen, J.C. A laser flash photolysis study of the reactivities
of the triplet states of 8-methoxypsoralen and 4,50 ,8-trimethylpsoralen with nucleic acid bases in solution.
Biochim. Biophys. Acta Nucleic Acids Protein Synth. 1979, 562, 214–221. [CrossRef]
18. Beaumont, P.C.; Parsons, B.J.; Navaratnam, S.; Phillips, G.O.; Allen, J.C. The reactivities of furocoumarin
exicted states with DNA in solution. A laser flash photolysis and fluorescence study. Biochim. Biophys. Acta
1980, 608, 259–265. [CrossRef]
19. Serrano-Pérez, J.J.; González-Luque, R.; Merchán, M.; Serrano-Andrés, L. The family of furocoumarins: Looking
for the best photosensitizer for phototherapy. J. Photochem. Photobiol. A Chem. 2008, 199, 34–41. [CrossRef]
20. Serrano-Pérez, J.J.; Merchán, M.; Serrano-Andrés, L. Photoreactivity of Furocoumarins and DNA in PUVA
Therapy: Formation of Psoralen−Thymine Adducts. J. Phys. Chem. B 2008, 112, 14002–14010. [CrossRef]
21. Omar, S.; Eriksson, L.A. Interaction and photobinding between 8-methoxypsoralen and thymine.
Chem. Phys. Lett. 2009, 471, 128–132. [CrossRef]
22. Huang, X.; Zhang, R. A Theoretical Rationale why Furan-side Monoadduct is More Favorable Toward
Diadduct Formation in 8-Methoxypsoralen and Thymine Complexes. Photochem. Photobiol. 2013, 89, 891–899.
[CrossRef] [PubMed]
23. Diekmann, J.; Gontcharov, J.; Fröbel, S.; Torres Ziegenbein, C.; Zinth, W.; Gilch, P. The Photoaddition
of a Psoralen to DNA Proceeds via the Triplet State. J. Am. Chem. Soc. 2019, 141, 13643–13653.
[CrossRef] [PubMed]
24. Isaacs, S.T.; Shen, C.-K.J.; Hearst, J.E.; Rapoport, H. Synthesis and characterization of new psoralen derivatives
with superior photoreactivity with DNA and RNA. Biochemistry 1977, 16, 1058–1064. [CrossRef] [PubMed]
25. Fröbel, S.; Levi, L.; Ulamec, S.M.; Gilch, P. Photoinduced Electron Transfer between Psoralens and DNA:
Influence of DNA Sequence and Substitution. ChemPhysChem 2016, 17, 1377–1386. [CrossRef]
26. Fröbel, S.; Reiffers, A.; Torres Ziegenbein, C.; Gilch, P. DNA Intercalated Psoralen Undergoes Efficient
Photoinduced Electron Transfer. J. Phys. Chem. Lett. 2015, 6, 1260–1264. [CrossRef] [PubMed]
27. Isaacs, S.T.; Chun, C.; Hyde, J.E.; Rapoport, H.; Hearst, J.E. A Photochemical Characterization of Reactions of
Psoralen Derivatives with DNA. In Trends in Photobiology; Springer US: Boston, MA, USA, 1982; pp. 279–294.
28. Musajo, L.; Rodighiero, G.; Colombo, G.; Torlone, V.; Dall’Acqua, F. Photosensitizing furocoumarins: Interaction
with DNA and photo-inactivation of DNA containing viruses. Experientia 1965, 21, 22–24. [CrossRef]
29. El-Gogary, T.M.; El-Gendy, E.M. Noncovalent attachment of psoralen derivatives with DNA: Hartree–Fock
and density functional studies on the probes. Spectrochim. Acta Part A Mol. Biomol. Spectrosc. 2003,
59, 2635–2644. [CrossRef]
30. Dougherty, G.; Pigram, W.J. Spectroscopic Analysis of Drug-Nucleic Acid Interaction. Crit. Rev. Biochem.
1982, 12, 103–132. [CrossRef]
31. Hyde, J.E.; Hearst, J.E. Binding of psoralen derivatives to DNA and chromatin: Influence of the ionic
environment on dark binding and photoreactivity. Biochemistry 1978, 17, 1251–1257. [CrossRef]Molecules 2020, 25, 5242 15 of 16
32. Isaacs, S.T.; Wiesehahn, G.; Hallick, L.M. In vitro characterization of the reaction of four psoralen derivatives
with DNA. Natl. Cancer Inst. Monogr. 1984, 66, 21–30. [PubMed]
33. Kanne, D.; Straub, K.; Rapoport, H.; Hearst, J.E. Psoralen-Deoxyribonucleic Acid Photoreaction.
Characterization of the Monoaddition Products from 8-Methoxypsoralen and 4,50 ,8-Trimethylpsoralen.
Biochemistry 1982, 21, 861–871. [CrossRef] [PubMed]
34. Straub, K.; Kanne, D.; Hearst, J.E.; Rapoport, H. Isolation and Characterization of Pyrimidine-Psoralen
Photoadducts from DNA. J. Am. Chem. Soc. 1981, 103, 2347–2355. [CrossRef]
35. Oroskar, A.; Olack, G.; Peak, M.J.; Gasparro, F.P. 40 -Aminomethyl-4,50 ,8-trimethylpsoralen photochemistry:
The effect of concentration and UVA fluence on photoadduct formation in poly(dA-dT) and calf thymus
DNA. Photochem. Photobiol. 1994, 60, 567–573. [CrossRef]
36. Tessman, J.W.; Isaacs, S.T.; Hearst, J.E. Photochemistry of the Furan-Side 8-Methoxypsoralen-Thymidine
Monoadduct Inside the DNA Helix. Conversion to Diadduct and to Pyrone-Side Monoadduct. Biochemistry
1985, 24, 1669–1676. [CrossRef]
37. Rodighiero, G.; Musajo, L.; Dall’acqua, F.; Marciani, S.; Caporale, G.; Ciavatta, L. Mechanism of
skin photosensitization by forucoumarins. Biochim. Biophys. Acta Nucleic Acids Protein Synth. 1970,
217, 40–49. [CrossRef]
38. Anselmino, C.; Voituriez, L.; Cadet, J. Characterization of the cis-syn and cis-anti Diastereoisomers
of 5-Methoxypsoralen Pyrone-Side Monocycloadducts to Thymidine. Chem. Res. Toxicol. 1993,
6, 858–865. [CrossRef]
39. Demaret, J.-P.; Brunie, S.; Ballini, J.-P.; Vigny, P. Geometry of Intercalation of Psoralens in DNA Approached
by Molecular Mechanics. Photochem. Photobiol. 1989, 50, 7–21. [CrossRef]
40. Finkelstein, N.; Albrecht, C.F.; van Jaarsveld, P.P. Isolation and structure elucidation of xanthotoxin, a
phototoxic furanocoumarin, from Peucedanum galbanum. South African J. Bot. 1993, 59, 81–84. [CrossRef]
41. Masuda, T.; Takasugi, M.; Anetai, M. Psoralen and other linear furanocoumarins as phytoalexins in Glehnia
littoralis. Phytochemistry 1998, 47, 13–16. [CrossRef]
42. Lee, C.; Cho, M. Vibrational dynamics of DNA. II. Deuterium exchange effects and simulated IR absorption
spectra. J. Chem. Phys. 2006, 125, 114509. [CrossRef] [PubMed]
43. Frisch, M.J.; Trucks, G.W.; Schlegel, H.B.; Scuseria, G.E.; Robb, M.A.; Cheeseman, J.R.; Scalmani, G.; Barone, V.;
Petersson, G.A.; Nakatsuji, H.; et al. Gaussian 09, Revision A.02; Gaussian, Inc.: Wallingford, CT, USA, 2016.
44. Koch, W.; Holthausen, M.C. A Chemist’s Guide to Density Functional Theory; Wiley-VCH Verlag GmbH:
Weinheim, Germany, 2001; Volume 3, ISBN 3527303723.
45. Stemple, N.R.; Watson, W.H. The crystal and molecular structure of xanthotoxin, C12 H8 O4 . Acta Crystallogr.
Sect. B Struct. Crystallogr. Cryst. Chem. 1972, 28, 2485–2489. [CrossRef]
46. Lee, C.; Park, K.H.; Cho, M. Vibrational dynamics of DNA. I. Vibrational basis modes and couplings.
J. Chem. Phys. 2006, 125, 114508. [CrossRef] [PubMed]
47. Spielmann, H.P.; Dwyer, T.J.; Hearst, J.E.; Wemmer, D.E. Solution Structures of Psoralen Monoadducted and
Cross-Linked DNA Oligomers by NMR Spectroscopy and Restrained Molecular Dynamics. Biochemistry
1995, 34, 12937–12953. [CrossRef] [PubMed]
48. Fujii, I.; Aoyama, N.; Miike, A.; Hirayama, N. Crystal Structure of a Potent Pigmentation Agent Trioxsalen.
Anal. Sci. 1998, 14, 871–872. [CrossRef]
49. Bauri, A.K.; Foro, S.; Nhu Do, Q.N. Crystal structure of bergapten: A photomutagenic and photobiologically
active furanocoumarin. Acta Crystallogr. Sect. E Crystallogr. Commun. 2016, 72, 1194–1196. [CrossRef]
50. Sloper, R.W.; Truscott, T.G.; Land, E.J. The Triplet State of 8-Methoxypsoralen. Photochem. Photobiol. 1979,
29, 1025–1029. [CrossRef]
51. Craw, M.; Bensasson, R.V.; Ronfard-Haret, J.C.; Melo, M.T.S.; Truscott, T.G. Some Photophysical Properties of
3-Carbethoxypsoralen, 8-Methoxypsoralen and 5-Methoxypsoralen Triplet States. Photochem. Photobiol. 1983,
37, 611–615. [CrossRef]
52. Berkoff, B.; Hogan, M.; Legrange, J.; Austin, R. Dependence of oxygen quenching of intercalated methylene
blue triplet lifetime on DNA base-pair composition. Biopolymers 1986, 25, 307–316. [CrossRef]Molecules 2020, 25, 5242 16 of 16
53. Satzger, H.; Zinth, W. Visualization of transient absorption dynamics—Towards a qualitative view of complex
reaction kinetics. Chem. Phys. 2003, 295, 287–295. [CrossRef]
54. Buhimschi, A.D.; Gooden, D.M.; Jing, H.; Fels, D.R.; Hansen, K.S.; Beyer, W.F.; Dewhirst, M.W.; Walder, H.;
Gasparro, F.P. Psoralen Derivatives with Enhanced Potency. Photochem. Photobiol. 2020, 1014–1031.
[CrossRef] [PubMed]
Sample Availability: Samples of all compounds are not available from the authors.
Publisher’s Note: MDPI stays neutral with regard to jurisdictional claims in published maps and institutional
affiliations.
© 2020 by the authors. Licensee MDPI, Basel, Switzerland. This article is an open access
article distributed under the terms and conditions of the Creative Commons Attribution
(CC BY) license (http://creativecommons.org/licenses/by/4.0/).You can also read


