Trade liberalization, employment, and gender in Ethiopia - WIDER Working Paper 2021/59
←
→
Page content transcription
If your browser does not render page correctly, please read the page content below

WIDER Working Paper 2021/59

Trade liberalization, employment, and gender in
Ethiopia

Giorgia Giovannetti,1,2 Marco Sanfilippo,3,4 and Arianna Vivoli1, *

March 2021
Abstract: This paper analyses the impact of trade liberalization on local labour markets in
Ethiopia, with a focus on the gender dimension of employment. By exploiting rich micro-level
data on Ethiopian workers, we evaluate the effect of the Ethiopian trade reforms on the changes
and composition of employment, adopting as unit of analysis Ethiopian districts. We find that
districts more exposed to trade liberalization experienced reductions in their employment levels,
especially in female employment. We also show that reductions in (agricultural) input tariffs
triggers a process of sectoral reallocation from agriculture to services and that this process is
particularly pronounced for women. This in turns contributes to increase sectoral segregation.
Key words: tariffs, employment, structural transformation, gender, Ethiopia
JEL classification: C23, F14, F16, J16
Acknowledgements: Access to the individual survey data used in this paper has been granted
under a confidential agreement with the Central Statistics Agency of Ethiopia. The authors thank
Fitsum Mulugeta and the Ethiopian Economic Association for facilitating access to the data.

1 University of Florence, Firenze, Italy; 2 European University Institute, Firenze, Italy; 3 University of Turin, Torino, Italy;
4 University of Antwerp, Antwerpen, Belgium; * corresponding author: Arianna Vivoli, arianna.vivoli@unitn.it
This study has been prepared within the UNU-WIDER project Women’s work – routes to economic and social empowerment.
Copyright © UNU-WIDER 2021
UNU-WIDER employs a fair use policy for reasonable reproduction of UNU-WIDER copyrighted content—such as the
reproduction of a table or a figure, and/or text not exceeding 400 words—with due acknowledgement of the original source,
without requiring explicit permission from the copyright holder.
Information and requests: publications@wider.unu.edu
ISSN 1798-7237 ISBN 978-92-9256-997-6
https://doi.org/10.35188/UNU-WIDER/2021/997-6
Typescript prepared by Ayesha Chari.
United Nations University World Institute for Development Economics Research provides economic analysis and policy advice
with the aim of promoting sustainable and equitable development. The Institute began operations in 1985 in Helsinki, Finland, as
the first research and training centre of the United Nations University. Today it is a unique blend of think tank, research institute,
and UN agency—providing a range of services from policy advice to governments as well as freely available original research.
The Institute is funded through income from an endowment fund with additional contributions to its work programme from
Finland, Sweden, and the United Kingdom as well as earmarked contributions for specific projects from a variety of donors.
Katajanokanlaituri 6 B, 00160 Helsinki, Finland
The views expressed in this paper are those of the author(s), and do not necessarily reflect the views of the Institute or the United
Nations University, nor the programme/project donors.
1 Introduction

In the 1980s, several developing countries started to implement trade reforms to stimulate their
economies and possibly improve their living standards. Ethiopia was no exception to this general
trend. Following the Structural Adjustment Programme from the World Bank and the
International Monetary Fund (Easterly 2003), from 1992–93 onwards Ethiopia implemented trade
reforms in order to reduce barriers to trade and to open up to foreign competition as a strategy of
long-term growth (Jones et al. 2011). However, evidence on the effects of trade liberalization in
Ethiopia is scant and mostly focused on (manufacturing) firms (Bigsten et al. 2016; Fiorini et al.
2019).

In this paper, we use micro-level data to investigate the effects of trade liberalization on local
labour markets in Ethiopia. More specifically, we exploit variation in output and input tariffs across
local labour markets over time to check whether and how increased international competition
affects employment. In addition, with Ethiopia being largely characterized by high levels of
agricultural employment, we ask specifically whether trade liberalization has affected the process
of structural transformation in the country.

Since tariffs vary across goods, and households have different sources of income and spending
habits, trade policies are likely to have a heterogeneous impact on workers in different sectors,
with different skills, and across women and men. Throughout the paper we adopt a gender
perspective. Whereas tariff reductions took place predominantly in female-dominated sectors, in
the period covered by our study, the gender employment gap dropped from 20 percentage points
in 1994 to 12 percentage points in 2013. The structural transformation of the Ethiopian economy
from the agricultural sector to the services sector seems to concern especially female workers, but
with only low-skilled services growing following a reduction in input tariffs. Understanding
whether trade liberalization has fostered gender-specific changes in the labour market is an
important issue in view of the large gender gaps that remain in the Ethiopian labour market (Essers
et al. 2021; WB and WTO 2020).

Theoretically, changes in tariffs result in two simultaneous effects: on the one hand, trade
liberalization increases competitive pressures in the output market; on the other hand, it also
increases the competitiveness of firms by reducing their input costs.

According to the literature, a reduction in output tariffs due to trade liberalization may stimulate
labour demand through two opposite channels (Winters and Di Ubaldo 2020). 1 It can generate
disruptive effects on employment levels since domestic markets may be penetrated by cheaper
imported products. The negative price shock can, in turn, hamper domestic production, thereby
inducing firms to fire workers if their production drops or if they exit the market [this was found,
for instance, by Revenga (1997) for Mexico and by Dix-Carneiro and Kovak (2017) for Brazil].
On the other hand, the pro-competitive effect of a drop in output tariffs may induce firms to
invest to remain competitive; if these investments bring factor substitution towards labour,
international trade can also increase labour demand (e.g., for Mauritius: Milner and Wright 1998).

For input tariffs, theory predicts different effects. Lower input tariffs are supposed to increase
firms’ productivity through several channels, including via a learning effect, through the acquisition

1
 For an extensive review on the subject, see Goldberg and Pavcnik (2007b), Hoekman and Winters (2005), and Cirera
et al. (2014).

 1
of foreign technology embodied in imported inputs (in some cases, leading to the so-called skill-
biased technological change), through an increase in the quality, and the variety of inputs. The
effect of lower input tariffs in low-income countries has been empirically investigated, among
others, by Amiti and Konings (2007) and Goldberg et al. (2010) for Indonesia and India,
respectively. Both studies find that cheaper inputs (because of lower input tariffs) increase firms’
productivity. Goldberg et al. (2010) also find an increase in new products, output, and research
and development for Indian firms. This increase in productivity might expand production and,
therefore, increase employment. At the same time, if productivity growth exceeds output growth
(for instance, because of the lack of skilled workers or infrastructure and because in some sectors
technological inputs free up workforce that is not absorbed by other sectors), employment might
also decrease (Meschi and Vivarelli 2009).

Trade liberalization may have relevant heterogenous consequences across genders; women tend
to hold a disproportionate share of low-skilled jobs and often are engaged in less productive
activities, especially in agriculture (WB and WTO 2020). Hence, trade policy, which is in principle
gender neutral, can affect women more. The literature has proposed several channels through
which trade liberalization may affect female labour force participation. The first is by reducing
discrimination. As initially proposed by Becker (1957), only employers with market power can
engage in discriminatory practices, whereas employers operating in a perfectly competitive market
cannot, because discrimination is costly. Becker’s theory, confirmed by many empirical tests (e.g.,
for industries in the United States: Black and Brainerd 2004; for Colombia: Ederington et al. 2009),
implies that women should benefit more from an increase in competition (i.e. from a lowering in
output tariffs), thereby lowering the gender employment gap. In a similar vein, Schultz (2007)
highlights that trade liberalization triggers an increase of human capital and gender equality.
Another channel through which output tariffs might affect women has to do with social norms.
Indeed, if cultural norms, preferences or even stigmas play a role in the definition of which sectors
are more ‘appropriate’ for men and women, when foreign competition induces structural
transformation, there might be gender-specific shifts in the reallocation across sectors, changing
the sectoral segregation of the economy (Goldin 1995; Gaddis and Pieters 2017; Wang et al. 2020).
Further, given that technologies can affect the composition of employment, a shift towards more
capital or technological-intensive activities can favour employment of women because women are
less likely to be involved in physically demanding activities than men. If women’s labour
productivity is more closely tied to the capital intensity of production, the adoption of more
sophisticated technologies in response to input or output tariff reductions can favour gender
employment and their wages [as shown for instance by Juhn et al. (2014) for Mexico]. Finally,
provided that a certain level of sectoral segregation of male and female workers is common, the
outcomes of trade liberalization in terms of structural transformation will not be neutral to existing
structures (Pieters 2018). For instance, in Indonesia input tariff reductions in the 1990s led to
higher employment rates, which happened to be concentrated among women, since female-
intensive industries relied to a greater extent on inputs for which import tariffs declined most (Kis-
Katos et al. 2018).

Ultimately, the impact of trade policies, as well as their consequences on gender and structural
transformation, is an empirical question, possibly different in different countries, and between
different groups of workers and sectors. We address this question using micro-level data for
Ethiopia over a 20-year period. In our study, we combine the 1994 population census with the
three waves of the Ethiopian National Labour Force (NLF) Survey, covering the years 1999, 2005,
and 2013 (Minnesota Population Center 2015; CSA 1994, 2004, 2006, 2014). Individual-level
information is re-aggregated in a panel dataset of 388 districts (woreda, the third administrative
division of Ethiopia). Our identification strategy links changes in tariffs with changes in the

 2
composition of the local workforce on the basis of a district’s exposure to trade (as in Autor et al.
2016; Kovak 2013; Topalova 2007).

Our results show that districts more exposed to trade liberalization experienced a reduction in
employment—a result that is robust to several specifications—and that female workers were more
affected than male workers. Moreover, we find evidence of a contribution of trade liberalization
(especially in the form of lower input tariffs) to the structural transformation of the Ethiopian
economy from agriculture to services, even though the shift to services cannot make up for the
employment losses in the agricultural sector; this transition seems to be mostly driven by a higher
mobility of the female component of the workforce. In this context, if stringent social norms or
preferences are in place, liberalization and sectoral reallocation can have important implications
for women, increasing sectoral segregation. We test this channel and find that input tariffs increase
sectoral segregation. Finally, we extend our analysis to other dimensions related to employment,
by looking at the effect of trade liberalization on unemployment, education, and movements within
the services sector; we find that reductions in input tariffs decrease women’s educational
attainment (but not for men) and push them to move into low value-added industries, such as
community services and private household activities.

Our work fits into a large body of literature that has investigated the effects of trade liberalization
on employment and gender. Although initially this literature has mostly focused on the firm level
(e.g., Edwards 2004) or on the worker level (e.g., for Mexico: Feliciano 2001; for Colombia:
Attanasio et al. 2004), more recent work has looked into labour markets with a regional
perspective. To some extent, our findings are consistent with the results from various other
contexts in which trade liberalization has been found to reduce employment (e.g., for India:
Topalova 2007; for Brazil: Kovak 2013; Dix-Carneiro and Kovak 2017; for the United States:
Autor et al. 2016; for South Africa: Lepelle and Edwards 2020).

Our findings on the gender-specific effects of trade liberalization contributes to the existing
evidence, which so far does not provide univocal results. Wang et al. (2020) and Kyander (2020)
find positive effects of import competition on female work for China and India, respectively,
especially in the manufacturing sector and for women with limited or no schooling. Trade
liberalization (proxied by a decrease in output tariffs) in Mexico 2 increases formalization in the
manufacturing sector between genders, but men benefit the most, while in the services sector,
women experience an increase in informality (Ben Yahmed and Bombarda 2020). More in line
with (some of) our results, female workers in Indonesia have responded more strongly to the
positive labour demand shock of input tariff liberalization than male workers (Kis-Katos et al.
2018). Similarly, in Brazil lower output tariffs reduce the gender employment gap and increase
male unemployment, also shifting general employment towards trade and services (Gaddis and
Pieters 2017). A similar shift in our analysis is due to input rather than output tariffs.

Our results are also consistent with international trade literature showing that openness to trade
can shape the process of structural transformation (Fajgelbaum and Redding 2014). In this respect,
Erten et al. (2019) suggest the existence of a causal relationship between trade openness and
structural transformation away from agriculture across Chinese counties following WTO
accession. For South Africa, Lepelle and Edwards (2020) find that tariff liberalization is associated

2
 A recent report (WB and WTO 2020) points out that the impact of trade policy on the probability of working
formally for women (in Mexico after the North American Free Trade Agreement) are not uniform (positive for large
firms and negative for small firms), but also that the African Continental Free Trade Area is likely to boost female
employment, particularly for skilled women, with the gender or skill wage gap worsening in only a few countries.

 3
with a decline in the manufacturing–services ratio, even though their result is driven by a decline
in the manufacturing sector rather than by a rise in services, especially in more exposed regions.
Among other things, they also find that the decline in manufacturing employment was more
pronounced for Black women, reflecting their relevant presence in those sectors more exposed to
tariff cuts (e.g., clothing and textiles) and that also this group was unable to relocate into the
services sector.

The remainder of the paper is structured as follows. Section 2 provides a quick overview on the
trade liberalization process of Ethiopia over the period 1993–2013. Section 3 describes the data
and methodology. Section 4 contains our main results. The underlying mechanism and extensions
are analysed in Section 5 and Section 6 concludes.

2 Ethiopian trade liberalization

By the beginning of the 1990s, like many other developing countries, Ethiopia abandoned the
import-substituting policy that the country had pursued both in a private-led way (from the early
1950s to 1974, during the Imperial regime) and in a public-led way (from 1974 to 1991, under the
Dergue regime) (Gebreeyesus 2016). In 1991 the new government, led by the Ethiopian People’s
Revolutionary Democratic Front, decided to turn to a more market-oriented economic policy and
to implement various reforms under the Structural Adjustment Programme sponsored by the
World Bank and the International Monetary Fund. As far as trade policy was concerned, the main
objectives were the reduction of both tariff and non-tariff barriers and the devaluation of the birr,
the national currency. The Ethiopian government implemented six waves of tariff reforms
between 1993 and 2003; before 1993 the tariff rates ranged from 0 to 240 per cent, in 1995 the
range was reduced to 0–80 per cent, and in 2002 to 0–35 per cent; meanwhile, the number of tariff
bands fell from 23 to 6, including the 0 tariff band (Bigsten et al. 2016).

In this paper, we use tariffs data from the World Integrated Trade Solution (WITS) database (see
World Bank 2021). More precisely, we extract the Ethiopian import tariff rates 3 at the three-digit
level (following the ISIC Rev. 3 classification; see United Nations 1990) for each of the years in
our dataset and use them to construct our trade exposure measures for both input and output
tariffs. Following Topalova (2007, 2010), Ethiopian industry-specific import tariffs are weighted
using the district-level composition of employment at the baseline year. 4

For output tariffs, we calculate the number of employed workers in each sector s at the baseline
( , ,1994 ) by district k and divide these figures for the total employment by district
( ,1994 ). 5 We then merge these weights with time-varying sector-specific tariff data

3
 We use the trade-weighted average of the World Trade Organization’s ‘Most Favoured Nation’ ad valorem tariff rate
at the industry level.
4
 To be more in line with Topalova (2007), we should have used pre-liberalization information on employment in
districts; that is, in the Ethiopian case, information before 1993. Unfortunately, our most remote information comes
from the 1994 census, which is 1 year after the starting of the liberalization period. We acknowledge this limit of our
data.
5 Given that tariff data from the WITS database are expressed using the ISIC Rev. 3 at the three-digit level, we

harmonized the sectoral information from the 1994 census and the 1999, 2005, and 2013 NLF to this international
classification.

 4
( , ). Lastly, we sum by district. In this way, we end up having a district-level trade exposure
measure, as shown in the formula below:

 , ,1994
 , = � × ,
 ,1994
 =1

where t=1994, 1999, 2005, and 2013. This measure indicates how much a district has been exposed
to output tariff reduction, given the district’s employment composition across sectors in the initial
year. For the way it is constructed, a reduction in output tariffs should capture the effect of a
reduction of prices in the output market and, therefore, an increase in foreign competition. As far
as the non-tradeable sector 6 is concerned, we follow Autor et al. (2016), Kis-Katos and Sparrow
(2011), and Topalova (2007) and we treat it as an additional sector, setting tariffs to zero, thereby
including also its workforce in the weighting of tariffs. 7

To account for input tariffs, we create an analogous district-level trade exposure measure:

 , ,1994 , ,2005
 , = �� × �� × , ��,
 ,1994 ,2005
 =1 =1

which is equivalent to the output tariff exposure measure, with the only difference that here tariffs
are first weighted with the input shares , that each sector s acquires from each sector I, and
then the product is weighted for the district’s employment share. We extract information on input
shares from the 2005–06 Ethiopia Input Output (I/O) Table and Regionalized Social Accounting
Matrix (SAM), constructed by the Ethiopian Development Research Institute and the
International Food Policy Research Institute (IFPRI) (see Tebekew et al. 2009). 8 To construct the
input tariff measure we proceed in the following way: as the Ethiopian SAM table we used is only
commodity-by-activity (with 58 commodities and 47 activities 9), and only the activity account is
classified according to the ISIC Rev. 3.1 classification, we first had to harmonize the commodity
account according to the ISIC classification and assign each commodity to an activity category;
once done, it is possible to assign the tariff level of the same ISIC class to each category (coded
according to the ISIC classification). Next, we calculated the industry-specific input tariffs for each
year of our panel by multiplying each I/O coefficient (from the ‘intermediate input demand’
section of the I/O table) for its tariff and, finally, we weighted them for the district industry-
specific employment weights, as for the output tariffs.

6
 We classify as non-tradeable sectors all those industries for which the WITS database does not provide information
on tariffs. This includes all industries included from division E to division Q in the ISIC Rev. 3 classification.
7
 We also perform the baseline analysis for output tariffs excluding the non-tradeable sector from the weights.
Estimates are still significant and point to the same direction, but figures get smaller. Conversely, for the input tariff
analysis we follow Kis-Katos and Sparrow (2015) and Kis-Katos et al. (2018) and we include both tradeables and non-
tradaebles in the output sectors (s), but only tradaebles in the input suppling sectors (i).
8
 We acknowledge that the optimal solution would have been to use data from a pre-sample input–output (I/O) table;
unfortunately, the IFPRI I/O table is the first available constructed with real Ethiopian data. Moreover, we are quite
confident that I/O coefficients remain quite stable over time.
9
 Usually the number of activities in a social accounting matrix (SAM) tends to be smaller, but the IFPRI SAM has a
relatively high level of disaggregation for production activities and commodities in the Ethiopian economy, especially
for what concerns the agricultural sub-sectors.

 5
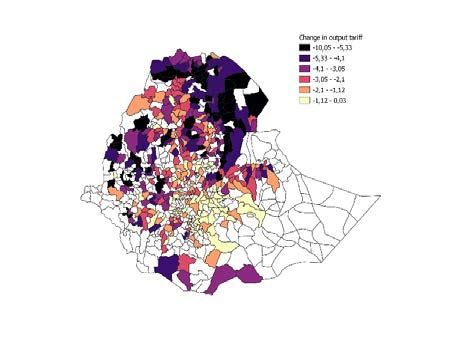
Figure 1 shows changes of average (input and output) tariff rates in Ethiopia over the period
covered in this study. 10 Figure 2 shows how output and input tariff exposure measure varies
substantially across districts over the period considered.
Figure 1: Trends in tariffs

 30

 25

 20

 15
 %

 10

 5

 0
 1995 1996 1997 1998 1999 2000 2001 2002 2003 2004 2005 2006 2007 2008 2009 2010 2011 2012 2013

 Input tariff Output tariff

Source: authors’ elaboration on WITS data (World Bank 2021).

Figure 2: Changes in output and input tariffs (%) by Ethiopian districts

Source: authors’ elaboration on the census, NLF, and WITS data (Minnesota Population Center 2015; CSA 1994,
2004, 2006, 2014; World Bank 2021).

Figure 3 reports the percentage change in tariff reduction for the main economic sectors, defined
according to the two-digit code of the ISIC Rev. 3 classification. It shows that the larger reductions
took place in those sectors that absorb most of the Ethiopian workforce, namely agriculture (−75

10
 Unfortunately, WITS reports tariffs for Ethiopia only since 1995 and not for all years (data on tariffs are missing
for 1996–2000, 2003–05, 2007, and 2013). Therefore, we use the 1995 tariff rate as a proxy for the 1994 tariff rate and
we linearly interpolate tariff data where missing.

 6
per cent), food production (−68 per cent), and wood (−72 per cent), whereas the only sector more
protected was the basic metal sector (+74 per cent).
Figure 3: Changes (%) in tariffs by sector (1993–2013)

 Agriculture
 Basic metals
 Chemicals
 Coke, refined petroleum products
 Electrical machinery
 Extraction of crude petroleum and natural gas
 Fabricated metals
 Fishing
 Food products and beverages
 Forestry
 Leather
 Machinery and equipment
 Mining and quarrying
 Paper and paper products
 Publishing
 Rubber and plastic products
 Textiles
 Tobacco
 Wearing apparel
 Wood
 -100% -80% -60% -40% -20% 0% 20% 40% 60% 80% 100%

Source: authors’ elaboration on WITS data (World Bank 2021).

3 Data and empirical analysis

3.1 Worker-level data

We harmonize and merge the 1994 population census with three existing waves of the Ethiopian
NLF Survey, for 1999, 2005, and 2013. The 1994 census provides information on the socio-
demographic characteristics of the respondents. It provides information also on their employment
status, including the sectoral distribution of workers. 11 The NLF, administered by the Central
Statistics Agency (CSA), 12 provides information about labour under-utilization, unemployment,
and the working conditions of persons in employment. We restrict the sample to the working age
population (i.e. those aged 15–64 years 13) and harmonize the sectoral affiliation of workers using
the ISIC Rev. 3 classification.

11
 Information on the employment status of individuals, and their sectoral distribution, is not included in the most
recent census (2007).
12 TheNLF surveys are nationally representative. They cover all urban and rural areas of the country, except the non-
sedentary areas in the Somali region. The sampling frame to select enumerator areas is provided by the population
census (the 1994 census for the 1999 and 2005 NLF and the 2007 census for the 2013 NLF). All the relevant
information on the sampling procedures, coverage, and full descriptive statistics are available from the survey reports
published by the Ethiopian Central Statistical Agency (see CSA 2014).
 We also check the robustness of our results by running the baseline regressions with the whole sample (i.e. including
13

workers not only between 15 and 64 years but of all ages) and the results remain stable.

 7
After harmonizing the 1994 census with the three waves of NLF, we collapse the individual-level
dataset to the district level (woreda) using sampling weights. The result is a panel of Ethiopian
districts over 4 years. For consistency, we decided to confine the analysis only to woreda whose
name appear at least twice in the four waves of the panel. This results in an unbalanced panel
including 388 districts representing the 88.71 per cent of estimated population and 89.31 per cent
of the total workforce.

Table 1 provides an overview on the socio-demographic characteristics of our working sample.
Figure 4 provides change in the distribution of male and female workers across sectors between
1994 and 2013. Employment levels are generally high while the employment gender gap has
decreased from almost 20 percentage points in 1994 to 12 percentage points in 2013. 14 Education
steadily increases but the educational attainments remain quite low, especially for women (on
average, in 2013 women have 1.98 years of education whereas men have 3.31 years).
Table 1: Socio-demographic characteristics of the working sample

 1994 1999 2005 2013
Male (%) 49.13 47.40 47.18 48.86
Age (years) 31.38 31.83 31.67 31.75
Urban (%) 9.59 12.86 13.75 5.52
Employed (%) 78.50 64.06 84.07 82.25
Unemployed (%) 1.12 1.54 1.34 1.09
Years of school 0.95 1.21 1.70 2.62
Illiterate (%) 78.19 69.73 63.49 49.40
Agriculture (%) 88.89 72.96 76.31 74.40
Manufacturing (%) 1.78 6.19 7.36 6.25
Services (%) 6.68 17.96 14.89 18.49

Source: authors’ elaboration on the census and NLF data (Minnesota Population Center 2015; CSA 1994, 2004,
2006, 2014).

Needless to say, the predominant source of employment is agriculture, especially among men.
While manufacturing was not yet able to take off in the Ethiopian economy, 15 structural
transformation is going towards the services sector, which in 2013 employed almost 21 per cent
of the total workforce. In proportion, female employment reduced more than that of men in the
agricultural sector and increased more in the services sector.

14
 The employment rate of men (women) is calculated by dividing the number of men (women) aged 15–64 years in
employment by the total male (female) population of the same age group.
15
 The weaknesses of the manufacturing sector in Ethiopia has been widely recognized by many studies (Diao et al.
2021). To give an idea, Sutton and Kellow (2010), who conducted an in-depth analysis of the Ethiopian secondary
sector, documented that 78 per cent of exports come from a few labour-intensive primary sector industries: coffee,
oilseeds, khat (chat), while the remaining 22 per cent come from only four industries: cut flowers, leather, meat and
meat products, and clothing and textiles.

 8
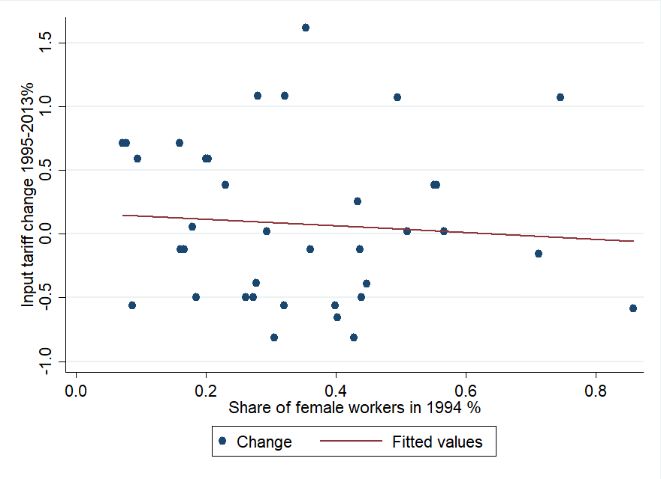
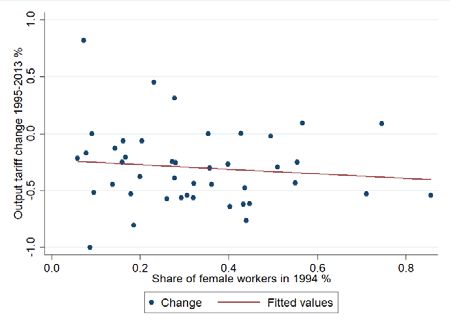
Figure 4: Change in distribution of workers across sectors in 1994 and 2013

 0.20

 0.15

 0.10

 0.05

 -
 Employed Agriculture Manufacturing Services
 (0.05)
 %

 (0.10)

 (0.15)

 (0.20)

 (0.25)

 (0.30)

 Female Male

Source: authors’ elaboration on the census and NLF data (Minnesota Population Center 2015; CSA 1994, 2004,
2006, 2014).

In addition to the two aforementioned gender-related stylized facts, that is, a decreasing
employment gender gap and a (though not yet well pronounced) shift from the male-dominated
agricultural sector to the female-dominated services sector, there is a third fact that motivates our
focus on gender. Figure 5 plots changes in tariffs against the initial share of female employment in
each industry. Sectors that in 1994 were more female-intensive witnessed larger tariff cuts,
especially output tariff cuts, suggesting that we might find differential impacts of tariffs reduction
across gender.
Figure 5: Tariff declines (1994–2013) and initial female employment shares (1994)

Source: authors’ elaboration on the census, NLF, and WITS data (Minnesota Population Center 2015; CSA 1994,
2004, 2006, 2014; World Bank 2021).

 9
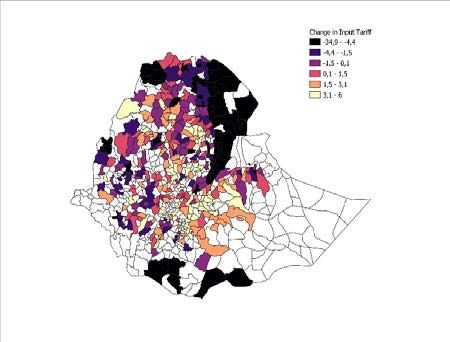
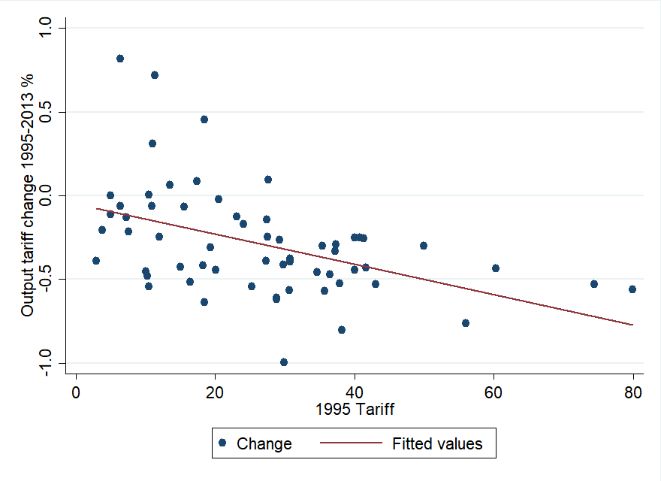
3.2 Empirical strategy

We aim at estimating the impact of trade liberalization on employment levels by adopting a local
labour market perspective and by considering the Ethiopian trade liberalization as a sort of natural
experiment. This is possible considering the relatively short-time frame (1993–2003) in which
Ethiopian tariffs were reduced and, as we will argue later, the likely exogenous nature of this policy.
The identification strategy follows existing work on the effect of trade liberalization on local labour
markets (Autor et al. 2016; Kovak 2013). By exploiting the cross-sectional variation in the
employment structure of districts at the onset of the trade liberalization programme, we aim at
comparing the heterogenous response in terms of district employment levels and other socio-
economic outcomes between districts more exposed to tariff reduction compared with those more
protected.

For the causal identification to be valid, the treatment (i.e., the exposure to trade liberalization)
should be exogenous to the outcomes analysed. There is a widespread concern in the trade
literature regarding the endogeneity of tariffs; indeed, it is reasonable to question whether labour
market conditions, such as a fall in the employment rate for instance, might influence political
decisions about raising tariffs (or taking other protectionist measures) in some sectors, thereby
introducing a bias in our estimates. The issue has been widely explored in both the theoretical and
empirical literature (Grossman and Helpman 1994) and scholars have recognized the potential
interference of industrial lobbies and interest groups in the delineation of trade policies.

We acknowledge that, for their intrinsic characteristics, trade policies will always show some degree
of endogeneity. However, this is not necessarily a concern in our study. Indeed, Jones et al. (2011)
analyse tariff reforms of four countries in Eastern Africa, including Ethiopia, between the early
1990s and early 2000s; they conclude that there was limited evidence of political distortions in the
tariff reduction process in these countries, mainly because the technocratic reforms were
implemented according to World Bank guidelines, leaving little room for lobbyist pressures. 16 As
in Jones et al. (2011), in Appendix Table A1 we report some descriptive statistics for output and
input tariffs throughout the period under study, to better understand the process behind the
Ethiopian tariffs reform. As expected, tariffs decreased on average by almost 10 percentage points,
but also their dispersion decreased, as signalled by a decreasing standard deviation. Moreover, we
can also see how both the kurtosis and the skewness approach zero over time, implying
respectively that the distribution gained more symmetry around the mean and lost weight in its
tails; that is, there were fewer extreme cases. Consistent with this trend, in Figure 6 we can see
how in Ethiopia the higher the tariffs around the baseline, the higher the reductions in targeted
sectors. Next, as in Topalova (2007), we regress tariffs against industrial characteristics to test
whether trade policy has been used to protect particular sectors. We did this by aggregating our
data at the three-digit sectoral level; results are reported in Table 2. Specifically, we regress the
change in tariffs (output tariffs Columns 1–3, input tariffs Columns 4–6) on sectoral employment
at the baseline (a large sectoral workforce might translate into a large electoral basis if protected)
and on the share of illiterate workers (as a proxy for unskilled workers, likely to be the most
vulnerable to trade liberalization). The only significant relationship appears to be the one with
initial levels of tariffs, suggesting that tariff reductions were faster for those sectors that were more
protected at the baseline. This should imply, cautiously, that tariff rate reductions are part of a
generalized trend towards liberalization.

16
 This was also the case for many other developing countries in the 1990s as well, such as Colombia’s tariff reduction
for WTO accession (Goldberg and Pavcnik 2007a, b) or Brazil’s liberalization for the Mercosur (Dix-Carneiro and
Kovak 2017).

 10
Figure 6: Changes in output and input tariffs (%) compared with the baseline

Source: authors’ elaboration on WITS data and IFPRI SAM (World Bank 2021; Tebekew et al. 2009).

Table 2: Tariff declines and baseline industrial characteristics

 (1) (2) (3) (4) (5) (6)
 Δ Output Δ Output Δ Output Δ Input Δ Input Δ Input
 tariffs tariffs tariffs tariffs tariffs tariffs
Employment −7.970 −5.889
 (6.538) (4.245)
Share of illiterate −0.151 0.198
workers
 (0.872) (0.174)
Baseline tariffs −0.192*** −0.144***
 (0.018) (0.017)
Observations 133 124 195 336 309 330
R-squared 0.011 0.000 0.366 0.006 0.004 0.186

Note: *p
of urbanization movements, the share of illiterate people, to capture human capital accumulation,
and the average age of the population. We also add year fixed effects ( ), to control for common
shocks affecting all districts and, especially, district-level fixed effects ( ), to control for potential
time-invariant district-specific unobserved factors. 17 Standard errors are clustered at the district
level, to account for potential autocorrelation within districts over time. Although changes in the
two tariff variables are correlated, this should not affect our estimates. Their partial correlation,
once all covariates are controlled for, amounts to around 0.15. To be sure that our identification
assumption is robust, we test our results through alternative specifications, in first difference and
using the volume of imports as the main explanatory variable, whose results are reported in Section
4.2.

4 Results

4.1 Main results

Table 3 shows the main results of our baseline specification. In Column 1 we regress the district
levels of employment against the district exposure to a reduction in output tariffs, plus the above-
mentioned set of covariates, district and year fixed effects; what we observe is a detrimental impact
of the reduction in output tariffs on the general level of employment in the Ethiopian districts. In
Column 2, we isolate the effects of an exposure to a reduction in input tariffs, which turns out to
be negligible. Note, however, that if we control for both effects simultaneously, as in Column 3,
we can see that the negative effect of a reduction in output tariffs remains (and slightly increases
in magnitude), whereas the coefficient of the input tariffs becomes negative and significant,
suggesting that in the specification of Column 2 there could be some omitted variable bias. Overall,
for the average district, a 1-point reduction in output tariffs is associated with a 2.1 percentage
point decrease in employment, but at the same time is also associated with a 0.2 percentage point
increase in employment, due to an equivalent reduction on input prices. However, if we consider
that, on average, the drop in output tariffs (1.097) is about three times larger than the one of input
tariffs (0.389), there will be a net reduction of employment due to trade liberalization. Therefore,
the first takeaway message is that in Ethiopia trade liberalization, proxied by a reduction in output
tariffs, has not resulted in pro-competitive effects but rather it seems to have had disruptive effects
on employment; at the same time, the possibility of using cheaper inputs had (even though smaller)
positive effects on district employment.

The robustness of this first finding is tested in two ways: first, switching specification to a first-
difference approach [used in a similar context, for instance, by Kis-Katos et al. (2018) and Lepelle
and Edwards (2020)]; second, changing the definition of the explanatory variable, from (output)
tariffs to the volume of imports. We run the same analysis of the baseline, but employing a first-
difference specification, where changes in employment rates are related to changes in tariff
measures, and report the results in Column 1 of Appendix Table A2. As in the baseline, we include
the same set of control variables. The direction and significance of our estimates do not change,
despite the fact that the sample is smaller. In Column 2 of Appendix Table A2 we use import

17
 To control for district-specific unobserved factors, we could use a fixed-effect or random-effect specification.
However, the random-effect model requires that the omitted variables are uncorrelated with the other covariates,
which seem unrealistic in our case. In any case, to check the validity of our specification, we perform the post-
estimation Hausman test.

 12
values instead of (output) tariffs. 18 The coefficient is negative, and therefore the result is consistent
with the previous, showing that an increase in imports leads to a decrease in general employment.
Table 3: Baseline results

Variables OLS OLS OLS
 Employed Employed Employed
Output tariffs 0.022*** — 0.027***
 (0.003) (0.004)
Input tariffs — 0.001 −0.003***
 (0.001) (0.001)
Urban −0.115*** −0.126*** −0.115***
 (0.035) (0.036) (0.035)
Age 0.003 0.003 0.004
 (0.003) (0.003) (0.003)
Illiterate 0.134*** 0.148*** 0.118***
 (0.041) (0.042) (0.042)
Constant 0.457*** 0.560*** 0.488***
 (0.093) (0.095) (0.092)
Mean of dependent variable 0.78 0.78 0.78
Observations 1,285 1,285 1,285
R-squared 0.429 0.405 0.433
Number of districts 388 388 388
District fixed effects Yes Yes Yes
Year fixed effects Yes Yes Yes
Cluster SE Yes Yes Yes

Note: OLS, ordinary least square; SE, standard error. *p
reduction in female employment. At the same time, the same reduction in input tariffs has no
effect on male employment but increases female employment by a 0.5 percentage point. Overall,
it seems that trade liberalization, besides having a negative impact on the general employment
level, also widens the gender employment gap, penalizing women more than men; the negative
effect of output tariffs seems to be not totally compensated by the positive effect that input tariff
liberalization has on women. Also in this case, results are robust to the specification in first
differences (Columns 1 and 2 in Appendix Table A3).
Table 4: Differences across gender

Variables OLS OLS
 Employed male Employed female
Output tariffs 0.012*** 0.042***
 (0.003) (0.005)
Input tariffs 0.001 −0.007***
 (0.001) (0.002)
Constant 0.625*** 0.325**
 (0.083) (0.136)
Mean of dependent variable 0.87 0.69
Observations 1,285 1,285
R-squared 0.380 0.366
Controls Yes Yes
Number of districts 388 388
District fixed effects Yes Yes
Year fixed effects Yes Yes
Cluster SE Yes Yes

Note: OLS, ordinary least square; SE, standard error. *p
explore the relationship between the reduction in the output and input tariffs and employment
shares in the three sectors. 19

Figure 7 plots the coefficients of interest and the full set of results is reported in Appendix Table
A4. There is a significant job disruption effect of tariffs in the agricultural sector. This dynamic is
mainly driven by the input tariff reduction, whereas the coefficient for output tariffs is not
significantly different from zero (green bars, 1 and 4). In the manufacturing sector instead, a
reduction in output tariffs is associated with an increase in the general employment level, whereas
input tariffs do not seem to play any role in the overall story. The negative coefficients (3 and 6)
suggest instead that tariff liberalization induced significant worker reallocation towards the tertiary
sector [a result in line, for instance, with what happened during the Brazilian trade reforms in the
1990s, as shown by Menezes-Filho and Muendler (2011) and Gaddis and Pieters (2017)]. Again,
this is mainly driven by lower input tariffs. However, looking at the means of the dependent
variables, the employment gains in the tertiary sector cannot make up for the overall losses in the
primary sector, which is in line with the generalized trade-induced job losses found in the previous
sections.
Figure 7: Reallocation across sectors

Source: authors’ elaboration on the census, NLF, and WITS data (Minnesota Population Center 2015; CSA 1994,
2004, 2006, 2014; World Bank 2021).

19
 Note that here the shares of workers in agriculture, manufacturing, and services are expressed as the number of
employed persons in each sector over the total number of employed people in working age (15–64 years) in each
district. In this way, by keeping the denominator fixed and equal to the total employment level, we can see the
reallocation of the employed across sectors due to tariff liberalization.

 15
We perform the same analysis disaggregated by gender and the results are reported in Appendix
Table A5. As we can see, the dynamics from the primary to the tertiary sector seems to be more
pronounced for female employment than for male employment. Next, we try to disentangle the
effect of the reduction in tariffs by creating two different indices, one covering only tariffs of the
agricultural sector and the other confined to the manufacturing sector. We then replicate the same
analysis. Results almost identically replicate those obtained when using tariffs of agricultural sector
(Appendix Table A6). This is not surprising given the importance of the primary sector in terms
of employment in most areas of the country. On the other hand, we observe limited implications
due to the drop in manufacturing tariffs (Appendix Table A7), whose effects are mostly found on
within-sector changes in employment. Specifically, an increase in competition (proxied by a
reduction in output tariffs) contributes to a reduction of (female) employment in the
manufacturing sector, whereas a decrease in input tariffs (cheaper inputs) raises it.

Therefore, an additional takeaway message from our study is that trade liberalization in Ethiopia
has contributed to some forms of structural transformation, following a pattern of structural
transformation without industrialization that seems nowadays typical of laggard economies in the
continent (Rodrik 2016). We show that for Ethiopia this phenomenon has involved mostly
women. However, similar to Lepelle and Edwards (2020), the decline in employment in the
liberalized sector (agriculture in our case, manufacturing in theirs) has not been compensated by
an even increase in services.

5.2 Sectoral segregation

The fact that female workers leave the primary sector following trade liberalization can be
correlated with what has been found by other studies (discussed in Section 1, in particular Gaddis
and Pieters 2017). Indeed, women might be more vulnerable to an increase in imports, given that
they are more likely to be engaged in less-productive substance farming (O’Sullivan et al. 2014).
Moreover, the country has an estimated 29.5 per cent gender gap in agricultural productivity
because female managers use fewer inputs than their male counterparts (WB and WTO 2020). In
recent years, the country has experienced a higher adoption of modern inputs in agriculture
(together with an increase in urbanization, in the road infrastructure, and in the communication
infrastructure; see Minten et al. 2014), which might have contributed to push the least productive
workers, among which women are the majority, out of the primary sector. Unfortunately, as we
do not have information on productivity nor on the nature of the specific inputs used in each and
every productive activity, we cannot test this mechanism.

As we find that output tariffs deteriorate women’s employment, changes in discrimination are
unlikely to be driving our results. Another channel through which trade liberalization might affect
female and male workers differently is sectoral segregation. If particularly stringent social norms
are in place, it may be that the structural transformation induced by trade liberalization would take
place with differences between gender, resulting in an increase in sectoral segregation between
men and women. Naturally, as argued by Wang et al. (2020), the opposite (i.e. a de-segregation)
might happen too. Indeed, it is also plausible that an increasing exposure to international markets
can shift social norms and lower the preference for a segregated labour market. To quantitatively
assess the role played by sectoral segregation, we construct the index of dissimilarity, first proposed
by Duncan and Duncan (1955) and then adopted in some related works (Borrowman and Klasen
2020; Kis-Katos et al. 2018; Wang et al. 2020):

 1
 , = � �� − ��
 2
 =1

 16
where and , respectively, measure the share of sector s for total male employment and

female employment at time t in district k. For the way it is constructed, an increase (reduction) in
the index value, that goes from 0 to 1, means that sectors become more (less) segregated by gender.
As shown in Table 5, a reduction in input tariffs is correlated with an increase in sectoral
segregation, meaning that the average distance in terms of sectoral presence between male and
female workers has increased following trade liberalization, a fact that is probably linked to the
gendered sectoral reallocation observed in the previous section. Our results contrast with those of
Kis-Katos et al. (2018) for Indonesia and Wang et al. (2020) for China, who find that lower input
tariffs went hand-in-hand with a reduction in sectoral segregation. However, they also find that,
overall, trade liberalization contributed to the feminization of the economy, increasing female
participation in the labour market, a result that does not seem to apply to the Ethiopian context
(possibly because of the low relevance of the manufacturing sector in Ethiopia compared with
China and Indonesia). Therefore, what our results seem to suggest is that the sectoral reallocation
that has taken place following trade liberalization pushed women out of the agricultural sector
towards the services sector. However, structural transformation has increased sectoral segregation,
increasing the gap in terms of female and male presence in each sector.
Table 5: Sectoral segregation

Variables (1)
 Segregation index
Output tariffs −0.004
 (0.005)
Input tariffs −0.003*
 (0.002)
Constant 0.345**
 (0.169)
Observations 1,285
Number of districts 388
R-squared 0.498
Year fixed effects Yes
Controls Yes
District fixed effects Yes
Cluster SE Yes

Note: SE, standard error. *p
First, we look at unemployment levels. 20 Although reported unemployment in Ethiopia is
extremely low throughout the period covered by our study (around 2 per cent for all four waves),
we can see how an increase in market competition due to lower output tariffs is associated with a
small but significant increase in the general unemployment level (Appendix Table A8, Column 1),
a result that turns out to be mainly driven by male unemployment.

Second, we look at the average years of education within districts over time. We find that a
reduction of output tariffs has no effect on a district’s average education level, whereas more
exposed districts experienced a reduction in women’s educational uptakes as a consequence of a
reduction in input prices (Appendix Table A9). 21 This result, read together with our finding that
input tariff reduction led to a small but significant increase of female employment, might tell us a
peculiar story: a reduction in input prices, through the adoption of cheaper labour-saving inputs,
might have freed up (female) workers from the agricultural sector in more exposed districts and
reallocated them to the services sector. However, this has not provided incentives for women to
invest more in education. A potential explanation for that might be that the relocation to the
services sector has predominantly taken place towards low-skilled and low-paying sectors. 22

To test this hypothesis, we analyse which of the service sectors grew the most following trade
liberalization. 23 In line with what we expected, the major shifts following a decrease in input tariffs
were for female workers, and towards those sectors that can be reasonably assumed to be low-
skilled (Appendix Tables A10 and A11). This includes, for instance, ‘Community services’ (division
O), and ‘Private household activities’ (division P). 24 Reductions in input tariffs are associated also
with an increase in male employment within those sectors, even though of a smaller size. At the
same time, we see no significant effects of trade liberalization for men or women in high-skilled
market services (e.g. ‘Finance and real estate’, divisions J–K). Finally, we find some evidence of an
increase in the employment in ‘Public administration services’ (division L) for both men and
women following a reduction in output tariffs.

20
 We define as unemployed people aged 15–64 years who are not in employment but carry out activities to seek
employment.
21
 Also, Edmonds et al. (2010) find that in rural India schooling improvements were attenuated in districts with
employment concentrated in industries losing tariff protection, and that was particularly true for girls, even though
they point to the poverty–schooling costs relationship as a potential mechanism. We of course do not exclude it, but
we have insufficient data to test it.
22
 This role played by trade-induced structural change (or, as in our case, by sectoral reallocation), in determining
returns to education that, in turn, determine educational attainment, has been investigated for instance also by Foster
and Rosenzweig (1996).
23
 We categorize services following the ISIC 3.1 classification that divides sectors into divisions. The divisions we use
are: E–F (Electricity and construction), G (Wholesale and retail), H (Hotels and restaurants), I (Transports), J–K
(Finance and real estate), L (Public admin.), M–N (Health and education), O (Community services), and P (Private
household activities).
24
 The subsectors included in divisions O and P are: Sewage and refuse disposal, Activities of membership
organizations, Recreational, cultural and sporting activities, and Other service activities in division O, and Activities
of private households as employers of domestic staff, Undifferentiated goods-producing activities of private
households for own use, and Undifferentiated service-producing activities of private households for own use in
division P.

 18
6 Conclusions

This paper shows that districts in Ethiopia that were more exposed to import tariff reductions
experienced a stronger reduction in employment levels compared with districts less exposed to
international competition. This result is robust to several specifications. The direction of the results
is consistent with existing literature (e.g., Dix-Carneiro and Kovak 2017; Topalova 2007). From a
gender perspective, we find that tariff reforms have a more detrimental effect on female
employment than on male employment. We show also that trade liberalization seems to affect the
distribution of employment out of the agricultural sector and towards services, again with more
marked effects for female workers. Women are in fact those that exit faster from the primary
sector and enter into the services sector following a reduction in input tariffs, although this process
was not accompanied by a reduction of sectoral segregation affecting women’s employment.
Moreover, we see that lower input tariffs, although facilitating the migration to the services sector,
discourage women from increasing their educational attainment and push them to move into low
value-added sectors such as private household activities.

References

Amiti, M., and J. Konings (2007). ‘Trade Liberalization, Intermediate Inputs, and Productivity: Evidence
 from Indonesia’. American Economic Review, 97(5): 1611–38. https://doi.org/10.1257/aer.97.5.1611
Attanasio, O., P.K. Goldberg, and N. Pavcnik (2004). ‘Trade Reforms and Wage Inequality in Colombia’.
 Journal of Development Economics, 74(2): 331–66. https://doi.org/10.1016/j.jdeveco.2003.07.001
Autor, B.D.H., D. Dorn, and G.H. Hanson (2016). ‘The China Syndrome: Local Labor Market Effects of
 Import Competition in the United States’. The American Economic Review, 103(6): 2121–68.
 https://doi.org/10.1257/aer.103.6.2121
Becker, G.S. (1957). The Economics of Discrimination. Chicago, IL: University of Chicago Press.
Ben Yahmed, S., and P. Bombarda (2020). ‘Gender, Informal Employment and Trade Liberalization in
 Mexico’. World Bank Economic Review, 34(2): 259–83. https://doi.org/10.1093/wber/lhy020
Bigsten, A., M. Gebreeyesus, and M. Söderbom (2016). ‘Tariffs and Firm Performance in Ethiopia’. Journal
 of Development Studies, 52(7): 986–1001. https://doi.org/10.1080/00220388.2016.1139691
Black, S., and E. Brainerd (2004). ‘Import Equality? The Impact of Globalization on Gender
 Discrimination’. ILR Review, 57(4): 540–59. https://doi.org/10.1177/001979390405700404
Borrowman, M., and S. Klasen (2020). ‘Drivers of Gendered Sectoral and Occupational Segregation in
 Developing Countries’. Feminist Economics, 26(2): 62–94.
 https://doi.org/10.1080/13545701.2019.1649708
Cirera, X., D. Willenbockel, and R.W.D. Lakshman (2014). ‘Evidence on the Impact of Tariff Reductions
 on Employment in Developing Countries: A Systematic Review’. Journal of Economic Surveys, 28(3): 449–
 71. https://doi.org/10.1111/joes.12029
CSA (1994). Ethiopia: Population and Housing Census 1994. Addis Ababa: Central Statistics Agency (CSA).
 Available at: https://www.statsethiopia.gov.et/census-1994/ (accessed February 2021).
CSA (2004). ‘Analytical Report of the National Labour Force Survey’. Statistical Bulletin of the Central Statistical
 Authority. Addis Ababa: Central Statistics Agency (CSA). Available at:
 https://catalog.ihsn.org//catalog/156/download/29150 (accessed February 2021).
CSA (2006). ‘Analytical Report of the National Labour Force Survey’. Statistical Bulletin of the Central Statistical
 Authority. Addis Ababa: Central Statistics Agency (CSA). Available at:
 https://catalog.ihsn.org//catalog/3753/download/52232 (accessed February 2021).

 19
CSA (2014). ‘Analytical Report of the National Labour Force Survey’. Statistical Bulletin of the Central Statistical
 Authority. Addis Ababa: Central Statistics Agency (CSA). Available at:
 https://www.ilo.org/public/libdoc//igo/P/392984/392984(2013)480.pdf (accessed February
 2021).
Diao, X., M. Ellis, M. McMillan, and D. Rodrik (2021). ‘Africa’s Manufacturing Puzzle: Evidence from
 Tanzanian and Ethiopian Firms’. NBER Working Paper Series 28344. Cambridge, MA: National
 Bureau of Economic Research (NBER). https://doi.org/10.3386/w28344
Dix-Carneiro, B.R., and B.K. Kovak (2017). ‘Trade Liberalization and Regional Dynamics’. The American
 Economic Review, 107(10): 2908–46. https://doi.org/10.1257/aer.20161214
Duncan, D., and B. Duncan (1955). ‘A Methodological Analysis of Segregation Indexes’. American Sociological
 Review, 20(2): 210–17. https://doi.org/10.2307/2088328
Easterly, W. (2003). ‘IMF and World Bank Structural Adjustment Programs and Poverty’. In M.P. Dooley
 and J.A. Frankel (eds), Managing Currency Crises in Emerging Markets (pp. 361–92). Chicago, IL:
 University of Chicago Press. https://doi.org/10.7208/chicago/9780226155425.003.0012
Ederington, J., J. Minier, and K.R. Troske (2009). ‘Where the Girls Are: Trade and Labor Market
 Segregation in Colombia’. IZA Discussion Paper 4131. Bonn: Institute of Labor Economics (IZA).
 Available at: https://www.iza.org/publications/dp/4131/where-the-girls-are-trade-and-labor-
 market-segregation-in-colombia (accessed February 2021).
Edmonds, E.V., N. Pavcnik, and P. Topalova (2010). ‘Trade Adjustment and Human Capital Investments:
 Evidence from Indian Tariff Reform’. American Economic Journal: Applied Economics, 2(4): 42–75.
 https://doi.org/10.1257/app.2.4.42
Edwards, L. (2004). ‘A Firm Level Analysis of Trade, Technology and Employment in South Africa”. Journal
 of International Development, 16(1): 45–61. https://doi.org/10.1002/jid.1062
Erten, B., J. Leight, and F. Tregenna (2019). ‘Trade Liberalization and Local Labor Market Adjustment in
 South Africa’. Journal of International Economics, 118: 448–67.
 https://doi.org/10.1016/j.jinteco.2019.02.006
Essers, D., K. Megersa, and M. Sanfilippo (2021). ‘The Productivity Gaps of Female-Owned Firms:
 Evidence from Ethiopian Census Data’. Economic Development and Cultural Change, 69(2): 645–83.
 https://doi.org/10.1086/703101
Fajgelbaum, P., and S. Redding (2014). ‘External Integration, Structural Transformation and Economics
 Development: Evidence from Argentina 1870–1914’. NBER Working Paper Series 20217.
 Cambridge, MA: National Bureau of Economic Research (NBER). https://doi.org/10.1086/703101
Feliciano, Z.M. (2001). ‘Workers and Trade Liberalization: The Impact of Trade Reforms in Mexico on
 Wages and Employment’. Industrial and Labor Relations Review, 55(1): 95–115.
 https://doi.org/10.1177/001979390105500106
Fiorini, M., and M. Sanfilippo (2019). ‘Roads and Jobs in Ethiopia’. WIDER Working Paper 116/2019.
 Helsinki: UNU-WIDER. https://doi.org/10.35188/UNU-WIDER/2019/752-1
Foster, A., and M. Rosenzweig (1996). ‘Technical Change and Human-Capital Returns and Investments:
 Evidence from the Green Revolution’. The American Economic Review, 86(4): 931–53.
Gaddis, I., and J. Pieters (2017). ‘Trade Liberalization and Female Labor Force Participation: Evidence
 from Brazil’. Journal of Human Resources, 52(2): 457–90. https://doi.org/10.3368/jhr.52.2.1014-6690R1
Gebreeyesus, M. (2016). ‘Industrial Policy and Development in Ethiopia’. Manufacturing Transformation, 6:
 27–49. https://doi.org/10.1093/acprof:oso/9780198776987.003.0002
Goldberg, P.K., A.K. Khandelwal, N. Pavcnik, and P. Topalova (2010). ‘Imported Intermediate Inputs and
 Domestic Product Growth: Evidence from India’. Quarterly Journal of Economics, 125(4): 1727–67.
 https://doi.org/10.1162/qjec.2010.125.4.1727

 20
You can also read