Transboundary Air Pollution in the Jakarta, Banten, and West Java provinces
←
→
Page content transcription
If your browser does not render page correctly, please read the page content below
Transboundary Air Pollution
in the Jakarta, Banten, and
West Java provinces
 Lauri Myllyvirta, Lead Analyst
 Isabella Suarez, Analyst
 Erika Uusivuori, Researcher
 Hubert Thieriot, Data Lead

 August 2020

                                             CREA is an independent research organisation
                                             focused on revealing
                                             the trends, causes, and health impacts,
                                             as well as the solutions to air pollution.

Photo credits: Ulet Ifansasti / Greenpeace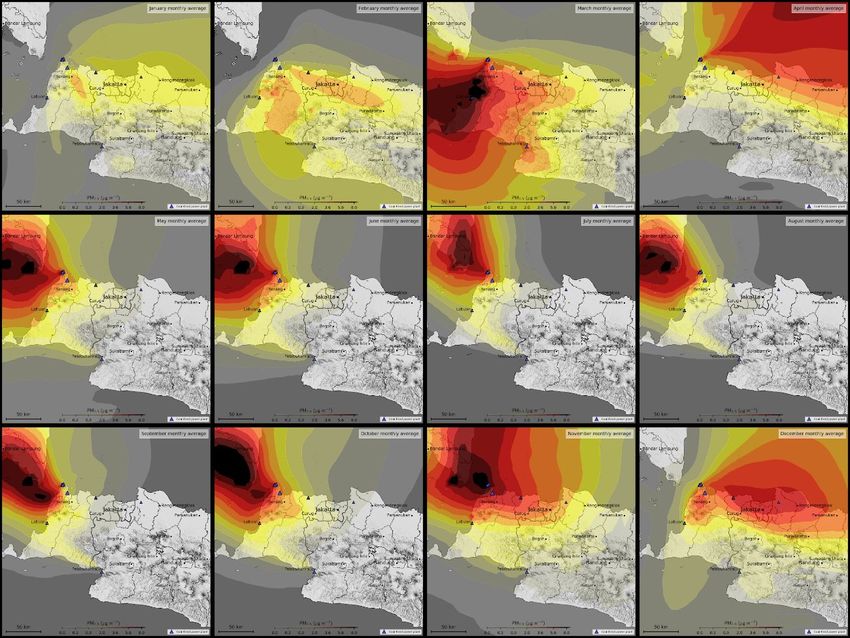
T a b da A P he
Ja a a Ba e a d We Ja a
ce
Key messages
Transboundary pollution in the surrounding provinces of Banten and West Java are major
contributors to air pollution in Jakarta City Jakarta s airshed the area where emissions
affect its air quality extends far beyond its borders regularly including Tangerang Bogor
Depok Bekasi Puncak and Cianjur and even extending as far as Sumatera Selatan
Lampung and Central Java See
Air pollutant emissions both in Jakarta and in surrounding provinces have been increasing
worsening Jakarta s air quality and hampering clean air efforts See PM2 5
monitoring in Jakarta recorded 101 days with unhealthy air quality in 201 and 172 in
201 Even with COVID 1 air quality in the city did not significantly improve See
Satellite images show that the Suralaya power plants in Banten were operating and emitting
as usual during COVID restrictions Winds brought their pollution into Jakarta which may
have contributed to Jakarta s PM2 5 remaining high despite major reductions in local traffic
and urban activity
Meteorological factors like wind trajectories affect the dispersion of pollutants like NO SO2
and PM2 5 In the dry months of May to October when overall pollution levels in the city are
highest sources from coal fired power and industrial plants to the east of Jakarta from
Bekasi Karawang Purwakarta all the way to Bandung have more impact on air quality In
the wet months December to March sources to the west specifically the Banten Suralaya
power plants are larger contributors See
There are 136 registered industrial facilities including power plants in highly emitting
sectors in Jakarta and within a 100km radius of the city borders 16 are located in DKI
Jakarta 62 in West Java 56 in Banten one in Central Java and the last in Sumatera Selatan
See Clusters of these industrial facilities coincide with the NOx and SO2 hotspots of
Java NOx and SO2 oxidize in the atmosphere to form large amounts of secondary PM2 5
which can be carried on winds to surrounding areas more than 100km away See
Atmospheric modeling of the worst pollution days in Jakarta shows wind trajectories
passing through these NOx and SO2 hotspots in Banten and West Java contributing to all
three types of air pollution in the city See
Emissions inventories for Banten West Java and Jakarta show that Banten and West Java
have much higher double or even quadruple emissions of PM2 5 SO2 and NOx than
Jakarta in large part due to industries and power plants See
Transboundary pollution is imposing major health and economic costs on Jakartans
Coal fired power plants CFPPs within 100km of the city are responsible for an estimated
2 500 premature deaths in the Jabodetabek area Transboundary pollution is also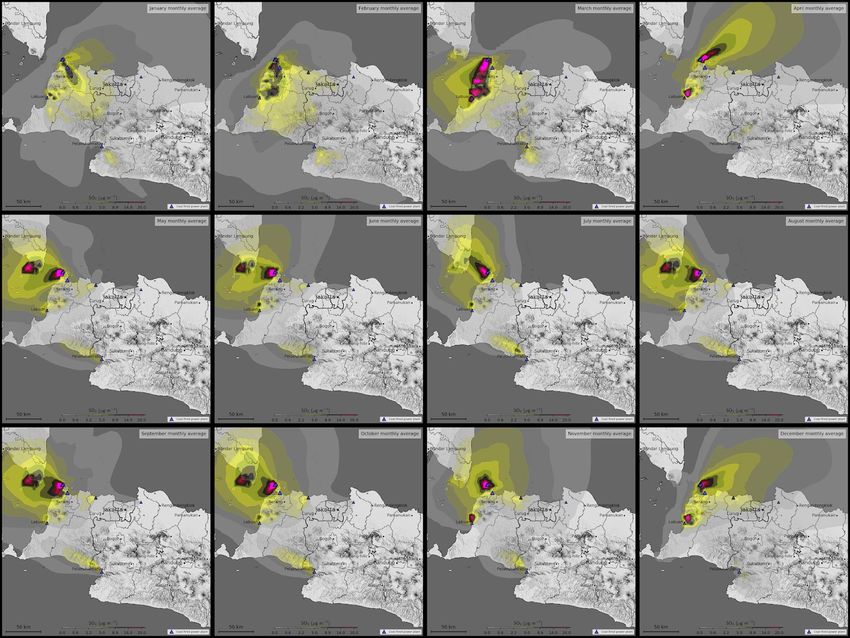
responsible for other negative health impacts related to immunity respiratory and
cardiovascular systems The annual cost of transboundary pollution from CFPPs is
estimated at IDR 5 1 trillion per year in Jabodetabek or IDR 1 0 000 per person per year
See
Policies and frameworks to limit emissions from these sources have been insufficient These
must be strengthened and implemented to protect the health and wellbeing of Indonesia s
citizens See
1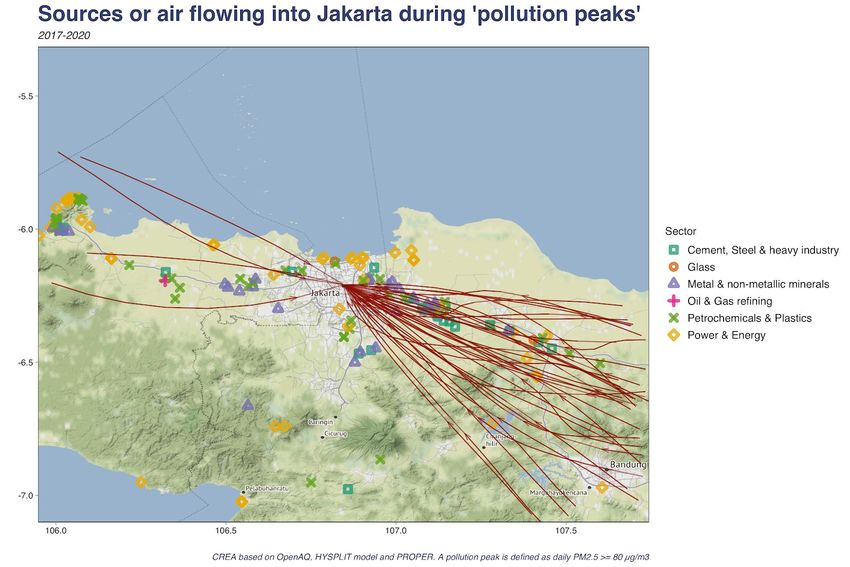
Ab CREA
The Centre for Research on Energy and Clean Air CREA is a new independent research
organisation focused on revealing the trends causes and health impacts as well as the solutions
to air pollution CREA uses scientific data research and evidence to support the efforts of
governments companies and campaigning organizations worldwide in their efforts to move
towards clean energy and clean air believing that effective research and communication are the
key to successful policies investment decisions and advocacy efforts CREA was founded in
December 201 in Helsinki and has staff in several Asian and European countries
This report was prepared at the request of Earthjustice and the Indonesian Centre for
Environmental Law ICEL and is the cumulative work of the following
Writers
Isabella Suarez
Lauri Myllyvirta
Erika Uusivuori
Modeling
Lauri Myllyvirta
Hubert Thieriot
Andreas Anhäuser
Photo Credits on cover: Ulet Ifansasti Greenpeace
MEDIA CONTACT
Isabella Suarez
Analyst Centre for Research on Energy and Clean Air
isabella energyandcleanair org
63 17 314 6663
2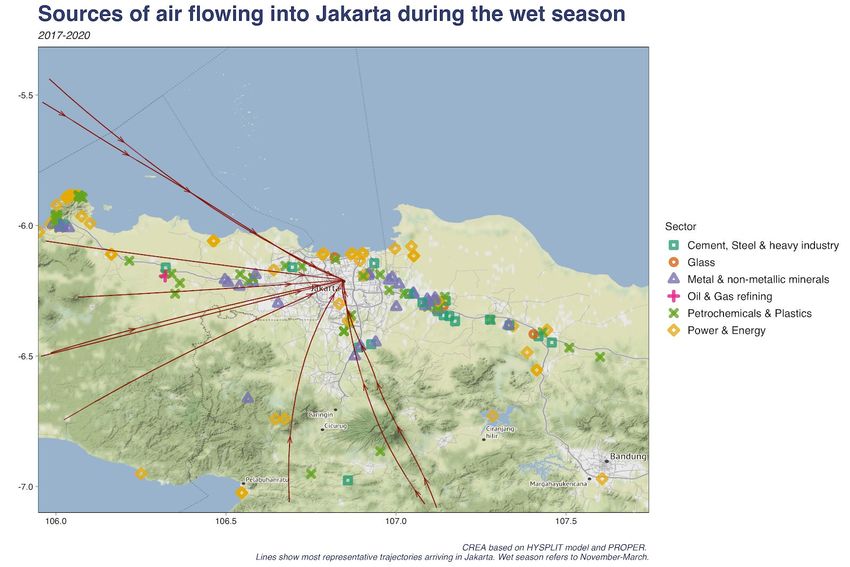
Contents
Key messages                                                                           0

Contents                                                                               3

Overview                                                                               4
   State of Air Quality in Jakarta                                                        6
   Related Literature

Modeling transboundary pollution from the source                                      11
   Meteorology plays a role in the build up of air pollution                          11
   Power plants & industrial facilities in western Java                               14
   Concentration & Distribution range of pollutants                                   15
   Emission sources in the areas affecting Jakarta s air quality                      1

Estimated risk of air pollution without regulations on emissions                      21
   Emissions Standards for thermal power plants                                       22
   Economic & Health Costs of air pollution from surrounding coal plants on Jakarta   23

Recommendations                                                                       25

References                                                                            26

Appendix                                                                              28

                                                                                              3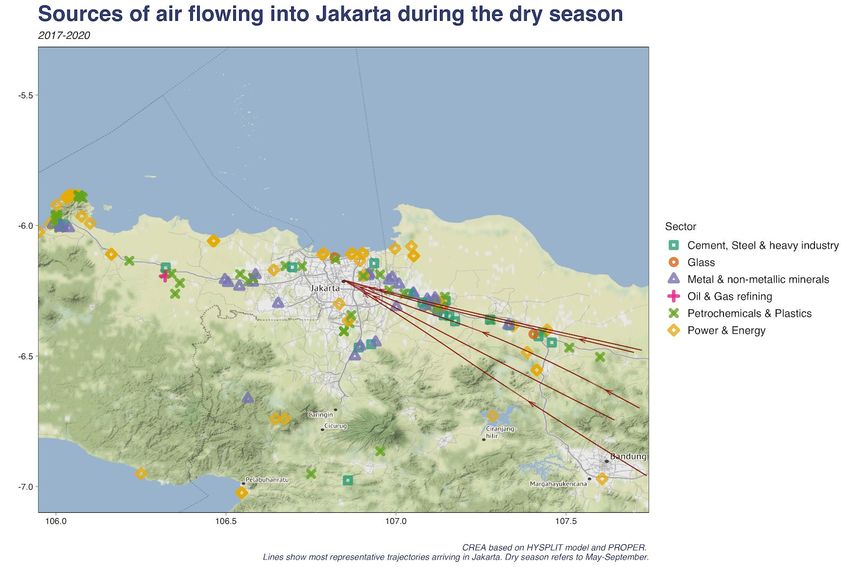
Overview
Air pollution is a serious problem in Jakarta Rapid industrialization and urbanization has led to a
continuous rise in air pollution It has reached a point where air pollution exceeds the
recommended concentrations of the World Health Organization WHO Fig e three fold
resulting in worsening impacts on public health A 2010 study by Indonesia University found that
nearly 60 percent of Jakarta s residents suffer from respiratory illnesses associated with poor air
quality Haryanto 2017 Meanwhile the number of known emitters like coal fired power plants
transport vehicles and manufacturing facilities has increased The production and consumption of
coal oil and gas from these sources emit huge amounts of pollutants into the atmosphere which
impacts the air quality of surrounding areas for hundreds of kilometers downwind
Figure 1: Average PM2.5 levels in Jakarta, Indonesia1
While Indonesia has ambitious renewable energy targets the country is simultaneously increasing
its fossil fuel use UNEP 2015 Currently it has the most coal fired power plants CFPP in
Southeast Asia with a total of 74 Since 2010 electricity generation from such plants has more than
doubled Greenstone et al 201 Indonesia also has plans for additional 31 200 MW of coal
generation capacity 20 of which will be located within a 100 km radius of Jakarta and will have
air quality impacts equal to adding 10 million more cars to Jakarta Lowy Institute 201 2 Air
quality could become much worse if adequate safeguards are not in place A Harvard study found
1
The WHO recommends a 10 μg m3 annual mean for PM2 5 Annual PM2 5 has risen to four times what the
WHO recommends and considers healthy
2
This includes plants whose status is under construction permitting or announced Global Coal Plant
Tracker 201
4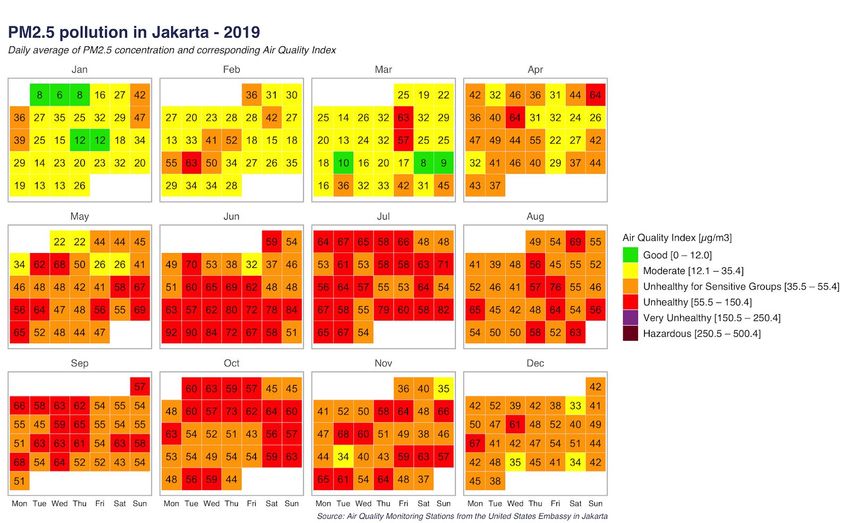
that those planned coal plants would cause an additional 2 600 people to die prematurely each
year Koplitz et al 2017

The regulations on emissions have remained lenient with limited enforcement of regulations for
industries In addition Indonesia s lax ambient outdoor air quality standards do not adequately
control the accumulation of pollution from all sources While the WHO says exposure to fine
particulate matter PM2 5 of more than 25 g m3 over a 24 hour period is already dangerous to
human health the National Ambient Air Quality Standard NAAQS has a limit of 65 g m3
The aim of this study is to examine transboundary emissions from industrial facilities and power
plants in western Java and their impacts to air quality and human health

Major Air Pollutants
Fossil fuel burning power and industrial plants produce emissions while operating and these
emissions contain toxic air pollutants Pollutants including but not limited to NOx SO2
particulate matter PM and mercury Hg spread in the atmosphere and cause harm to human
health including stroke heart disease asthma respiratory infections and chronic obstructive
pulmonary disease WHO 2016 Impaired health conditions lead to increased hospital visits and
premature death

Not only are pollutants emitted directly from the source but they also interact in the atmosphere
and create new pollutants NOx gases are emitted whenever fossil fuels are burned due to the very
high temperatures SEPA Similarly SO2 is formed during fuel combustion in power plants and
industrial facilities US EPA 201

PM2 5 emitted directly from sources primary such as vehicles heavy equipment forest fires
and other burning activities or formed in the atmosphere secondary can remain airborne for
long periods and travel hundreds of miles Secondary formation of PM2 5 and ozone occurs when
NOx reacts with other compounds in the atmosphere generally downwind and or some distance
from the original emission sources US EPA 2016 Short or long term exposure to the particles can
cause adverse cardiovascular effects Because PM2 5 can get deep into the lungs it has also been
linked to respiratory effects including the exacerbation of asthma and the impairment of lung
development

Mercury a neurotoxic heavy metal is another pollutant emitted from coal plants and that is easily
transported in the atmosphere It can even travel around the globe depositing in very remote
regions UN Environment 201 Mercury emissions from power plants lacking adequate air
pollution control devices such as those around Jakarta are readily deposited in the region around
the power plant creating mercury deposition hotspots3 see e g Sullivan et al 2006

3
 The equipment used to control SO2 wet flue gas desulfurization devices are effective at removing the
locally deposited divalent mercury from the flue gas

                                                                                                        5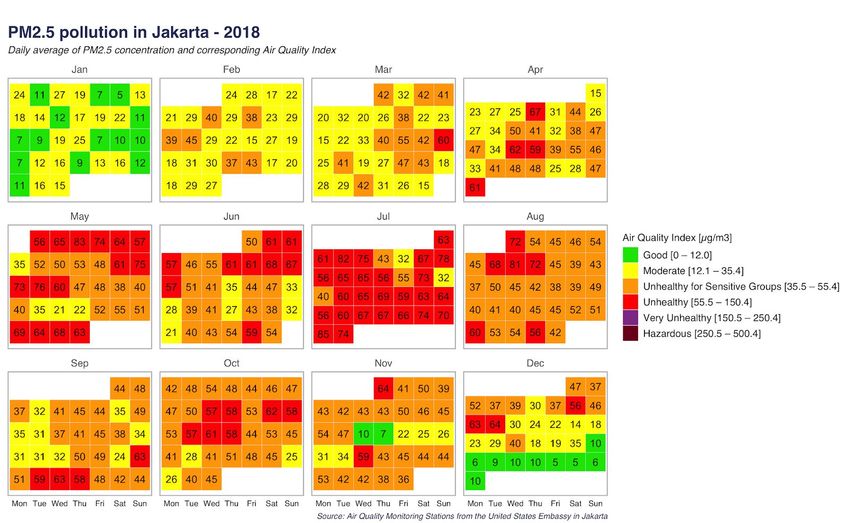
State of Air Quality in Jakarta
Air quality monitoring of PM2 5 by the US Embassy in Jakarta shows that the city only saw 40 days
of good air quality in 2017 mostly in the months of January November and December 201 had
only 25 good days in contrast to the 101 recorded days of air quality within a range considered
unhealthy In 201 the number of unhealthy days increased to 172 over 50 of the year Early
2020 monitoring shows that even with the disruption caused by COVID 1 air quality from March
to May remained within moderate to unhealthy levels See Fig e
The dry season May to October sees the most number of unhealthy air quality days The rainy
season November to March provides some respite but overall air quality in 201 and 201 show
that for most of the year PM2 5 are at levels that are unhealthy to sensitive groups and for the first
time in the past four years not a single day in 2020 has had good quality air
Figure 2: Daily average of PM2.5 concentrations in Jakarta from 2017 to 2020
6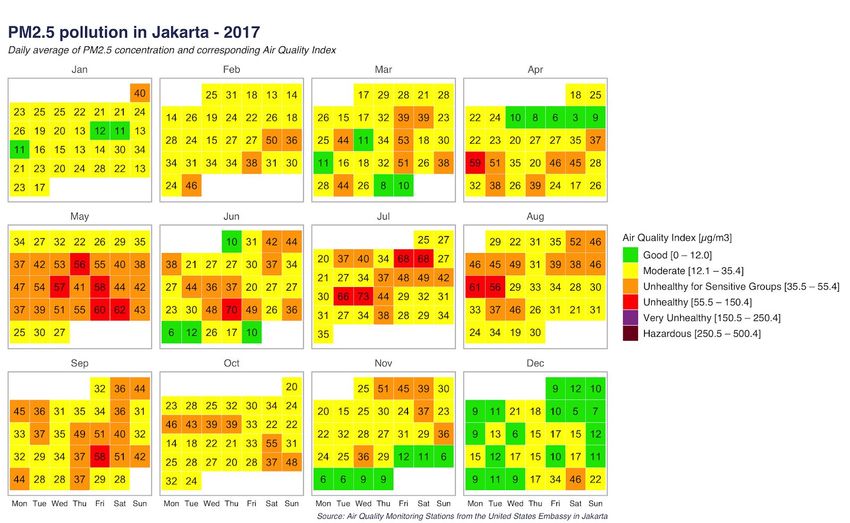
7
S ce Ai Q ali M i i gS a i f he U i ed S a e E ba i Jaka a In addition to PM2 5 satellite based imaging shows that Jakarta and parts of Banten and West Java are major ambient NO2 hotspots Fig e Over the past decade NO2 levels increased in Banten West Java and southern Lampung There was also a big increase in NO2 further away in Jepara due to coal expansion This indicates an increasing trend in fossil fuel use and emissions outside Jakarta which also means an increased transboundary impact on air quality in Jakarta NO2 levels are an indicator of increased fossil fuel emissions of both NOx and PM2 5 as the same emissions sources produce both types of emissions NOx emissions contribute to PM2 5 formation because some NOx is converted into PM2 5 particles nitrates before reaching the city This has contributed to the worsening measurements of ambient PM2 5 concentrations in Jakarta Fig e as secondary PM2 5 circulates with meteorological conditions resulting in their long range transfer Together with pollution from local sources this can result in episodes of higher pollution
Figure 3: NO2 Hotspots over Jakarta, Banten and West Java
SOURCE CREA ba ed TROPOMI Sa elli e da a
Related Literature
Regulations for industrial emissions have remained lenient although the country has implemented
stricter standards on other emission sources such as the transport sector Jakarta has faced
several situations where traffic has eased but air pollution has not significantly dropped leading to
the conclusion that controlling emissions from transportation is not enough
An in depth study on the effects of sea and land breezes shows how air pollutants are transferred
by these winds into Jakarta Sofyan et al 200 The results of the study indicate that before daily
land and sea breezes NO2 and SO2 concentrations are highest in the emission source areas in
central Jakarta and coastal industries Sea breeze increases the concentration of the pollutants in
the city by transporting them from the coast to southern Jakarta and into the mountainous area
beyond
CREA analyses on the impact of COVID 1 around the world found that unlike many other
countries the work from home and Pembatasan Sosial Berskala Besar PSBB in Indonesia did not
improve air quality despite a decrease in urban activity Atmospheric NO2 in Jakarta Banten and
West Java decreased in comparison to 201 levels due to a slowdown in emissions from major NO2
sources like transport and industry See A e di However PM2 5 concentrations in Jakarta
increased from late March to early June PM2 5 travels farther than NO2 and can pollute farther
away from its original source suggesting that transboundary pollution from outside the city was a
factor in the lack of change in PM2 5 TROPOMI Satellite images showed that the Suralaya powerplants in Banten were operating and emitting as usual Wind trajectories on April 12 2020 when
PM2 5 in Jakarta spiked showed that air was traveling in a north east direction passing across or
close to the Suralaya plants and carrying pollution to Jakarta preventing PM2 5 in the city from
dropping substantially
10Modeling transboundary pollution from the source
Meteorology plays a role in the build up of air pollution
Meteorological conditions in western Java are a factor in the transboundary movement of
pollutants Wind speed temperature humidity and rainfall can affect the concentration and
dispersion of air pollution away from its original source
We used the HYSPLIT model developed by the U S NOAA driven by weather data from 2017 to
2020 to generate the distinct patterns of air flow and wind trajectories for Indonesia s two seasons
Fig e HYSPLIT modeling is at a receptor height of 10 meters a level where pollution is
well mixed and thus transported and easily inhalable by humans The modeling shows that in
the seven months of the wet season November to May winds come from both northeast and
southeast directions bringing emissions from sources in South Sumatra Lampung Banten and
Bogor in West Java In the dry season June to October wind trajectories are more frequently
coming from West Java indicating that emissions sources in the east and southeast of Jakarta as
far away as Cirebon and Bandung have a greater impact on air quality in the dry season
Satellite based analysis shows that emissions in these provinces have been increasing over the
years which will have increased Jakarta s pollution as well as local pollution levels See A e di
Controlling these emissions sources is essential for improving air quality in the Jakarta region
11Figure 4: Most representative wind trajectories that reached Jakarta during the wet and dry
seasons 2017 2020
12To further illustrate that wind trajectories are a factor in transboundary pollution we modeled the
individual wind trajectories on some of the days with the worst air pollution readings in Jakarta
when PM2 5 was over 0 g m3 Fig e shows the wind trajectories that entered Jakarta during
these peak pollution days between 2017 and 2020 These winds brought in pollutants from
industries in Suralaya and Tangerang in Banten as well as from industries in West Java starting
from the cluster of facilities on the eastern border of Jakarta and extending to West Karawang
Purwakarta and Bandung
Figure 5: Wind trajectories flowing into Jakarta during pollution peaks 2017 2020
P e la a di d ial facili ie k f Jaka a
CREA ba ed HYSPLIT deli g a d PROPER
13Power plants & industrial facilities in western Java
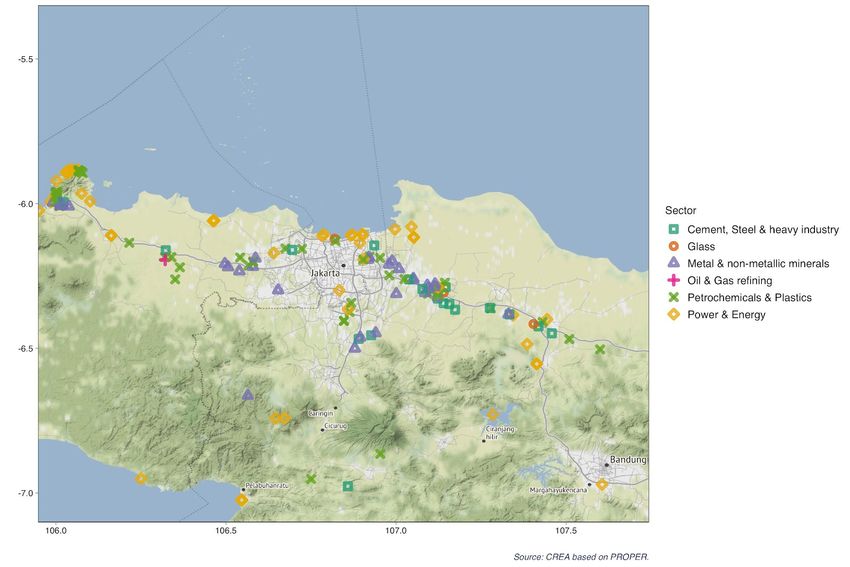
A tally of facilities from the 201 Program for Pollution Control Evaluation and Rating PROPER
shows that a total of 41 industrial facilities are found within a 100 km radius of the greater Jakarta
area Of these facilities 136 are in highly emitting sectors like cement and steel glass oil and gas
refining power and energy which includes CFPPs metals and petrochemicals and plastics
Fig e 6 percent of these highly emitting facilities operate outside of Jakarta s borders there
are 62 facilities in West Java 56 in Banten 1 in Central Java and 1 in Sumatera Selatan which fall
within 100 km of Jakarta
Figure 6: Distribution of power and industrial plants in Jakarta and within 100km of the city
The cluster of power plants and industries that run along northern Java are hotspots for SO2 and
NO2 emissions both indicators of fossil fuel pollution They also overlap with the areas where
industrial facilities are located efe b h Fig e a d Fig e
14Concentration & Distribution range of pollutants
To assess the contribution of large point sources to air pollution in Jakarta we carried out detailed
atmospheric modeling of pollutant dispersion from the coal fired power plants surrounding the
city We developed 3 dimensional meteorological data for every hour of the modeling year 2014
including wind speeds directions humidity temperature atmospheric stability and other relevant
variables using the TAPM meteorological model developed by Australia s national science agency
CSIRO We then used the CALPUFF dispersion model the most widely used long range model in
the world to simulate the pollution from the coal fired power plants The model tracks
ground level pollution dispersion chemical transformation and deposition in the atmosphere to
assess the impact of the modeled sources on air quality across the modeling area
TAPM CALPUFF modeling of surface concentrations of pollutants emitted from coal fired power
plants shows that large emissions sources up to 100km away from Jakarta have a significant
impact on the city s air quality Figure 7 shows examples of the worst case pollution dispersion in
Jakarta when air masses arrived in the city from the Suralaya industrial zone where five large
CFPPs are located PM2 5 pollutant concentration igh i Fig e caused by the coal plants
in this case is higher in DKI Jakarta than in Banten This is partly due to the transformation of large
SO2 and NOx emissions from coal plants in Banten where the two pollutants are most highly
concentrated ce e a d lef i age i Fig e into secondary PM2 5 downwind and closer
to Jakarta
Figure 7: NO2, SO2 and PM2.5 concentrations over Jakarta on the worst days of pollution
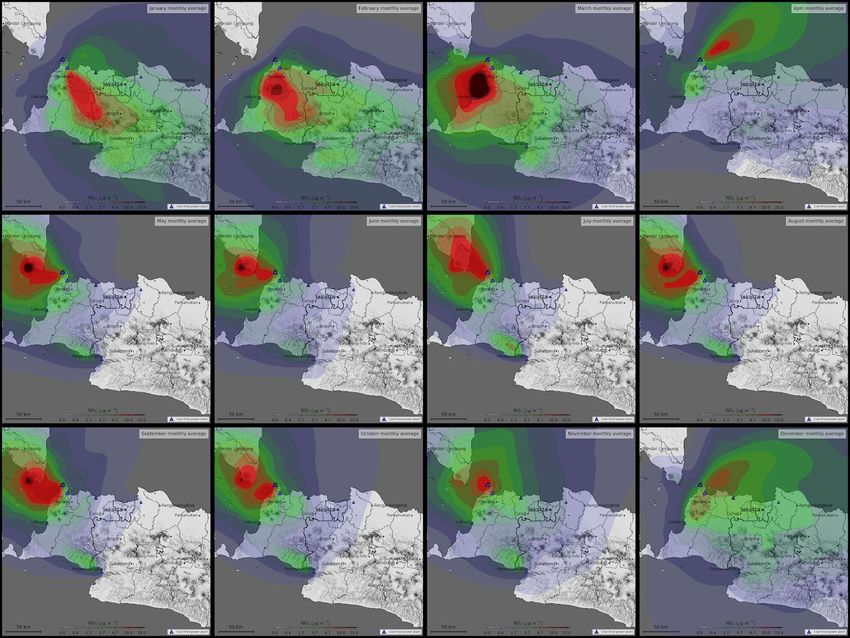
We also used TAPM CALPUFF to model emissions of the three pollutants from the six coal fired
power plants within 100km of Jakarta averaged for each month to demonstrate differences in the
dispersion and concentrations of pollutants Fig e The concentration of pollution in the
northernmost area of Banten where the Suralaya plants are located remains consistently high
and contributes to air pollution in Jakarta in all months with highest impacts from December
through April
15Figure 8: Monthly Average of NO2 concentrations from coal fired power plants
16Figure 9: Monthly Average of SO2 concentrations from coal fired power plants
17Figure 10: Monthly Average of PM2.5 concentrations from coal fired power plants
Emission sources in the areas affecting Jakarta s air quality
The figures above make it clear that Jakarta s airshed the area within which air is frequently
confined or channeled and thus the area where emissions affect Jakarta s air quality extends far
outside the city s borders to include Banten West Java Sumatera Selatan Lampung and Central
Java Because of their proximity the Kabupatens of Serang Tengerang Kota Cilegon and Kota
Tangerang in Banten as well as Kota Depok Kab Bekasi and Kab Karawang in West Java all fall
within the airshed and regularly contribute to transboundary pollution into Jakarta Many other
Kabupatens located more than 100km from Jakarta s border are also part of the airshed Fig e
but their contributions to transboundary pollution have not yet been analyzed in detail
This is in line with experiences in other countries and cities For example in New Delhi India air
quality measures target the National Capital Region which extends 300 km outside the city while
for Beijing and Shanghai in China the National Key Control Regions designated around these
cities extend up to 500 km away
Analysis of emissions in Java based on the EDGAR 5 0 emissions inventory for 2015 prepared by
the European Union Joint Research Committee shows that Central Java West Java and Banten
1each have much higher air pollutant emissions than the Greater Jakarta area e h d l g i he
A e di In terms of emitting sectors energy power plants industry road transport agriculture
and residential fuel use are all important sources of pollution The emissions inventory by province
and sector in Fig e show that the provinces of West Java Banten and Central Java have the
highest emissions among the provinces found within Jakarta s airshed higher than Jakarta itself
The extent to which each province contributes to transboundary air pollution in Jakarta has not
yet been analyzed
Figure 11: Air pollutant emissions around Jakarta by province 2015
Figure 12 is a combined emissions inventories of Jakarta West Java and Banten that shows the
amount of pollutants from each sector SO2 and NOx emissions from the energy and industrial
sectors are highest while primary PM 2 5 is more heavily emitted from agricultural burning and the
residential and commercial sectors It is important to note that these emission inventories do not
calculate how large amounts of SO2 and NOx in the atmosphere transform into secondary PM2 5
and ozone While industrial and energy sources of primary PM2 5 are small large amounts of
secondary PM2 5 can be very significant especially as wind trajectories carry them from one
province to another as shown in the sections above Thus it is important to address all sources of
pollution that may impact Jakarta particularly from the industry and energy sources in Banten
and West Java
1Figure 12: Air pollutant emissions by sector in Jakarta, West Java and Banten 2015
While EDGAR data shows how emissions by province and sector contribute to the regional airshed
it is not a replacement for local emissions inventories which provide specificity to the sources of
pollution and their contributions to a smaller geographic area Emissions inventories conducted at
a city level across the three provinces should be part of air quality management plans
20Estimated risk of air pollution without regulations
on emissions
According to Indonesia s National Energy Council the country has a projected 5 average annual
growth rate in national energy demand under a business as usual scenario where demand in 2050
is almost four times that of 201 Indonesia Energy Outlook 201 Despite plans to increase
renewable energy an increase in fossil fuel supply and consumption is expected in order to meet
projected demand in the energy transportation industrial and commercial sectors Unless
stronger standards and policies are introduced and enforced the already unhealthy air quality will
continue to worsen
There are 7600 megawatts MW of operating coal fired capacity within 100km of Jakarta s
borders with another 6000 MW in development This is more than any other national capital
airshed in the world and currently the highest stationary source of emissions Fig e In
addition the air pollutant emissions standards applied to these plants are very weak allowing
10 20 times more air pollution than the recommended standards e g in China the European
Union Japan or South Korea More than half of current capacity within 100 km of Jakarta is in the
Banten Suralaya power plant complex the most polluting industrial complex in all of Southeast
Asia based on satellite measurements NASA 2020
21Emissions Standards for thermal power plants
In 201 the MoEF issued new emission standards that substantially strengthened the limits for
new coal fired power plants but the ministry has stated that these new plant limits won t be
applied to the new projects coming up around Jakarta since they already have power purchase
agreements or permits In addition old plants can emit levels of NOx and SO2 of up to 550
milligrams per cubic metre mg Nm3 which are significantly higher than standards of most other
major coal consuming countries and not limiting enough to incentivize retrofitting of such plants
with effective pollution controls The enormous planned expansion of coal fired power generation
combined with the failure to require compliance with new plant emission limits is a distinct threat
to the air quality of Jakarta
F g e 13: C a fI d e a e a ga d e e a da d f
he a e a Ch a, I d a, a d he E ea U
22Economic & Health Costs of air pollution from surrounding coal
plants on Jakarta
The energy sector is the largest source of SO2 and NOx pollutant emissions in the provinces
surrounding Jakarta although not the only source Fig e a d ab e To illustrate the
importance of transboundary pollution we present a further analysis of the health and economic
impacts of this sector
Dangerous air pollution from power plants in Banten and West Java is made worse by weak
emissions standards severely impacting both the health of Jakartans and the city s economy
Coal fired power plants expose people to toxic particles some microscopic like PM2 5 ozone
from NOx and heavy metals like mercury In addition to the direct effects on human health
exposure to such particles indirectly impacts healthcare systems economic productivity and
social welfare With the COVID 1 pandemic such stresses on the country s systems will only
worsen New studies show links between long term exposure to poor air quality and vulnerability
to the virus CREA 2020 Harvard 2020
CREA modeled the health impacts of the coal power plants surrounding Jakarta following the
methodology of the Harvard study Burden of Disease from Rising Coal Fired Power Plant
Emissions in Southeast Asia updated to the current situation of operating coal fired power plants
This model does not include PLTU Jawa 7 Unit 1 which began operations in December 201 See
A e di f li f la i cl ded The air quality modeling was done with the CALMET CALPUFF
modeling system that allows higher local resolution than the original study We found that
transboundary air pollution from coal fired power plants alone is responsible for an estimated
2500 air pollution related deaths in Jabodetabek annually 4 This transboundary pollution is also
responsible for other negative health impacts including new cases of asthma asthma emergency
visits preterm births increased prevalence of disabilities related to stroke respiratory diseases
and diabetes as well as increased sick leaves
Table 1: Estimated health impact of transboundary air pollution from operating coal fired
power plants on Jabodetabek e cluding PLTU Jawa , using 2019 standards.
Health effects Operating 95 confidence
interval
PM2 5 Lower respiratory infections infants 40 10 0
deaths
Lung cancer 60 20 0
Other cardiovascular diseases 170 100 230
4
Jabodetabek includes the city of Jakarta and the surrounding regions of Tangerang Bogor Depok Bekasi
Puncak and Cianjur
23Ischemic heart disease 4 0 310 650
Stroke 550 340 760
Other respiratory diseases 60 40 0
Chronic obstructive pulmonary disease 0 50 110
PM2 5 Total 1430 70 2020
NO2 All causes 1020 5 0 21 0
deaths
Total premature deaths 2450 1260 3470
The economic costs of these health impacts on Jabodetabek were assessed following the
methodology of the CREA report Quantifying the Economic Costs of Air Pollution from Fossil
Fuels Currently transboundary pollution from coal power plants causes estimated annual costs
of IDR 5 1 trillion in Jabodetabek This is currently equivalent to IDR 1 0 000 per person per year in
the city
Table 2: Estimated economic cost of transboundary air pollution from operating coal fired
power plants on Jabodetabek e cluding PLTU Jawa , using 2019 emissions standards.
Outcome Number of cases Cost IDR billion
asthma emergency room visits 1 772 1 1 0 2 427 16 1 21
new cases of asthma in children 3 1 0 1 4 5 4 013 51 24 65
preterm births 71 416 746 264 153 275
work absence sick leave days 0 65 0 56 0 73 1 1 166 215
million
years lived with disability 616 7 67 11 275 1 040 30 121
years of life lost 24 53 1 432 34 55 3 52 2 606 4 27
total economic cost 5,076 3,781 6,703
24Recommendations
Air pollution is a manageable problem Prioritizing the necessary measures to protect Indonesian
citizens right to clean air will require the appropriate policies to regulate and monitor both
ambient air quality and pollution from major sources These policies must be accompanied by
enforcement mechanisms to hold large polluters accountable whilst protecting Indonesia s
environment and citizens Considerable efforts have been made to establish a national energy
plan which must be supported by reforms to the country s air quality management system This
should include
Revising the National Ambient Air Quality Standard to meet the WHO guidelines for
healthy air quality. This requires time bound targets to reduce pollutants like PM NOx
and SO2 at both the national and provincial level
○ To ensure accuracy of information about air quality and compliance with
environmental standards the government must also improve monitoring
networks both within Jakarta and in all major cities Monitoring stations should
measure for emissions in real time and data from these stations should be readily
available to the public The data should also be reported electronically across
different levels of government e g city province and central to prevent data
manipulation
Enforcing the updated 2019 emissions standards on all planned thermal power plants
Figure 13 including ones currently under construction to ensure that plants can still
be retrofitted to fit stricter and safer emissions standards.
○ To ensure compliance such facilities should also be responsible for installing
continuous emission monitoring systems CEMS for all major pollutants e g
PM2 5 PM10 SO2 NOx ozone and carbon monoxide This will also allow
regulators and monitoring bodies to track whether such standards are sufficiently
mitigating emissions
Updating the emissions standards for other polluting industries based on
industry specific Best Available Technology to minimize their environmental and
health impacts. Jakarta already has stricter controls on air pollution sources but as this
analysis shows emissions from sources outside of the city greatly affect Jakarta air quality
and public health Working with neighboring jurisdictions and the national government to
monitor and reduce pollution outside city borders will ensure that efforts in one
municipality are not undermined by lack of effective pollution reduction elsewhere
○ All power plants and industrial facilities in Jakarta s multi province airshed
contribute to pollution in Jakarta Given the cross province reach of stationary
source emissions in western Java the provinces of Jakarta Banten and West Java
should collaborate on setting emissions control targets This can begin with a
baseline emissions inventory analysis to analyze cumulative air pollution from
various sources across the region
25References
Crippa M Guizzardi D Muntean M Schaaf E Dentener F van Aardenne J A Monni S
Doering U Olivier J G J Pagliari V and Janssens Maenhout G 201 Gridded emissions of air
pollutants for the period 1 70 2012 within EDGAR v4 3 2 Earth Syst Sci Data 10 1 7 2013
https doi org 10 51 4 essd 10 1 7 201
Greenstone M & Fan Q 201 Indonesia s Worsening Air Quality and its Impact on Life
Expectancy Air Quality Life Index March 201 Report
https aqli epic uchicago edu wp content uploads 201 03 Indonesia Report pdf
Hamonangan E Kondo A Kaga A Inoue Y Soda S & Yamaguchi K 2002 Simulation and
Monitoring of Sulphur Dioxide Nitrogen Oxides in the Jakarta Metropolitan Area Asian J Energy
Environ 2002 3 3 4 15 1 3 http www thaiscience info journals Article AJEE 10262377 pdf
Haryanto B Impact of Climate Change on Air Quality in the Urban Landscape Research Center for
Climate Change University of Indonesia presentation at Marrakesh COP22 2016
https apruglobalhealth org wp content uploads 2017 01 Dr Budi Haryanto Impact of Climate
Change on Air Quality in the Urban Landscape pdf
Koplitz S N Jacob D J Sulprizio M P Myllyvirta L & Reid C 2017 Burden of Disease from
Rising Coal Fired Power Plant Emissions in Southeast Asia E i Sci Tech l 2017 51 3
1467 1476 https doi org 10 1021 acs est 6b03731
Lestari P Damayanti S & Arrohman M K 2020 Emission Inventory of Pollutants CO SO2 PM2 5
and NOx In Jakarta Indonesia IOP Conference Series Earth and Environmental Science 4
012014 https iopscience iop org article 10 10 1755 1315 4 1 012014
Lowy Institute 201 Jakarta s air quality kills its residents and it s getting worse The Interpreter
Kate Walton
www lowyinstitute org the interpreter jakarta s air quality kills its residents and it s getting wor
se
OECD 201 Indonesia s effort to phase out and rationalise its fossil fuel subsidies G20
Peer Review Prepared by the members of the peer review team China Germany Italy Mexico
New Zealand World Bank IEA IISD GSI GIZ Indonesia and the OECD Chair of the peer review
April 201
https www oecd org fossil fuels publication G20 20peer 20review 20Indonesia Final v2 pdf
SEPA The chemistry of air pollution Scottish Environment Protection Agency
https www sepa org uk media 120465 mtc chem of air pollution pdf
26Sofyan A Kitada T & Kurata G 200 Numerical study of the NOx and SOx dynamics under
land sea breezes in dry season in Jakarta Indonesia Journal of Global Environment Engineering
13 6 6 March 200
Suarez I & Myllyvirta L 2020 COVID1 Lockdowns across Southeast Asia improve air quality but
not everywhere Centre for Research on Energy and Clean Air
https energyandcleanair org covid1 lockdowns across southeast asia
Sullivan T M Adams J Milian L Subramaniam S Feagin L Williams J Boyd A 2006 Local
impacts of mercury emissions from the Monticello coal fired power plant Environmental Sciences
Department Environmental Research & Technology Division Brookhaven National Laboratory
2006 BNL 774752007 IR https www bnl gov isd documents 33077 pdf
UN Environment 201 Global Mercury Assessment 201 UN Environment Programme Chemicals
and Health Branch Geneva Switzerland
https wedocs unep org bitstream handle 20 500 11 22 2757 GMA201 pdf sequence 1&isAllo
wed y
US EPA 2016 Basic Information about NO2 United States Environmental Protection Agency
https www epa gov no2 pollution basic information about no2
US EPA 201 Sulfur Dioxide Basics United States Environmental Protection Agency
https www epa gov so2 pollution sulfur dioxide basics what 20is 20so2
WHO 2016 Health risk assessment of air pollution General Principles World Health Organization
Copenhagen WHO Regional Office for Europe 2016
https www euro who int data assets pdf file 0006 2 4 2 Health risk assessment air polluti
on General principles en pdf
World Bank 1 7 Urban Air Quality Management Strategy in Asia Jakarta Report World Bank
Technical Paper No 37 https elibrary worldbank org doi pdf 10 15 6 0 213 4035 2
Xiao Wu Rachel C Nethery M Benjamin Sabath Danielle Braun Francesca Dominici 2020
Department of Biostatistics Harvard T H Chan School of Public Health Boston MA 02115 USA
27Appendix
Data for modeled coal power plants
Table A O e a i g a d la ed c al fi ed e la i hi k f Ce al Jaka a
Plant Latitude Longitude Units Capacity MW Status
PLTU Suralaya 5 274 106 030 4025 Operating
PLTU Labuan Unit 1 2 6 3 212 105 2 5 2 600 Operating
PLTU Lontar Unit 1 3 6 05 41 106 461 3 45 Operating
PLTU Babelan Unit 1 2 6 11607 107 052 2 2 0 Operating
PLTU Banten Unit 1 5 2 7 106 045 1 670 Operating
Lestari Banten Energi
PLTU Pelabuhan Ratu 7 0242 106 5464 3 1050 Operating
PLTU Jawa 7 Unit 1 5 6 1 106 0 17 1 1000 Operating b
i cl ded i deli g
PLTU Jawa 7 Unit 2 5 6 1 106 0 17 1 1000 Construction
PLTU Lontar Expansion 6 05 41 106 461 1 315 Construction
PLTU Jawa 9 5 3 4 106 0227 1000 Financing
PLTU Jawa 10 5 3 4 106 0227 1000 Financing
PLTU Banten Unit 2 5 2 7 106 045 660 Planned
PLTU Jawa 5 5 274 106 030 1000 Planned
Table A E i a ed ai ll a e i i f eai g e la CALPUFF M deli g I
Units Thermal Flue Gas Annual Emissions Tonnes
Efficiency Concentration
mg Nm3 SO2 NOx PM PM10 PM2.5 Hg kg
PLTU Suralaya Subcritical 1 06 1 06 3 41 2 30 1 026 0
Banten 1 4 pulverized SO2 550
combustion NOx 550
PLTU Suralaya 34 Dust 100 21 157 21 157 3 47 25 6 1 154 101
Banten 5 7 efficiency
PLTU Suralaya Subcritical 016 016 1 457 4 437 3
Banten 8 37
2PLTU Labuan Sub critical 76 5 76 5 13 44 420 37
Unit 1 2 circulating
fluidized
37
PLTU Lontar Subcritical 11 01 11 01 2 146 1 44 644 56
Unit 1 3 3
PLTU Babelan Subcritical 34 7 34 7 636 42 1 1 17
Unit 1 2 3
PLTU Banten Supercritical 367 367 1 521 1 027 456 40
Unit 1 Lestari 3
Banten Energi
PLTU Pelabuhan Subcritical 13 113 13 113 23 4 1 60 715 63
Ratu 3
Table A Ba ic Pla Da a CALPUFF M deli g I
Plants Stack Height Stack Inner Flue Gas Flue Gas
m Diameter m Velocity m s Temperature C
PLTU Suralaya Banten 1 4 200 55 21 5 72
PLTU Suralaya Banten 5 7 275 65
PLTU Suralaya Banten 8 275
PLTU Labuan Unit 1 2 215 75 4 5
PLTU Lontar Unit 1 3 127 46 25 131
PLTU Babelan Unit 1 2 235 63 17 4 0
PLTU Banten Unit 1 235 63 17 4 0
Lestari Banten Energi
PLTU Pelabuhan Ratu 235 63 17 4 0
2Methodology of EDGAR 5.0
The Emissions Database for Global Atmospheric Research EDGAR v5 used to generate findings on
the emissions sources in Jakarta s airshed provides data on past and present day 1 70 2015
anthropogenic emissions of air pollutants by country and sector on a spatial 0 1 degree by 0 1
degree grid The emissions inventories found in Figures 11 and 12 feature emissions not ambient
concentrations for three major pollutants available with EDGAR These emissions are calculated
using a technology based emission factor approach checked for abatement measures and quality
controlled This is applied consistently across all countries on an annual basis In addition EDGAR
uses a geographical database built using spatial proxies to plot the location of energy and
manufacturing facilities road networks shipping routes human and animal population density
and agricultural land use which can vary and change significantly over time This gives us the
ability to aggregate approximate emissions down to the city level and disaggregate by pollutant
and sector EDGAR relies on various proxies to allocate emissions from the national level Where
they are not available it relies on population density As a result some emissions for sectors like
industry though very often significantly high emitter can be overestimated over urban areas
with large populations However in combining the emissions of Banten West Java and DKI
Jakarta in Figure 12 we are able to better understand how facilities even outside the 100km focus
of this study emit and therefore become a factor in Jakarta s airshed and the city s overall air
pollution
Example of EDGAR emissions data: road transport emissions
3030 day running average of daily PM2.5 concentrations in Jakarta, Indonesia
U i g
SOURCE CREA A al i f US E ba i i g ai i Jaka a acce ed h gh O e AQ
Change in NO2 levels over the last decade
U i D b U i DU
SOURCE CREA A al i fN
ASA OMI Dail Da a
31Atmospheric NO2 from 12 March to 4 June 2020 left vs 2019 right during COVID 19 WFH
and PSBB show a decrease in NO2 over Jakarta, Banten and West Java and no change in
Suralaya
S ce CREA A al i f TROPOMI Se i el P Sa elli e da a
32You can also read