TRANSCRIPTIONAL, HORMONAL, AND METABOLIC CHANGES IN SUSCEPTIBLE GRAPE BERRIES UNDER POWDERY MILDEW INFECTION - MPG.PURE
←
→
Page content transcription
If your browser does not render page correctly, please read the page content below
Journal of Experimental Botany, Vol. 72, No. 18 pp. 6544–6569, 2021
https://doi.org/10.1093/jxb/erab258 Advance Access Publication 9 June 2021
This paper is available online free of all access charges (see https://academic.oup.com/jxb/pages/openaccess for further details)

RESEARCH PAPER

                                                                                                                                                             Downloaded from https://academic.oup.com/jxb/article/72/18/6544/6295384 by Max-Planck-Institute for Biogeochemistry user on 13 October 2021
Transcriptional, hormonal, and metabolic changes in
susceptible grape berries under powdery mildew infection
Diana Pimentel1, Rute Amaro1,*, Alexander Erban2,*, Nuria Mauri3,*, Flávio Soares1, Cecília Rego4,
José M. Martínez-Zapater3, Axel Mithöfer5, , Joachim Kopka2, and Ana Margarida Fortes1,†,
1
  BioISI – Biosystems and Integrative Sciences Institute, Faculty of Sciences, University of Lisbon, Campo Grande, 1749-016 Lisboa,
Portugal
2
  Max-Planck-Institut für Molekulare Pflanzenphysiologie, 14476 Potsdam-Golm, Germany
3
  Instituto de Ciencias de la Vid y del Vino, CSIC-UR-Gobierno de La Rioja, Ctra. de Burgos km 6, 26007 Logroño, Spain
4
  Instituto Superior de Agronomia, Universidade de Lisboa, Tapada da Ajuda, 1349-017 Lisboa, Portugal
5
  Research Group Plant Defense Physiology, Max-Planck-Institute for Chemical Ecology, 07745 Jena, Germany

* These authors contributed equally to this work.
†
  Correspondence: amfortes@fc.ul.pt

Received 19 November 2020; Editorial decision 1 June 2021; Accepted 8 June 2021

Editor: Ariel Vicente, CONICET – National University of La Plata, Argentina

Abstract
Grapevine (Vitis vinifera) berries are extremely sensitive to infection by the biotrophic pathogen Erysiphe necator,
causing powdery mildew disease with deleterious effects on grape and wine quality. The combined analysis of the
transcriptome and metabolome associated with this common fungal infection has not been previously carried out in
any fruit. In order to identify the molecular, hormonal, and metabolic mechanisms associated with infection, healthy
and naturally infected V. vinifera cv. Carignan berries were collected at two developmental stages: late green (EL33)
and early véraison (EL35). RNA sequencing combined with GC–electron impact ionization time-of-flight MS, GC–elec-
tron impact ionization/quadrupole MS, and LC–tandem MS analyses revealed that powdery mildew-susceptible grape
berries were able to activate defensive mechanisms with the involvement of salicylic acid and jasmonates and to
accumulate defense-associated metabolites (e.g. phenylpropanoids, fatty acids). The defensive strategies also indi-
cated organ-specific responses, namely the activation of fatty acid biosynthesis. However, defense responses were
not enough to restrict fungal growth. The fungal metabolic program during infection involves secretion of effectors re-
lated to effector-triggered susceptibility, carbohydrate-active enzymes and activation of sugar, fatty acid, and nitrogen
uptake, and could be under epigenetic regulation. This study also identified potential metabolic biomarkers such as
gallic, eicosanoic, and docosanoic acids and resveratrol, which can be used to monitor early stages of infection.

Keywords: Biotic stress, Erysiphe necator, grapevine, hormonal profiling, metabolome, plant defense, powdery mildew,
transcriptome, susceptibility, Vitis vinifera.

Abbreviations: CAZymes, carbohydrate-active enzymes; EL33, late green stage; EL35, early véraison stage; ETI, effector-triggered immunity; PAMP, pathogen-
associated molecular pattern; PM, powdery mildew; PRR, pattern-recognition receptor; PTI, PAMP-triggered immunity.
© The Author(s) 2021. Published by Oxford University Press on behalf of the Society for Experimental Biology. All rights reserved.
For permissions, please email: journals.permissions@oup.com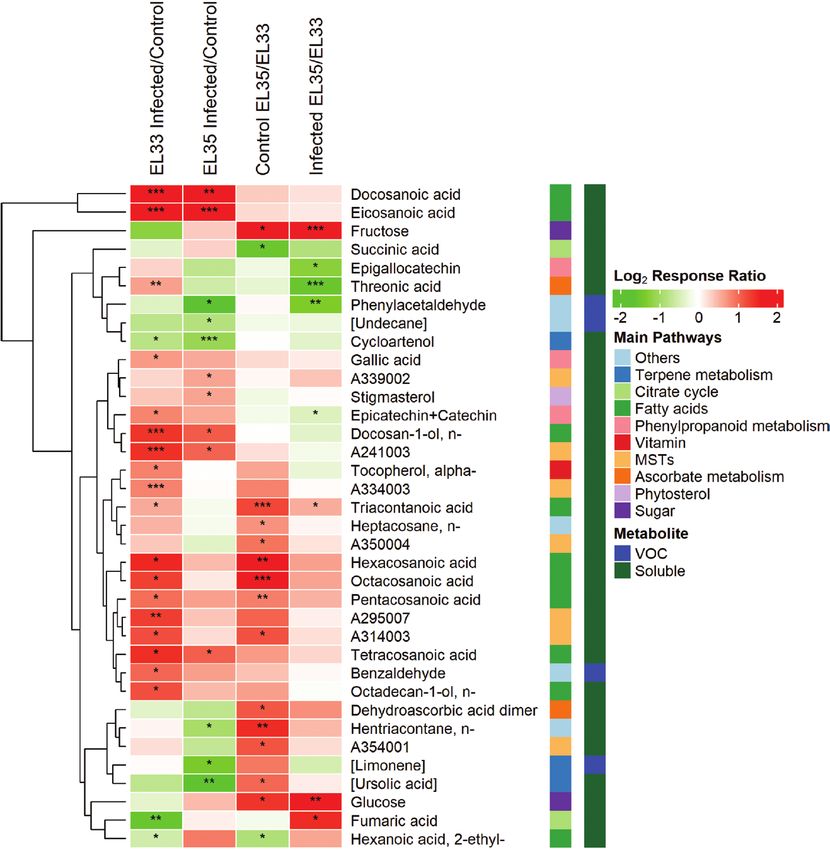
Metabolism of grapes infected with powdery mildew | 6545

Introduction                                                            induction of JA and ethylene signaling has been associated
                                                                        with the elicitation of resistance and associated defense re-
Grapevine (Vitis vinifera L.) is a perennial woody plant highly         sponses against powdery mildew in grapevine (Belhadj et al.,
susceptible to several abiotic and biotic stresses. Powdery             2006, 2008).
mildew (PM) is one of the most dramatic diseases affecting                 Most of the studies on responses to fungal infections have
grape production worldwide. It is caused by the ascomycete              focused on grapevine leaves, and little is known about the

                                                                                                                                                       Downloaded from https://academic.oup.com/jxb/article/72/18/6544/6295384 by Max-Planck-Institute for Biogeochemistry user on 13 October 2021
fungus Erysiphe necator Schw. (syn. Uncinula necator [Schw.]            defense mechanisms in fruits. The actual effect of powdery
Burr.), an obligate biotrophic fungus that infects berry clusters       mildew in grape berry and wine quality is controversial since
and predisposes them to bunch rot infections (Calonnec et al.,          sugar content of infected berries and resulting wines was re-
2004; Gadoury et al., 2007, 2012). Eurasia-originated V. vinifera       ported to be both increased (Ough and Berg, 1979; Calonnec
species are more susceptible to PM than the native North                et al., 2004) and decreased (Gadoury et al., 2001), as well as
American Vitis species (Qiu et al., 2015). Moreover, resistance         their anthocyanin content being both increased and decreased
to PM was also found in Chinese accessions of non-vinifera              (Ough and Berg, 1979; Piermattei et al., 1999; Calonnec et al.,
species, namely V. romanetti (Riaz et al., 2011), V. pseudoreticulata   2004).
(Wang et al., 1995; Weng et al., 2014) and V. piasezkii (Pap               Erysiphe necator affects mainly green tissues and, during
et al., 2016), as well as in Central Asian accessions of V. vinifera    normal ripening, grape berries develop an ontogenetic, i.e.
(Hoffmann et al., 2008; Amrine et al., 2015). Since most of the         age-related, resistance (Gadoury et al., 2003; Ficke et al., 2003).
cultivars used for wine and table grape production belong to            The period of fruit susceptibility is in general small, and resist-
V. vinifera, PM has spread to all vinicultural regions, and the         ance to PM in several V. vinifera cultivars increases around 2–4
control strategy is entirely dependent on the widespread ap-            weeks after bloom (Gadoury et al., 2003; Ficke et al., 2003).
plication of sulfur-based and synthetic fungicides resulting in         This is characterized by a reduction of penetration rate, near-
environmental poisoning and an impact on health.                        immunity to new infections or to colonization of established
   During infection, the E. necator conidia form the                    colonies, and changes in latent period and sporophore density
appressorium that ruptures the cell wall and penetrates the             (Ficke et al., 2003). Nevertheless, Gadoury et al. (2007) ob-
plant cell, and then a feeding structure (haustorium) respon-           served that berries could still support inconspicuous colonies
sible for the dynamic exchanges between the fungus and the              after the onset of ontogenetic resistance, and this was associated
host cells is formed (Gadoury et al., 2012). Several defense            with the presence of epiphytic microorganisms, Botrytis cinerea,
mechanisms to prevent pathogen penetration and colonization             and insects, that are attracted by specific volatiles.
have been described in plants (Jones and Dangl, 2006).The two              Mechanisms behind grapevine resistance or susceptibility
primary defense responses are pathogen-associated molecular             are highly complex, and despite the various studies per-
pattern (PAMP)-triggered immunity (PTI) and effector-                   formed so far, PM defense responses remain unclear, particu-
triggered immunity (ETI). Both responses take place consecu-            larly in infected fruits. Therefore, in this study, we applied high
tively and are interconnected. PM species adapted to a specific         throughput technologies combined with targeted approaches
host are thought to release effectors to repress PTI, resulting in      to shed light on how extremely susceptible grape berries
effector-triggered susceptibility. In response, host plants have        (V. vinifera cv. Carignan) respond to natural PM infection at
evolved ETI as a second layer of resistance whereby these PTI-          the early stages of ripening. The data suggests the activation
suppressing effector molecules are detected by resistance (R)           of defensive mechanisms in response to PM infection, as pre-
genes that, in turn, activate several defense responses, including      viously observed in leaves (Fung et al., 2008). However, cer-
programmed cell death (Gadoury et al., 2012). Most character-           tain responses seem to be differently modulated in berries and
ized plant R-genes encode proteins with leucine-rich repeat             leaves, suggesting organ-specific mechanisms. Furthermore,
domains (LRRs), a central nucleotide-binding site (NB), and a           our results provide novel insights concerning the hormonal
variable N terminus (Jones and Dangl, 2006). Several genes in-          regulation of defense against E. necator with the putative in-
volved in PM resistance have been identified in Vitaceae species        volvement of jasmonates, often associated with response against
such as those coding for pathogenesis-related (PR) proteins             necrotrophs (Coelho et al., 2019).
and stilbene synthases, and those involved in defense signal per-
ception and transduction (reviewed by Qiu et al., 2015).
   Plant hormones are also essential in biotic stress responses,        Materials and methods
including salicylic acid (SA), jasmonic acid (JA), and ethylene.
                                                                        Sampling
SA is classically related to response against biotrophic and
hemibiotrophic pathogens, whereas JA and ethylene are central           Grape berry clusters (V. vinifera L. cv. Carignan) were collected in 2017
                                                                        from a commercial vineyard subjected to regular phytosanitary treatments at
players in resistance to necrotrophic pathogens (Glazebrook,            Torres Vedras region, Portugal (39°04′43.2″N, 9°20′58.9″W). Sampling was
2005). The basal levels of SA were shown to be higher in re-            performed in two conditions, healthy berries and naturally infected berries,
sistant V. aestivalis cv. Norton than in susceptible V. vinifera cv.    at two developmental stages, late green (EL33) and early véraison (EL35;
Cabernet Sauvignon (Fung et al., 2008). On the other hand,              25–30% colored berries). For each condition (PM infected and control) and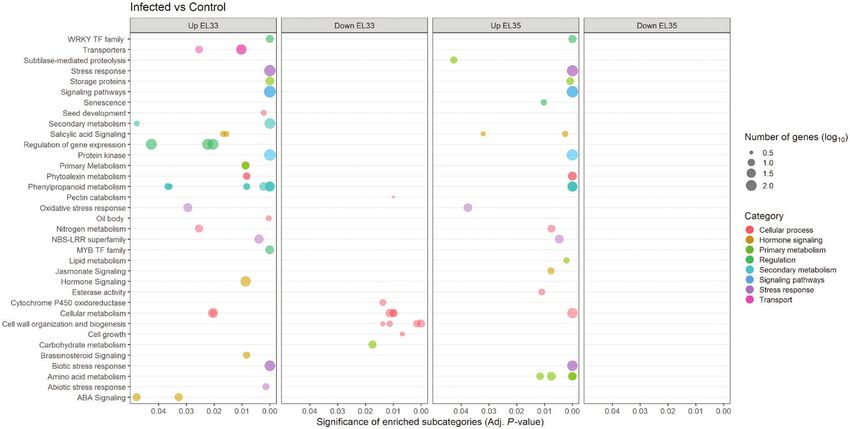
6546 | Pimentel et al.

time point, four to five biological replicates (corresponding to four to five     significantly enriched according to the classification of 12X V1 annota-
clusters from different plants, 20–25 berries from each cluster) were collected   tion (Grimplet et al., 2012). FatiGO uses Fisher’s exact test to compare
on 13 July and 2 August 2017 after visual inspection of symptoms. Grape           each DEG list with the list of total non-redundant transcripts housed
clusters were harvested around 11.30 h and immediately frozen in liquid           in the grapevine 12X V1 gene predictions (Grimplet et al., 2012); sig-
nitrogen, transported in dry ice to the laboratory, and stored at −80 °C until    nificantly enriched categories were selected considering the corrected
further use. Prior to transcriptomic and metabolomic analysis, berries were       P-value ≤0.05 (Benjamini–Hochberg correction for multiple testing).
deseeded and ground. Three to four replicates were used for metabolomics

                                                                                                                                                                 Downloaded from https://academic.oup.com/jxb/article/72/18/6544/6295384 by Max-Planck-Institute for Biogeochemistry user on 13 October 2021
and hormone quantification and some of those samples were pooled to ob-
tain three independent biological replicates for RNA-seq analysis.                Real-time PCR
                                                                                  First-strand cDNA was synthesized from 2 μg of total RNA, according
                                                                                  to Fortes et al. (2011). Real-time PCRs (qPCRs) were carried out using
DNA extraction and biomass quantification                                         the StepOne Real-Time PCR System (Thermo Fisher Scientific, USA).
DNA was extracted according to Lodhi et al. (1994) with some modifi-              Cycling conditions were 95 °C for 10 min, followed by 42 cycles of 95 °C
cations. Before the RNase A purification, a treatment with 1/10 vol 2 M           for 15 s and primers’ annealing temperature for 1 min. Relative expression
potassium acetate (1 h on ice) was added to the protocol to precipitate           data were obtained from three to four biological replicates and duplicate
polysaccharides. Fungal biomass accumulation was measured relatively by           technical replicates (in separate plates).The standard curve was built using
real-time PCR (qPCR), according to Jones et al. (2014), by amplifying             a serial dilution of mixtures of all cDNAs analysed (1:1, 1:4, 1:16, 1:64,
the E. necator elongation factor (EnEF1, KHJ34692) and the grapevine              and 1:256), and used to check primer efficiency. Data were normalized
actin (VvActin) as reference (Supplementary Table S1).                            using the expression curves of the actin gene (VIT_04s0044g00580) and
                                                                                  elongation factor 1α gene (VIT_06s0004g03220). All primers used are
                                                                                  shown in Supplementary Table S1.
RNA extraction
RNA extraction was performed as described by Coelho et al. (2019).
                                                                                  Soluble metabolites
A DNase treatment was carried out using TURBO DNase according to
the supplier’s instructions (Thermo Fisher Scientific, USA). RNA was then         The profiling of soluble metabolites was performed by gas chromatog-
purified using Spectrum Plant Total RNA kit (Sigma-Aldrich, USA).                 raphy coupled to electron impact ionization time-of-flight mass spec-
                                                                                  trometry (GC-EI/TOF-MS), as specified by Dethloff et al. (2014).
                                                                                  Soluble metabolites were extracted, as previously described by Agudelo-
RNA-seq and differential gene expression analysis                                 Romero et al. (2013), from 300±30 mg (fresh weight) of deep-frozen
RNA-seq was performed at the Centre for Genomic Regulation (CRG,                  powder by 1 ml ethylacetate for 2 h of agitation at 30 °C. Extracts were
Barcelona, Spain). The cDNA libraries were prepared using the TruSeq              centrifuged for 5 min at 18 000 g, and two aliquots of 300 µl from the
Stranded mRNA Sample Prep kit v2 (Illumina, ref. RS-122-2101/2)                   ethylacetate fraction were dried by vacuum concentration and stored at
using 600 ng of total RNA according to the manufacturer’s protocol.               −20 °C.
Poly(A)-mRNA selection using streptavidin-coated magnetic beads and                  Chemical derivatization and retention index calibration were per-
subsequent RNA fragmentation to 300 bp was performed. Final libraries             formed prior to injection, as described by Dethloff et al. (2014). GC-EI/
were analysed using Agilent DNA 1000 chip to check the quality. Library           TOF-MS analysis was performed using an Agilent 6890N24 gas chro-
sequencing was performed on an Illumina HiSeq2500 sequencer using                 matograph (Agilent Technologies, Germany) connected to a Pegasus III
V4 chemistry (Illumina) and ~50 million paired-end strand-specific reads          time-of-flight mass spectrometer (LECO Instrumente GmbH, Germany),
of 75 bp were produced per sample.                                                with splitless injection onto a Varian FactorFour capillary column
   Reads alignment to the concatenated PN40024 12X.0 grapevine refer-             (VF-5 ms) of 30 m length, 0.25 mm inner diameter, and 0.25 mm film
ence genome assembly (Jaillon et al., 2007) and E. necator C-strain scaffolds     thickness (Varian-Agilent Technologies, Germany). Chromatograms
(Jones et al., 2014) was performed using HISAT2 version 2.1.0 with two            were acquired, visually controlled, baseline corrected, and exported in
consecutive mapping steps in order to find the splice sites independently of      NetCDF file format using ChromaTOF software (Version 4.22; LECO,
the annotations (Kim et al., 2015). Potential PCR duplicates were removed         St Joseph, MI, USA).
with rmdup of SAMtools (http://samtools.sourceforge.net/, v. 1.3.1).                 Compounds were identified by mass spectra and retention time
After filtering, only the uniquely mapped reads with concordant insert            index matching to the Golm Metabolome Database (Kopka et al., 2005;
size and orientation were used for further analysis. The htseq-count tool         Hummel et al., 2010) using TagFinder software (Luedemann et al., 2008).
(version0.11.1) of HTSeq (Anders et al., 2015) was used for strand-specific       Guidelines for manually supervised metabolite identification were the
counting of read-pairs mapped to the exon regions annotated in the grape-         presence of at least three specific mass fragments per compound and
vine 12X V1 and E. necator genomes (Supplementary Table S2). Counts per           a retention index deviation of less than 1.0 % (Strehmel et al., 2008).
gene were summarized and the dataset was balanced following the trimmed           Metabolite intensities were normalized by sample fresh weight and in-
mean of M-values (TMM) method (Robinson and Oshlack, 2010) imple-                 ternal standard (C22) and maximum scaled, i.e. the maximum scaled
mented in edgeR version 3.24.3 (Robinson et al., 2010). Depth and gene            normalized response. Log2-transformed response ratios were calculated
length were normalized transforming pair-read to fragments per kb per             to approximate normal distribution for statistical analysis.
million counts (FPKM) with rpkm function (genes were considered as ex-
pressed with mean FPKM in three replicates >1). After dispersion between          Volatile metabolites
samples was evaluated, an ANOVA-like test was run for any pairwise com-
parison with the exactTest function. Obtained P-values were re-adjusted (by       Volatile profiling used 500±50 mg (fresh weight) of deep-frozen
the Benjamini–Hochberg procedure) and the significant genes were filtered         grape berry powder and was performed by solid-phase micro-
out by false discovery rate (FDR) of ≤0.05 and fold change of ≥2.0 or ≤–2.0.      extraction (SPME) and GC coupled to an EI/quadrupole MS
                                                                                  (GC-EI/QUAD-MS) using an Agilent 5975B VL GC-MSD system
                                                                                  and a StableFlex SPME-fiber with 65 μm polydimethylsiloxane/
Functional analysis of differentially expressed genes                             divinylbenzene (PDMS-DVB) coating (Supelco, USA) as described
The list of differentially expressed genes (DEGs) was analysed using              by Vallarino et al. (2018). SPME samples were taken from the head-
FatiGO (Al-Shahrour et al., 2007) to identify functional categories               space with 10 min incubation at 45 °C, 5 min adsorption at 45 °C,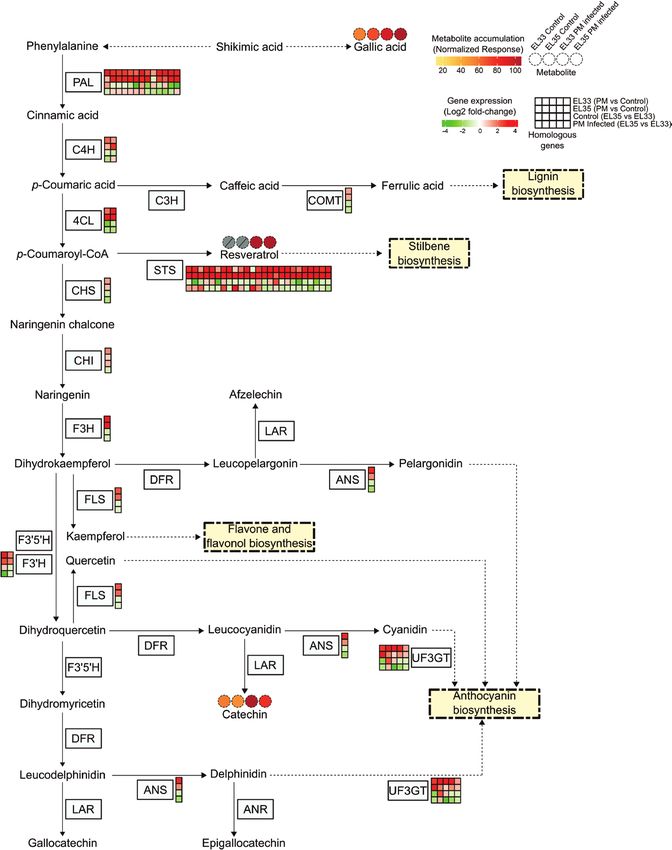
Metabolism of grapes infected with powdery mildew | 6547
and 1 min desorption at 250 °C and transferred onto a DB-624 capil- centrifuged at 15 000 g for 30 min. Twenty microliters of the extract was
lary column with 60 m length, 0.25 mm inner diameter, and 1.40 µm added to diluted Folin–Ciocalteu reagent (1:10). Upon 10 min incuba-
film thickness (Agilent Technologies, Germany). GC temperature tion, 800 μl of 7.5% (w/v) sodium carbonate was added to the reaction,
programming was 2 min isothermal at 40°C followed by a 10 °C/ incubated for 30 min, and absorbance measured at 743 nm. Total phen-
min ramp to 260 °C final temperature, which was held constant for olic content was expressed as gallic acid equivalents (GAE, mg) per mg
10 min. The Agilent 5975B VL GC-MSD system was operated with freeze-dried weight.
a constant flow of helium at 1.0 ml/min. Desorption from the SPME
Downloaded from https://academic.oup.com/jxb/article/72/18/6544/6295384 by Max-Planck-Institute for Biogeochemistry user on 13 October 2021
fiber was at 16.6 psi with an initial 0.1 min pulsed-pressure at 25 psi.
The subsequent purge was 1 min at a purge flow of 12.4 ml/min. Protein extraction and phenylalanine ammonia lyase
System stability was controlled and the sample sequence randomized. enzymatic assay
GC-EI/QUAD-MS chromatograms were acquired with mass range
Protein extraction from grape berry powder was performed as described
set to 30–300 m/z and a 20 Hz scan rate. Chromatograms were ac-
by Conde et al. (2016), with minor alterations. Briefly, 1 g of deep-frozen
quired, visually controlled, and exported in NetCDF file format using
grape berry powder was mixed with 2 ml of extraction buffer and centri-
Agilent ChemStation software (Agilent) and baseline-corrected with
fuged at 18 000 g for 20 min at 4°C. Supernatant was used for further as-
ChromaTOF software (Version 4.22; LECO).
says. Protein extraction buffer contained 50 mM Tris–HCl pH 8.8, 5 mM
Compounds were identified using TagFinder software (Luedemann
MgCl2, 1 mM EDTA pH, 1 mM phenylmethylsulfonyl fluoride, 5 mM
et al., 2008) and the reference collection of the Golm Metabolome
dithiothreitol and 1% (w/v) PVPP. Total protein content of each extract
Database for volatile compounds (Kopka et al., 2005; Hummel et al.,
was determined by the Bradford assay (Bradford, 1976), using bovine
2010). Guidelines for manually supervised identification were the pres-
serum albumin as standard.
ence of at least three specific mass fragments per compound and a re-
Phenylalanine ammonia lyase (PAL) enzymatic activity was meas-
tention time deviation of less than 3%. Metabolite intensities were
ured in a reaction mixture containing 200 µl of protein extract, 500 µl
normalized by sample fresh weight and maximum scaled, i.e. the max-
250 mM Tris–HCl pH 8.8, and 250 µl substrate (40 mM L-phenylalanine,
imum scaled normalized response. Log2-transformed response ratios were
100 mM Tris–HCl pH 8.8) and was incubated at 37 °C for 30 min. The
calculated to approximate normal distribution for statistical analysis.
rate of conversion of L-phenylalanine to cinnamic acid was monitored
spectrophotometrically at 290 nm each 10 min (ε=17400 M−1 cm−1).
Hormonal profiling The reaction was initiated by the addition of L-phenylalanine.
About 30 mg of berry samples previously freeze-dried at −40 °C for 3 d
were extracted in 1.5 ml methanol containing 60 ng D4-SA (Santa Cruz Statistical analysis
Biotechnology, USA), 60 ng D6-JA (HPC Standards GmbH, Germany),
60 ng D6-abscicis acid (ABA) (Santa Cruz Biotechnology), and 12 ng Statistical analysis of metabolomics data was performed using log2-
D6-jasmonoyl isoleucine (JA-Ile) (HPC Standards GmbH) as internal transformed response ratios and included Student’s t-test, one- and two-
standards. Samples were agitated at room temperature for 10 min. The way ANOVA, Kruskal–Wallis and Wilcoxon rank-sum tests. For multiple
homogenate was mixed for 30 min and centrifuged at 15 000 g for comparisons, the Benjamini–Hochberg correction was used, which de-
20 min at 4 °C and the supernatant was collected. The homogenate was fines a sequential P-value procedure that controls the expected proportion
re-extracted with 500 μl methanol, centrifuged, and supernatants were of falsely rejected hypotheses – the FDR. Principal component analysis
pooled. The combined extracts were evaporated under reduced pressure was performed applying the MetaGeneAlyse web application (v.1.7.1;
at 30 °C and dissolved in 500 μl methanol. http://metagenealyse.mpimp-golm.mpg.de) and the R function prcomp
Phytohormone analysis was performed by LC–tandem mass spectrom- to the log2-transformed response ratios with missing value substitution,
etry (MS/MS) as in Heyer et al. (2018) on an Agilent 1260 series HPLC log2=0. Heatmaps were designed using the R package ComplexHeatmap
system (Agilent Technologies) coupled to a tandem mass spectrometer (Gu et al., 2016).Venn diagrams were designed using Venny 2.1 web ap-
API5000 (SCIEX, Darmstadt, Germany). Since D6-labeled JA and D6- plication (v. 2.1.0; http://bioinfogp.cnb.csic.es/tools/venny/).
labeled JA-Ile standards (HPC Standards GmbH, Cunnersdorf, Germany)
contained 40% of the corresponding D5-labeled compounds, the sum
of the peak areas of D5- and D6-compound was used for quantification.
Details of the instrument parameters and response factors for quantifica- Results
tion are shown in Supplementary Table S3.
Indolacetic acid was quantified using the same LC-MS/MS system with Phenotypic assessment and evaluation of main
the same chromatographic conditions but using positive mode ionization ripening parameters in powdery mildew-infected and
with an ion spray voltage at 5500 eV. Multiple reaction monitoring was control grape berries
used to monitor analyte parent ion→product ion fragmentations as fol-
lows: m/z 176→130 (collision energy (CE) 19 V; declustering potential In order to study the effect of powdery mildew infection on
(DP) 31 V) for indolacetic acid (IAA); m/z 181→133 + m/z 181→134 + grape berry physiology, infected and healthy berry samples
m/z 181→135 (CE 19 V; DP 31 V) for D5-indolacetic acid. were collected at two ripening stages, green (EL33) and early
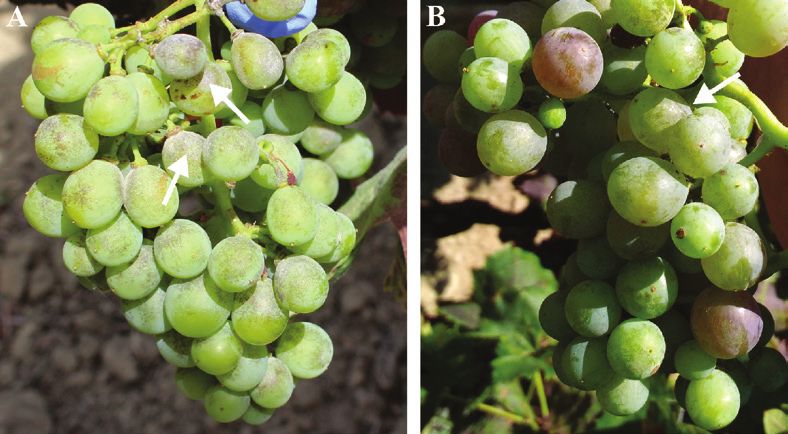
véraison (EL35), according to the modified E-L system (Fig.
Anthocyanin and total phenolic content quantification 1; Coombe, 1995). The EL33 stage is characterized by green
Anthocyanin quantification was measured as previously described and firm berries, with low sugar content, and EL35, which
(Agudelo-Romero et al., 2013). Total relative anthocyanin concentration corresponds to the onset of ripening, is characterized by berry
was expressed as absorbance value at 520 nm per gram freeze-dried weight. softening, anthocyanin accumulation, and increase in sugar
Total phenolic content was measured using the Folin–Ciocalteau col-
orimetry method and a gallic acid calibration curve ranging from 12.5
content (Conde et al., 2007). Infected and control samples were
to 125 µg ml−1 (Singleton and Rossi, 1965). Phenolics were extracted distinguished by visual inspection and fungal biomass accumu-
from 50 mg of lyophilized grape berry samples in ultra-pure water and lation evaluated by real-time PCR (Supplementary Fig. S1).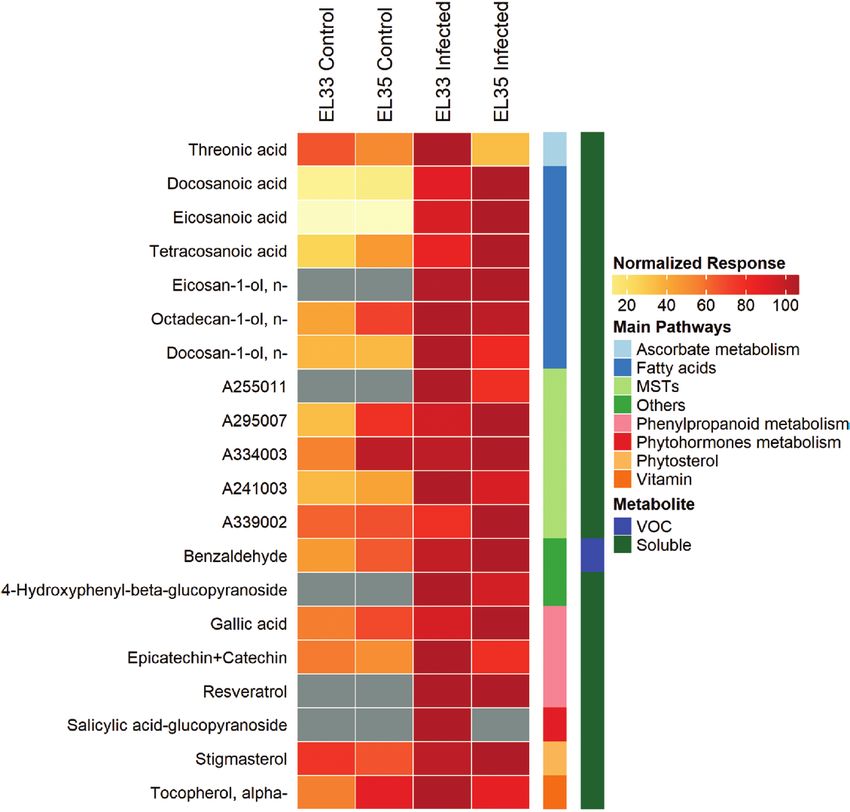
6548 | Pimentel et al.

                                                                            (4-hydroxyphenyl-β-glucopyranoside and salicylic acid-
                                                                            glucopyranoside), and an unidentified compound (A255011).
                                                                               Regarding fatty acids, several saturated long-chain fatty
                                                                            acids and fatty alcohols were present in a significantly higher
                                                                            amount in infected berries in comparison with control (Fig.
                                                                            3). Eicosanoic acid (arachidic acid), docosanoic acid (behenic

                                                                                                                                                Downloaded from https://academic.oup.com/jxb/article/72/18/6544/6295384 by Max-Planck-Institute for Biogeochemistry user on 13 October 2021
                                                                            acid), and tetracosanoic acid were accumulated in infected
                                                                            berries at both stages (Fig. 4). Eicosanoic acid was identi-
                                                                            fied as a quantitative marker of PM presence in grape berries
                                                                            (Petrovic et al., 2017). Hexacosanoic acid, octacosanoic acid,
                                                                            and pentacosanoic acid were also responsive to infection but
                                                                            only at the green stage (Fig. 3). The fatty alcohol derived from
Fig. 1. Clusters of Vitis vinifera cv. Carignan grapes naturally infected   eicosanoic acid (n-eicosan-1-ol) was only detected in infected
with powdery mildew (Erysiphe necator) at (A) EL33 and (B) EL35             berries (Fig. 4). Concerning other acids, fumaric acid, an inter-
developmental stages.                                                       mediate metabolite in the citric acid cycle, was present in a
                                                                            lower amount in infected berries at EL33 in comparison with
   Berry weight and content of main sugars, organic acids, and              control (Fig. 3).
anthocyanins were analysed to evaluate the effect of PM in the                 Concerning secondary metabolites, gallic acid, catechins,
main parameters of fruit ripening (Fig. 2). PM infection led to             α-tocopherol, and the phytosterol stigmasterol were present in
a higher accumulation of anthocyanins at the green stage; how-              higher quantity in infected berries than in control berries at
ever, no significant changes were observed for berry weight,                EL33 and/or EL35 stages (Fig. 3) while resveratrol was only
sugar, and organic acids between control and infected berries.              identified in infected berries (Fig. 4), confirming other studies
At early véraison stage, an increase in anthocyanins and glucose            (Piermattei et al., 1999). Relative to terpene metabolism, pu-
and fructose content was observed in both conditions. These                 tative ursolic/oleanolic acid and cycloartenol were present in
results suggest that PM infection caused a minor effect on the              lower amounts in infected berries at EL35 and both stages,
main ripening parameters.                                                   respectively (Fig. 3).
                                                                               Regarding volatile compounds, four metabolites were
Metabolic profiling of control and infected berries                         identified as infection responsive. Limonene, undecane, and
revealed a substantial reprogramming of fatty acid                          phenylacetaldehyde were accumulated less in infected berries
metabolism                                                                  at the véraison stage than in control berries (Fig. 3). On the
                                                                            other hand, benzaldehyde was accumulated after infection at
Metabolic profiling of control and infected berries was per-                the green stage (Fig. 3).
formed by GC-EI/TOF-MS, which allowed the relative quan-                       These results indicate a substantial metabolic reprogram-
tification of 100 metabolites belonging to several classes of               ming in berries upon infection with E. necator, involving fatty
compounds, such as fatty acids, sugars, and phenylpropanoids                acid and phenylpropanoid metabolism.
(Supplementary Table S4). Volatile compounds (23) were in-
cluded by SPME and GC-EI/QUAD-MS (Supplementary                             Transcriptional profiling of infected and control grape
Table S4). Normalized response data were used for prin-                     berry samples
cipal component analysis. The two major principal compo-
nents explained 37.65% of the variability, showing a good                   RNA-seq analysis was carried out to access the expression
separation between control and infected berries and also be-                profiles of PM-infected and control berries at the EL33
tween developmental stages (Supplementary Fig. S2). Thirty-                 and EL35 stages. An average of 46 468 679±2 280 892 raw
six metabolites showed differential content comparing either                reads were obtained per sample and aligned to the concat-
infected and control samples or green and véraison stages                   enated grapevine PN40024 reference genome and E. necator
(Fig. 3; Supplementary Table S4). Additionally, 20 metabol-                 C-strain scaffolds; 86.5±8.0% were retained after filtering
ites were identified as potential positive markers of infection             (Supplementary Table S2). RNA-seq data revealed the ex-
(Fig. 4; Supplementary Table S4), i.e. metabolites that were sig-           pression of 25 381 grapevine genes (84.7% of total anno-
nificantly increased (response ratio ≥1.5 and P≤0.05) or de-                tated genes) across all berry samples; 4275 genes (14.6%)
tected only in infected berries. These metabolites included                 were identified as differentially expressed due to infection
fatty acids (eicosanoic, docosanoic, and tetracosanoic acids),              (1472) and/or véraison-responsive (3385) (Supplementary
fatty alcohols (eicosan-1-ol, docosan-1-ol, and octadecan-                  Table S5; Supplementary Fig. S3). DEGs were identified
1-ol), lipids (α-tocopherol), phenylpropanoids (resveratrol                 using edgeR with a TMM normalization factor close to 1
and catechins), phenolic acids (gallic acid), sugar conjugates              (Supplementary Table S2). A multidimensional scaling plot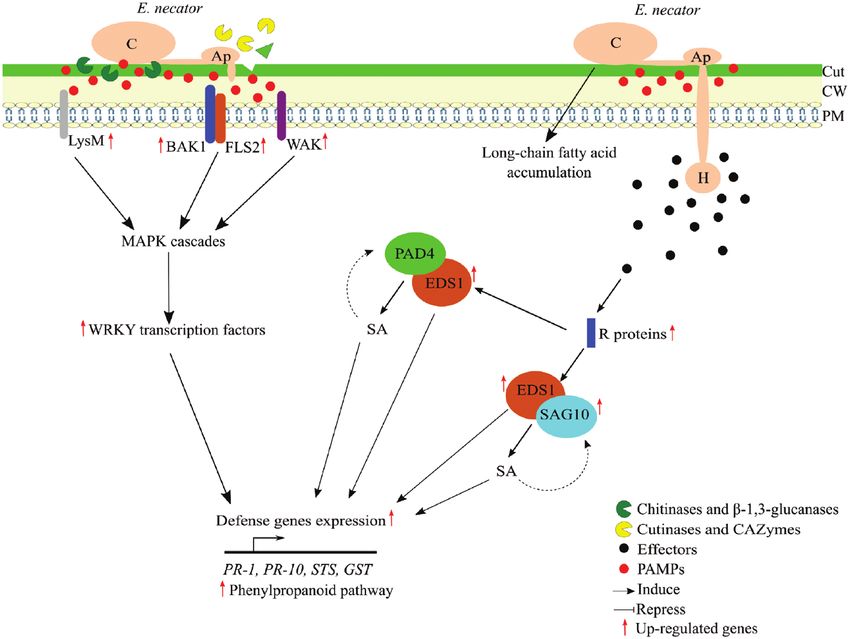
Metabolism of grapes infected with powdery mildew | 6549

                                                                                                                                                            Downloaded from https://academic.oup.com/jxb/article/72/18/6544/6295384 by Max-Planck-Institute for Biogeochemistry user on 13 October 2021
Fig. 2. Phenotypic and metabolic characterization of powdery mildew-infected (PM) and control grape berries at developmental stages EL33 (green) and
EL35 (véraison): berry weight, anthocyanin content (absorbance at 520 nm g–1 of freeze-dried material), and relative quantification of glucose, fructose,
tartaric acid, and malic acid (Supplementary Table S4). Bars and whiskers represent means and standard deviation (SD). Significance (P-value) of
indicated pairwise comparisons was assessed by Student’s t-test: *P≤0.05, **P≤0.01, ***P≤0.001.

showed good separation among control and infected berries                        Genes that were up-regulated in infected berries at
and developmental stages (Supplementary Fig. S4). RNA-                        both stages (Fig. 5) are mainly related to signaling path-
seq data also supported the absence of E. necator infection                   ways and protein kinases, secondary metabolism (including
in control samples, shown by the residual number of reads                     phenylpropanoids, stilbenoids, and lignin biosynthesis),
mapped into the E. necator C-strain scaffolds (Supplementary                  stress response (biotic stress response, plant–pathogen inter-
Table S2). Additionally, these RNA-seq data were validated                    action, oxidative stress), hormone signaling (in particular
by real-time PCR analysis (Supplementary Figs S5, S6).                        salicylic acid signaling), nitrogen metabolism, phytoalexin
                                                                              biosynthesis, NBS-LRR superfamily, and WRKY tran-
Functional enrichment analysis                                                scription factor family. Activation of secondary metabolism
                                                                              and defense/stress responses was also observed in V. vinifera
Functional enrichment analysis of up- and down-regulated                      leaves infected with E. necator (Fung et al., 2008; Fekete
transcripts was performed (Fig. 5; Supplementary Table S6)                    et al., 2009).
based on functional categories defined by Grimplet et al. (2012);                Functional categories enriched as up-regulated only at the
two comparisons were considered: transcriptional changes be-                  EL33 stage included genes involved in transport and sec-
tween control and infected berries (Fig. 5) and during ripening               ondary metabolism (aromatic compound glycosylation, fla-
(EL35 compared with EL33; Supplementary Fig. S7).                             vonoid, and isoflavonoid biosynthesis). They also included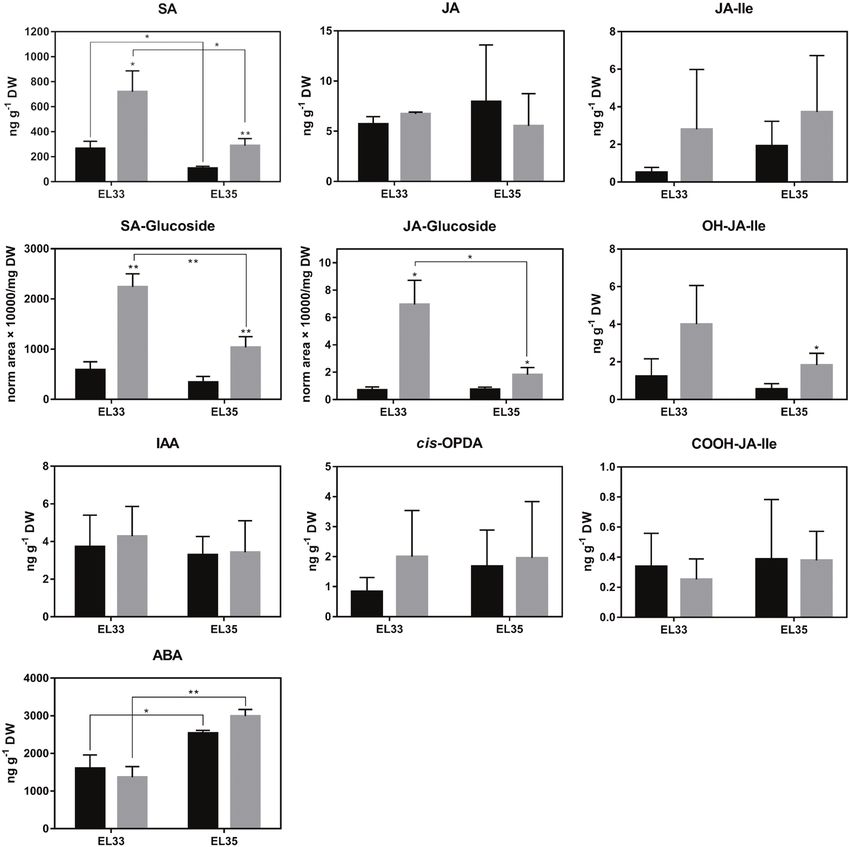
6550 | Pimentel et al.

                                                                                                                                                             Downloaded from https://academic.oup.com/jxb/article/72/18/6544/6295384 by Max-Planck-Institute for Biogeochemistry user on 13 October 2021
Fig. 3. Metabolic analysis of infection- and véraison-responsive metabolites from powdery mildew-infected and control berries at the green (EL33)
and véraison (EL35) developmental stages. Metabolites that were significantly increased or decreased in at least one of the pairwise comparisons with
response ratio ≥1.5 and P≤0.05 (statistical tests and analyses of variation in Supplementary Table S4) are presented by a heatmap. Metabolites present
only in infected berries were not included. Response ratios were log2-transformed (see scale) and hierarchically clustered using Euclidean distance and
complete linkage. Asterisks indicate statistical significance (Student’s t-test: *P≤0.05, **P≤0.01, ***P≤0.001). Square brackets indicate metabolites that
were identified only by mass spectral match. MTS, mass spectral tag.

genes belonging to MYB transcription factor family, ABA-                       P450 oxidoreductase), and carbohydrate metabolism (Fig. 5;
mediated and brassinosteroid-mediated signaling (Fig. 5;                       Supplementary Table S6). Moreover, no functional category
Supplementary Table S6). Additionally, aromatic amino acid                     was enriched at the véraison stage since only 28 genes were
metabolism (phenylalanine and tyrosine biosynthesis), lipid                    down-regulated (Fig. 5; Supplementary Tables S5, S6).
metabolism (glycerolipid catabolism), and subtilase-mediated
proteolysis were categories enriched only at the EL35 stage                    Modulation of genes involved in biotic stress
(Fig. 5; Supplementary Table S6).                                              responses indicates an activation of defensive
  At the green stage, very few categories were enriched as                     signaling events in non-ripe infected fruits
down-regulated (116 genes; Supplementary Table S5); they
were associated with cell growth, cell wall organization and                   Genes involved in biotic stress responses were vastly modu-
biogenesis (including cell wall metabolism, modification,                      lated in response to infection, namely genes encoding pro-
and pectin metabolism,), cellular metabolism (cytochrome                       tein and receptor-like kinases (Table 1; Supplementary Table
Metabolism of grapes infected with powdery mildew | 6551

                                                                                                                                                            Downloaded from https://academic.oup.com/jxb/article/72/18/6544/6295384 by Max-Planck-Institute for Biogeochemistry user on 13 October 2021
Fig. 4. Potential positive markers of powdery mildew infection of berries of V. vinifera cv. Carignan at EL33 and EL35 stages. Metabolites selected were
either significantly increased after infection at one or both developmental stages (response ratio ≥1.5 and P≤0.05, Student’s t-test) or only detected in
infected berries. The heatmap represents normalized responses in a two-color scale: low, light orange; high, dark red; grey boxes indicate non-detected
metabolites. MTS, mass spectral tag; VOC, volatile organic compounds.

S5). Several genes encoding PAMPs receptors were activated                       Myb and WRKY were the transcription factor gene families
in response to PM, including Wall-associated receptor kinase                   most responsive to PM infection (Table 1; Supplementary Table
(WAK), Brassinosteroid insensitive 1-associated receptor kinase 1              S5). Other transcription factor families with PM-responsive
(BAK1), Flagellin-sensitive 2 (FLS2), and the gene for chitin                  members, particularly at the green stage, were the Lateral Organ
elicitor-binding CEBIP LysM domain-containing (LysM                            Boundary (LOB) domain family and the zinc finger C3HC4
protein) (Table 1). Many genes belonging to the NBS-LRR                        family (Table 1; Supplementary Table S5). Several LOB domain
superfamily, and other R proteins were overexpressed in re-                    genes were previously associated with response to powdery
sponse to infection at both stages (Table 1; Supplementary                     mildew (Grimplet et al., 2017).
Table S5). Moreover, genes encoding Avr9/Cf-9-induced pro-                       Despite the substantial activation of genes involved in de-
teins were responsive to infection and were reported to regu-                  fense response, six Mildew Locus O (MLO) genes (susceptibility
late the hypersensitive response in grapevine leaves (Rowland                  genes, S-genes) were also up-regulated in infected berries at
et al., 2005; Toth et al., 2016). Genes encoding two mitogen-                  both stages (Table 1; Supplementary Table S5).
activated protein kinases (MAPKs), MAPKKK5 and MAP4K
α1, were induced in infected berries at the green stage (Table                 Genes involved in primary and secondary metabolisms
1; Supplementary Table S5).                                                    are extensively modulated upon infection
   Additionally, several other genes widely described as involved
in biotic stress responses were activated such as those coding                 Several genes involved in primary metabolism were responsive to
for PR-10, calmodulin-binding proteins, cyclic nucleotide-                     PM infection. Nitrogen metabolism (enriched as up-regulated
gated ion channel, and glutathione S-transferases (Table 1;                    at EL33) included genes coding for ammonium transporters
Supplementary Table S5).                                                       and copper amine oxidase (Table 1; Supplementary Table S5),
6552 | Pimentel et al.
Downloaded from https://academic.oup.com/jxb/article/72/18/6544/6295384 by Max-Planck-Institute for Biogeochemistry user on 13 October 2021
Fig. 5. Enriched functional subcategories (adjusted P≤0.05) in response to PM infection (infection vs control). Circle size represents the number of genes
(log10) for each functional subcategory. Complete dataset in Supplementary Table S6.
suggesting a modulation of host nitrogen transport and metab- between infected and control berries (Supplementary Fig.
olism that might eventually be induced by the fungus. S8) ultimately due to post-transcriptional regulation and/or
Although the carbohydrate metabolism category was specific dynamics of fluxes of phenylpropanoid metabolites.
enriched as down-regulated in green infected berries Flavonoid, hydroxycinnamate, and lignin biosynthetic path-
due to an over-representation of genes involved in cell ways were also stimulated in response to PM (Table 1; Fig. 6;
wall metabolism (Table 1; Supplementary Table S6), sev- Supplementary Table S5).
eral genes involved in sugar metabolism were up-regulated
and may play an important role in supplying energy and/ Modulation of genes involved in hormonal metabolism
or precursors for defensive mechanisms. These included highlights the central role of salicylic acid signaling in
genes related to glycolysis and gluconeogenesis, monosac- response to powdery mildew
charide metabolism, starch and sucrose metabolism, tre-
halose metabolism, and polyol and sugar transport (Table 1; The data indicated a strong reprogramming of hormonal me-
Supplementary Table S5). tabolism upon infection.
Moreover, genes encoding enzymes involved in fatty acid Regarding the salicylic acid (SA) pathway, an overexpression
biosynthesis, glycerophospholipids metabolism, and lipid trans- of the EDS1 and PR-1 genes was observed upon infection at
port were also responsive to infection (Table 1; Supplementary both stages (Table 1). SAMT and SAG101 genes involved in
Table S5), which is in accordance with the accumulation of SA metabolism (Feys et al., 2005) were also up-regulated (Table
fatty acids revealed in the metabolic profiling. 1; Supplementary Table S5).
Secondary metabolism was also extensively reprogrammed Concerning jasmonic acid (JA) metabolism, genes encoding
upon infection involving activation of phytoalexin and methyl jasmonate esterase, lipoxygenases (LOX), and an allene
phenylpropanoid metabolisms (Fig. 6). The activation of oxide synthase (AOS) were up-regulated in green infected
resveratrol synthesis in response to PM infection (Schnee et al., berries (Table 1; Supplementary Table S5). Additionally, one
2008) was supported by up-regulation of genes encoding gene belonging to the cytochrome P450 (CYP94) family was
stilbene synthases (Table 1; Fig. 6; Supplementary Table S5). modulated (Table 1). Members of the CYP94 family are in-
Reprogramming of the phenylpropanoid pathway was also ob- volved in the oxidation of the bioactive form of JA, jasmonoyl-
served in leaves of susceptible V. vinifera cv. Cabernet Sauvignon L-isoleucine (JA-Ile; Koo et al., 2011, 2014). Several members
(Fung et al.,2008) and involved up-regulation of genes coding for of the AP2 transcription factor family, including ethylene-
the enzyme PAL (Table 1; Fig. 6). Nevertheless, its total activity responsive factors (ERF) genes, were also activated in infected
and total phenolic content showed no significant differences berries (Table 1; Supplementary Table S5).Table 1. Selection of Vitis vinifera infection-responsive genes in powdery mildew (PM)-infected and control grape berries (fold-change considering an FDR of ≤0.05
and a fold change of ≥ 2 or ≤ –2)
Gene ID Fold-change Functional annotation Functional category
EL33 EL35 Control PM infected
(PM vs (PM vs (EL35 vs (EL35 vs
control) control) EL33) EL33)
Signaling (kinases, receptors)
VIT_19s0014g04060 18.6 5.2 ARK3 (arabidopsis receptor kinase 3) Protein kinase
VIT_16s0148g00100 86.0 16.5 Brassinosteroid insensitive 1-associated receptor PAMPs receptor
kinase 1
VIT_03s0038g03220 2.7 −3.2 Chitin elicitor-binding CEBIP LysM domain- PAMPs receptor
containing
VIT_04s0008g00330 45.6 7.5 Clavata1 receptor kinase (CLV1) PAMPs receptor
VIT_00s2485g00010 32.7 15.3 CRK10 (cysteine-rich RLK10) Protein kinase
VIT_14s0066g00760 11.8 6.7 Disease resistance protein (NBS-LRR class) NBS-LRR superfamily
VIT_07s0197g00130 2.8 Disease resistance protein (TIR-NBS-LRR class) NBS-LRR superfamily
VIT_16s0050g01980 5.5 6.6 EIX receptor 2 NBS-LRR superfamily
VIT_01s0010g00380 54.8 9.0 FLS2 (flagellin-sensitive 2) PAMPs receptor
VIT_09s0002g03010 47.3 11.8 −4.3 FRK1 (FLG22-induced receptor-like kinase 1) Protein kinase
VIT_00s0400g00020 4.0 4.7 HcrVf1 protein NBS-LRR superfamily
VIT_12s0035g00150 8.9 3.8 −2.1 Leucine-rich repeat receptor-like kinase Protein kinase
VIT_18s0001g13590 50.1 Leucine-rich repeat protein kinase Protein kinase
VIT_01s0127g00690 13.6 −8.8 MAP4K α1 MAPK cascade
VIT_18s0001g11240 3.4 MAPKKK5 (mitogen-activated protein kinase MAPK cascade
kinase kinase 5)
VIT_18s0089g00450 3.1 R protein L6 R protein
VIT_15s0024g00400 3.2 6.5 R protein MLA10 R protein
VIT_00s0226g00080 28.6 17.0 R protein PRF disease resistance protein R protein
VIT_00s0258g00130 60.4 14.5 Receptor kinase homolog LRK10 Protein kinase
VIT_16s0148g00370 191.3 127.2 Receptor serine/threonine kinase Protein kinase
VIT_10s0003g02010 57.3 RKF1 (receptor-like kinase in flowers 1) Protein kinase
VIT_19s0014g00810 6.7 5.5 −2.9 −3.6 RKF1 (receptor-like kinase in flowers 1) Protein kinase
VIT_19s0014g04080 16.1 165.6 Serine/threonine-protein kinase receptor ARK3 Protein kinase
VIT_12s0028g03520 79.0 39.1 S-receptor kinase Protein kinase
VIT_17s0000g04400 33.8 12.6 Wall-associated kinase 1 (WAK1) PAMPs receptor
Biotic stress response
VIT_12s0028g02280 4.7 −3.0 Calcium-dependent protein kinase 13 CPK13 Calcium sensors and signaling
VIT_14s0030g02150 477.5 135.5 −4.6 Calmodulin Calcium sensors and signaling
VIT_17s0000g03370 9.5 22.3 Calmodulin-binding protein Calcium sensors and signaling
VIT_06s0004g02670 2.7 Cyclic nucleotide-gated ion channel 15 Stress response
VIT_08s0040g01770 4.4 2.9 Cyclic nucleotide-gated ion channel 15 Stress response
VIT_08s0040g00920 130.2 34.1 −7.4 Glutathione S-transferase 25 GSTU7 Oxidative stress response
VIT_12s0035g02100 96.2 Glutathione S-transferase Z1 GSTZ1 Oxidative stress response
VIT_06s0004g03120 136.9 18.9 −4.8 MLO-like protein 3 Susceptibility
VIT_05s0077g01530 15.0 5.9 Pathogenesis protein 10 (Vitis vinifera) PR protein
Metabolism of grapes infected with powdery mildew | 6553
Downloaded from https://academic.oup.com/jxb/article/72/18/6544/6295384 by Max-Planck-Institute for Biogeochemistry user on 13 October 2021Table 1. Continued
Gene ID Fold-change Functional annotation Functional category
EL33 EL35 Control PM infected
(PM vs (PM vs (EL35 vs (EL35 vs
control) control) EL33) EL33)
VIT_08s0058g00990 17.5 15.9 −4.9 Peroxidase Oxidative stress response
VIT_14s0068g01920 14.1 Peroxidase Oxidative stress response
VIT_02s0025g04270 12.6 Thaumatin Stress response
6554 | Pimentel et al.
VIT_02s0025g04230 7.2 14.3 Thaumatin (Vitis vinifera) Stress response
Transcription factors
VIT_08s0056g01650 19.9 −15.8 Lateral organ boundaries domain protein 20 LBD transcription factor family
(LBD20)
VIT_16s0050g00050 130.6 Myb domain protein 18 MYB transcription factor family
VIT_19s0085g00050 27.5 14.8 Myb domain protein 58 MYB transcription factor family
VIT_00s1624g00010 51.9 −8.9 Myb family MYB transcription factor family
VIT_13s0067g01880 5.6 4.0 Other LOB domain-containing protein ASL5 LBD transcription factor family
VIT_13s0067g03130 12.0 4.2 WRKY DNA-binding protein 55 WRKY transcription factor family
VIT_08s0058g01390 13.4 11.1 WRKY DNA-binding protein 70 WRKY transcription factor family
VIT_14s0068g01770 66.3 WRKY DNA-binding protein 75 WRKY transcription factor family
VIT_07s0031g00380 95.0 −11.3 Zinc finger (C3HC4-type ring finger) Zinc finger C3HC4 transcription
factor family
VIT_12s0028g02530 17.3 8.4 Zinc finger (C3HC4-type ring finger) Zinc finger C3HC4 transcription
factor family
Cell wall metabolism
VIT_15s0046g01580 91.6 Acidic chitinase III Carbohydrate metabolism
VIT_15s0046g01570 2.8 −3.0 Acidic endochitinase (CHIB1) Carbohydrate metabolism
VIT_08s0007g06060 15.6 19.7 β-1,3-Glucanase β-1,3-Glucan catabolism
VIT_01s0137g00430 −3.1 3.2 Cellulase Cell wall organization and bio-
genesis
VIT_00s0531g00060 229.6 Cellulose synthase CSLE1 Cellulose biosynthesis
VIT_02s0025g01920 5.8 15.0 −5.5 −2.1 Cellulose synthase CSLG3 Cellulose biosynthesis
VIT_05s0094g00320 53.5 124.6 Chitinase, class IV (Vitis vinifera) Carbohydrate metabolism
VIT_00s2526g00010 7.8 4.3 Endo-1,4-β-glucanase korrigan (KOR) Cellulose catabolism
VIT_13s0067g02930 −9.1 15.4 Expansin (Vitis labrusca × Vitis vinifera) EXPA8 Cell growth
VIT_16s0039g00260 −8.6 5.2 Pectate lyase Pectin catabolism
VIT_16s0022g00940 −16.6 6.0 94.0 Pectinesterase PME3 Pectin modification
VIT_06s0061g00550 −17.2 62.4 Xyloglucan endotransglucosylase/hydrolase 32 Xyloglucan modification
Cuticle biosynthesis
VIT_04s0008g06000 −4.7 3.1 14.0 Ethylene-responsive transcription factor ERF003 ERF subfamily transcription
factor
VIT_05s0029g00480 −2.1 −2.8 Eceriferum 2 (CER2) Cuticle biosynthesis
VIT_09s0018g01360 2.9 Cuticle protein Cuticle biosynthesis
Nitrogen metabolism
VIT_08s0058g00140 31.6 5.8 −5.5 Ammonium transporter 2 Ammonium transport
VIT_08s0007g03240 4.4 −5.3 Carbonic anhydrase precursor Nitrogen metabolism
VIT_05s0020g03280 80.2 43.4 Copper amine oxidase Polyamine metabolism
Downloaded from https://academic.oup.com/jxb/article/72/18/6544/6295384 by Max-Planck-Institute for Biogeochemistry user on 13 October 2021Table 1. Continued
Gene ID Fold-change Functional annotation Functional category
EL33 EL35 Control PM infected
(PM vs (PM vs (EL35 vs (EL35 vs
control) control) EL33) EL33)
VIT_07s0005g00530 42.7 NADH glutamate synthase Glutamate metabolism
VIT_01s0127g00070 6.1 4.2 Nitrate transporter 2.5 Nitrate transport
VIT_03s0063g01250 3.2 Nodulin 1A, senescence-associated Nitrogen assimilation
VIT_08s0007g04860 3.3 −4.9 Nodulin family protein Nitrogen assimilation
VIT_13s0019g05070 30.4 11.5 Nodulin family protein Nitrogen assimilation
Carbohydrate metabolism
VIT_17s0000g05870 9.8 Aldose 1-epimerase protein Glycolysis/gluconeogenesis
VIT_03s0063g00400 2.0 α-Amylase/1,4-α-D-glucan glucanohydrolase Starch and sucrose metabolism
VIT_10s0071g01120 26.3 −42.0 α-Galactosidase Monosaccharide metabolism
VIT_02s0025g00180 3.0 −3.6 Bisphosphoglycerate mutase Glycolysis/gluconeogenesis
VIT_19s0015g01720 11.1 Fructose-bisphosphate aldolase, cytoplasmic Glycolysis/gluconeogenesis
isozyme 1
VIT_00s0895g00010 19.4 −3.2 Glucan-1,3-β-glucosidase Starch and sucrose metabolism
VIT_16s0013g01950 3.7 Hexose transporter (Vitis vinifera) Sugar transport
VIT_10s0003g03930 2.6 1.8 −1.9 −2.7 Inositol transporter 2 Polyol transport
VIT_15s0048g00640 407.6 −15.9 L-Lactate dehydrogenase Glycolysis/gluconeogenesis
VIT_04s0044g00210 162.4 14.6 Mannitol dehydrogenase Monosaccharide metabolism
VIT_03s0063g02250 5.1 2.6 −3.6 Polyol transporter 5 Polyol transport
VIT_12s0057g00130 64.7 −11.1 Sucrose synthase 2 Starch and sucrose metabolism
VIT_05s0020g03140 9.3 Sugar transporter 13 Sugar transport
VIT_01s0011g05960 2.1 Trehalose-phosphatase Trehalose metabolism
Lipid metabolism
VIT_18s0001g04750 48.5 −9.1 Acetylcholinesterase Glycerophospholipids metab-
olism
VIT_04s0079g00790 6.0 Acyl-CoA synthetases (acyl-activating enzyme 11) Fatty acid metabolism
VIT_07s0005g01760 12.7 Glycerol-3-phosphate acyltransferase 3 (AtGPAT3) Glycerophospholipids metab-
olism
VIT_14s0219g00280 3.7 −4.8 Glycerol-3-phosphate dehydrogenase (NAD+) Glycerophospholipids metab-
olism
VIT_12s0028g01180 32.8 5.7 Non-specific lipid-transfer protein Lipid transport
VIT_06s0004g01250 33.9 −9.3 Omega-6 fatty acid desaturase, endoplasmic re- Fatty acid metabolism
ticulum (FAD2)
VIT_14s0108g00520 452.4 519.9 Protease inhibitor/seed storage/lipid transfer pro- Lipid transport
tein (LTP)
VIT_12s0028g02000 2.4 −2.0 −3.1 Triacylglycerol lipase Glycerophospholipids metab-
olism
Secondary metabolism
VIT_03s0017g02110 4.3 6.5 −3.4 Anthocyanidin 3-O-glucosyltransferase Anthocyanin biosynthesis
VIT_09s0018g01190 8.2 6.5 −2.2 −2.8 Anthranilate N-benzoyltransferase Phytoalexin biosynthesis
VIT_10s0003g00900 3.2 −2.3 Anthranilate N-hydroxycinnamoyl/ Phytoalexin biosynthesis
benzoyltransferase
Metabolism of grapes infected with powdery mildew | 6555
Downloaded from https://academic.oup.com/jxb/article/72/18/6544/6295384 by Max-Planck-Institute for Biogeochemistry user on 13 October 2021Table 1. Continued
Gene ID Fold-change Functional annotation Functional category
EL33 EL35 Control PM infected
(PM vs (PM vs (EL35 vs (EL35 vs
control) control) EL33) EL33)
VIT_16s0098g00850 2.1 1.9 −1.8 −2.0 Caffeic acid O-methyltransferase Phenylpropanoid biosynthesis
VIT_03s0063g00140 10.4 11.6 −3.3 −2.9 Caffeoyl-CoA O-methyltransferase Phenylpropanoid biosynthesis
VIT_13s0067g03820 2.6 Chalcone-flavonone isomerase (chalcone isom- Flavonoid biosynthesis
6556 | Pimentel et al.
erase)
VIT_09s0070g00240 4.9 5.9 −2.9 −2.4 Cinnamoyl-CoA reductase Lignin biosynthesis
VIT_07s0031g01380 53.4 29.2 Ferulate 5-hydroxylase Phenylpropanoid biosynthesis
VIT_07s0031g01370 25.8 3.8 −5.4 Flavonoid 3-monooxygenase Flavonoid metabolism
VIT_13s0047g00210 3.7 3.2 Flavonol synthase Flavonoid metabolism
VIT_12s0028g01880 150.1 9.9 −9.8 Isoflavone methyltransferase/orcinol Flavonoid metabolism
O-methyltransferase 1 OOMT1
VIT_07s0031g03070 417.9 −18.4 Isoflavone reductase Flavonoid metabolism
VIT_08s0040g01710 7.8 9.0 −2.9 −2.6 Phenylalanine ammonia-lyase Phenylpropanoid biosynthesis
VIT_08s0058g00790 19.9 13.0 Secoisolariciresinol dehydrogenase Lignan biosynthesis
VIT_16s0100g01010 18.7 10.8 Stilbene synthase Stilbene biosynthesis
VIT_06s0004g08150 3.3 1.8 −2.4 trans-Cinnamate 4-monooxygenase Phenylpropanoid biosynthesis
VIT_05s0062g00350 56.5 UDP-glucose:flavonoid 7-O-glucosyltransferase Flavonoid biosynthesis
Hormonal metabolism
Salicylic and jasmonic acid
VIT_18s0001g11630 2.4 10.1 3.3 Allene oxide synthase Jasmonate metabolism
VIT_07s0141g00890 16.7 24.7 CYP94A1 Jasmonate metabolism
VIT_17s0000g07370 2.7 3.3 EDS1 (enhanced disease susceptibility 1) Salicylic acid-mediated signaling
VIT_17s0000g07420 6.4 −2.9 EDS1 (enhanced disease susceptibility 1) Salicylic acid-mediated signaling
VIT_06s0004g01500 45.7 Lipoxygenase (LOX2) Jasmonate metabolism
VIT_06s0004g01480 6.1 −4.5 Lipoxygenase LOX1 Jasmonate metabolism
VIT_00s0253g00170 33.9 Methyl jasmonate esterase Jasmonate metabolism
VIT_03s0088g00710 79.4 23.6 Pathogenesis-related protein 1 precursor (PRP 1) Salicylic acid-mediated signaling
VIT_01s0011g05920 4.7 S-Adenosyl-L-methionine:salicylic acid carboxyl Salicylic acid metabolism
methyltransferase
VIT_14s0066g01830 3.8 4.3 SAG101 (senescence-associated gene 101) Salicylic acid-mediated signaling
Auxin
VIT_13s0067g00330 3.8 AUX1 auxin influx carrier protein Auxin transport
VIT_12s0057g00420 6.7 6.0 Auxin-responsive protein AIR12 Auxin signaling
VIT_07s0005g04380 2.0 −2.4 IAA12 Auxin signaling
VIT_05s0094g01010 3.4 −3.3 Indole-3-acetate β-glucosyltransferase Auxin metabolism
VIT_19s0014g04690 3.6 Indole-3-acetic acid-amido synthetase Auxin metabolism
VIT_11s0052g00440 29.6 −33.2 PIN1 auxin transport protein Auxin transport
VIT_04s0008g02800 −17.0 12.5 241.7 SAUR_D Auxin signaling
VIT_04s0008g06350 59.2 TPR1 (topless-related 1) Auxin signaling
Downloaded from https://academic.oup.com/jxb/article/72/18/6544/6295384 by Max-Planck-Institute for Biogeochemistry user on 13 October 2021Metabolism of grapes infected with powdery mildew | 6557
Regarding auxins, the Topless-related 1 (TPR1) gene, in-
volved in gene repression, was up-regulated in green infected
berries, as well as genes coding for auxin transporters, namely
Functional category
PIN1 and AUX1, auxin-responsive proteins and genes involved
ABA biosynthesis in auxin metabolism (Table 1; Supplementary Table S5). IAA-
amido synthetases are involved in auxin homeostasis through
Downloaded from https://academic.oup.com/jxb/article/72/18/6544/6295384 by Max-Planck-Institute for Biogeochemistry user on 13 October 2021
ABA signaling
ABA signaling
ABA signaling
ABA signaling
amino acid conjugation (Wang and Fu, 2011). Two SAUR
genes were down-regulated in response to PM at the green
stage (Table 1; Supplementary Table S5). SA-mediated plant
immunity was found to up-regulate certain IAA-amido syn-
thase genes and down-regulate SAUR genes, as well as genes
from the Aux/IAA family (Wang et al., 2007).
Relative to ABA biosynthesis and signaling, genes encoding
Abscisic acid-insensitive protein 3 (ABI3)
9-cis-epoxycarotenoid dioxygenase, ABA insensitive, AWPM-
19-like proteins, ABA-responsive protein (HVA22c), and pro-
9-cis-Epoxycarotenoid dioxygenase
ABA-responsive protein (HVA22c)
tein phosphatase AHG1 were up-regulated in infected berries
mostly at the EL33 stage (Table 1; Supplementary Table S5).
Functional annotation
ABI5 (ABA insensitive 5)
Fungal metabolic program during infection putatively
involves secretion of effectors and carbohydrate-active
enzymes
AWPM-19
Raw data from RNA-seq was also aligned with the E. necator
C-strain genome (Jones et al., 2014) with 5089 (78.5%) of the
predicted transcripts detected across infected berries: 4945 at
EL33 and 4040 at EL35 (Supplementary Table S7). Several
PM infected
transcripts were detected only in one stage; however, when de-
(EL35 vs
tected at both developmental stages, no differential expression
EL33)
−11.5
was observed (Supplementary Table S7).
Effectors are secreted by plant pathogens during infection
(Ma and Guttman, 2008). Several putative effector genes were
expressed at both developmental stages, including those coding
(EL35 vs
Control
EL33)
for glucose-repressible alcohol dehydrogenase transcriptional
effectors, ribonuclease-like proteins, metallopeptidase RxLR
effector, and candidates for secreted effector proteins (CSEPs);
nevertheless, the majority of the effectors homologous to Avrk1
control)
(PM vs
and Avra10 (EKA)-like protein transcripts were detected at EL33
EL35
2.6
(Table 2; Supplementary Table S7). Putative effector transcripts
Fold-change
were also detected in leaves infected with PM (Jones et al., 2014).
Moreover, several genes encoding fungal carbohydrate-
control)
(PM vs
active enzymes (CAZymes), were detected in infected berries
EL33
129.3
2.1
22.7
8.5
Complete dataset in Supplementary Table S5.
at both green and véraison stages, including genes coding for
carbohydrate esterase, glycosyltransferases, glycoside hydrolases,
and carbohydrate-binding modules (Table 2; Supplementary
Table S7).
Moreover, genes involved in chitin biosynthesis, carbo-
hydrate uptake and metabolism, lipid and fatty acid metab-
VIT_02s0087g00910
VIT_01s0026g02190
VIT_06s0080g00340
VIT_07s0005g05400
VIT_14s0006g03250
olism and transport, nitrogen uptake, and cutin degradation
Table 1. Continued
Abscisic acid (ABA)
(cutinase) were also expressed at both developmental stages
(Table 2; Supplementary Table S7). Expression of genes re-
lated to amino acid and polyamine metabolism was also
detected. Polyamines have been involved in spore germin-
Gene ID
ation, appressorium formation and conidiation (Rocha and
Wilson, 2019).You can also read