TRANSFORMATIVE INVESTMENTS FOR ENERGY EFFICIENCY AND RENEWABLE ENERGY (TI4E)
←
→
Page content transcription
If your browser does not render page correctly, please read the page content below

TRANSFORMATIVE INVESTMENTS FOR ENERGY
 EFFICIENCY AND RENEWABLE ENERGY (TI4E)

    Mapping Brazil’s industrial energy efficiency market,
        opportunities, challenges, and assistance
    requirements to determine how best to unlock the
          existing industrial efficiency potential.

                        September 2017

                                                            0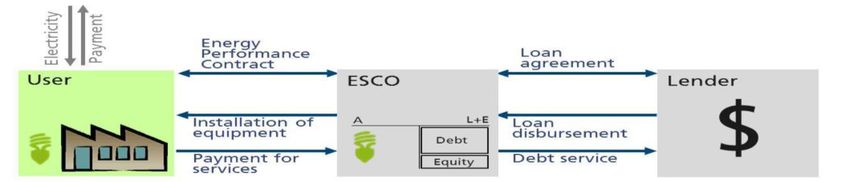
The Carbon Trust conducted this study on behalf of GIZ, based on an impartial analysis of primary and secondary
sources. The Carbon Trust’s mission is to accelerate the move to a sustainable, low carbon economy. We act as
a catalyst for governments, multilateral organisations, businesses, and the public sector in this transition. We
are independent, world leading experts on carbon reduction action, resource efficiency strategies, and
commercialising clean technologies. As a not-for-dividend group, we reinvest any profits into our mission.

GIZ offers customised solutions to complex challenges. An experienced service provider, it assists the German
Government in achieving its objectives in the field of international cooperation. GIZ offers demand-driven, tailor-
made and effective services for sustainable development. GIZ staff work in thematically diverse projects and
programmes in widely different countries throughout the world with a shared goal to develop sustainable and
effective solutions.

Authors:

Simon Retallack, Director for Latin America, Carbon Trust

João Lampreia, Senior Manager, Carbon Trust Brazil

Adriana Carvallo, Manager, Carbon Trust

Joshua Brunert, Associate, Carbon Trust

Paulo Miotto, Independent Consultant, Ecoeficiência Energia

                                                                                                                 1
CONTENTS

EXECUTIVE SUMMARY                                                                      3

INTRODUCTION & CONTEXT                                                                 4

BRAZIL’S ENERGY EFFICIENCY MARKET SIZE                                                 5

MARKET SURVEY OF THE ESCO SECTOR IN BRAZIL                                             7

 Characterization of Brazilian ESCOs                                                   8

 Characterization of Brazilian ESCOs’ pipeline of projects                             10

 Supporting policy and regulatory landscape for energy efficiency in Brazil            14

 Sources of finance available to ESCOs and energy efficiency projects in Brazil        15

 Existing technical assistance initiatives to promote energy efficiency                18

ASSISTANCE REQUIREMENTS TO UNLOCK BRAZIL’S EE MARKET                                   19

 Barriers and solutions to scaling up ESCO activities in Brazil                        20

ADDITIONALITY OF PROPOSED CONCEPT                                                      37

ANNEX I - SUPPORTING POLICY AND REGULATORY LANDSCAPE FOR ENERGY EFFICIENCY IN BRAZIL   42

ANNEX II – ALIANÇA PROGRAMME SUMMARY                                                   47

ANNEX III – OFF BALANCE SHEET INITIATIVE SUMMARY                                       48

REFERENCES                                                                             49

                                                                                       2
EXECUTIVE SUMMARY
The Transformative Investments for Energy Efficiency and Renewable Energy (TI4E) programme intends to
facilitate deals between potential investors and investment opportunities in industrial energy efficiency in
Brazil. This document is the first outcome of the GIZ & Carbon Trust partnership to design the T14E and
presents a market survey of ESCO-based energy efficiency opportunities in Brazil, along with a full
understanding of regulatory drivers, available financial mechanisms, existing technical assistance initiatives
and remaining barriers limiting the implementation of energy efficiency projects, leading to the identification
of interventions to unlock the ESCO-based energy efficiency market in Brazil.
Using official government projections, this report shows that energy efficiency is expected to play a significant
role in reducing Brazil’s energy demand, and industries can save ~8 Mtoe per year by 2024 through efficiency
interventions. A survey of the 80 members of Brazil’s ESCO Association (ABESCO) reveals that most have very
limited capacity to access finance and implement interventions on the basis of energy performance contracts,
and therefore have limited reach into industries. Most ABESCO members are in fact equipment installers,
maintenance providers, and suppliers with limited experience in energy performance contracting, which
thrive under the energy efficiency obligation scheme imposed over electricity distribution utilities (ANEEL’S
Energy Efficiency Programme) - a key driver of Brazil’s energy efficiency market.
An assessment of the ESCO project pipeline is performed on the basis of ABESCO members’ total reported
energy-efficiency-related revenue of R$ 1.1 billion/year, but the lack of underlying data and evidence limits
our capacity to assess the composition of such a pipeline. Using ANEEL’s PEE as a proxy, we note that the
ESCO pipeline is largely focused on electricity saving opportunities, leaving thermal savings largely
unaddressed. The pipeline can be refined by removing the bits which are not relevant for energy performance
contracts, decreasing the initial figure of R$ 1.1 billion down to R$ 530 million. Although a precise figure is
unknown, our assessment indicates that 2/3 of this is however composed of equipment supply and
maintenance, and hence not appropriate for energy performance contracts.
The attractiveness of this pipeline to foreign investors is therefore unclear, but evidence suggests that there
is a small number of projects with attractive rates of return and a low risk profile. Specifically, the pipeline is
concentrated in very few ESCOS (5-10) and limited in terms of the number of projects (likely 5-10 projects per
ESCO) and the size of such projects (R$ 1-5 million on average), with further analysis required to identify their
applicability for EPCs and their capacity to deliver high-IRRs.
An extensive mapping of supporting policy and regulatory drivers reveals that despite the number of
overarching plans that mention energy efficiency, and some direct action led by these, Brazilian policy does
not provide a significant push towards energy efficiency investments. Few government-led initiatives have
significant success, but leave a range of barriers unaddressed, in particular they lack a holistic approach to
build a pipeline of low risk projects and to connect these to finance sources. Sources of finance are also
plentiful, but have little demand for energy efficiency interventions, limited by a number of financial barriers
(that render products unattractive) and barriers that limit the formation of a pipeline in the first place.
Technical assistance is scarce on this market and disconnected from financial mechanisms.
Desk-research and interviews with representatives of 10 key players in the market reveals that a range of
barriers need to be addressed to unlock ESCO-based energy efficiency opportunities. Barriers are classified
as (i) customer-related - that weaken demand from end users for ESCOs’ services; (ii) ESCO-related - which
limit Brazilian ESCOs’ capacity to create a pipeline and service demand; and (iii) financier-related which hinder
the attractiveness of existing finance mechanisms and hence the creation and implementation of a pipeline.
Solutions to these barriers are summarized at the end of this report and are ranked on a scale of low, medium
and high priority in terms of their importance to unlock market opportunities, guiding the TI4E’s next steps.
3INTRODUCTION & CONTEXT
The Transformative Investments for Energy Efficiency and Renewable Energy (TI4E) programme intends to
facilitate deals between potential investors and investment opportunities in industrial energy efficiency in
Brazil to increase the volume of implemented projects. The TI4E is structured in three phases: (i) identification
of the most interesting ESCO projects; (ii) development of such projects and selection by an investment board;
and; (iii) a refinancing stage in which the programme attracts external investors to an investment debt pool.
The purpose of the TI4E is therefore to create a de-risking mechanism blending international climate finance
donor resources into a fund that attracts institutional investors into energy efficiency projects during stage
(iii). The underlying assumption is that a sufficiently deep pool of high quality energy efficiency projects with
high internal rates of return (IRR) currently exists in Brazil, and that the reason for the lack of implementation
of these projects is because there are no debt instruments available to finance the early preparation stages
of the projects. Relevant stakeholders, such as local ESCOs and technology suppliers also lack the technical
skills required to bring these projects up to investable standards.
It is suggested that a combination of early stage Technical Assistance (TA), particularly targeted at ESCOs, plus
the availability of debt from an Investment Debt Pool, would be sufficient to overcome these barriers and
deliver a pipeline of quality high-IRR energy efficiency projects. Once proven, the mechanism could achieve
considerable leverage of public resources by refinancing with funding from institutional investors, which
would be brought in as the senior debt tranche in a blended investment vehicle (possibly a Special Purpose
Vehicle or similar dedicated fund), with ESCOs acting as project developers and implementers.
GIZ and the Carbon Trust have joined forces to design the TI4E according to the needs of the Brazilian market,
with the intention to submit joint bids to international climate financiers, such as the International Climate
Initiative (IKI), the International Climate Fund (ICF) and the Green Climate Fund (GCF). This document is the
first outcome of this partnership and intends to deliver a market survey of ESCO-based energy efficiency
opportunities in Brazil, along with a full understanding of regulatory drivers, financial mechanisms existing
technical assistance initiatives and remaining barriers limiting the implementation of energy efficiency
projects, leading to the identification of Brazilian ESCOs’ technical assistance (TA) needs. It was delivered
through a combination of literature review, desk research and consultation with relevant stakeholders in
Brazil (including representatives of financial institutions, end-users, sample ESCOs and Brazil’s ESCO
Association - ABESCO).
The project team is composed of a mix of UK and Brazil-based experts with programme design experience
from the Carbon Trust, supported by a senior Brazilian expert from Ecoeficiência Energia.
This report is divided into four main sections:
(i) An evaluation of Brazil’s energy efficiency market size, including the value of this market between now
and 2024 and specific estimates of the energy efficiency potential which is attributable to ESCOs.
(ii) A market survey of the ESCO sector in Brazil, including: a survey of ESCO characteristics, according to
data provided by ABESCO; an identification and characterization of Brazilian ESCOs’ pipeline of projects,
with estimates on the share of this pipeline that is most likely to be delivered through Energy
Performance Contracts (EPCs); an evaluation of the relevant governmental plans, programmes and
regulation driving the development of Brazil’s energy efficiency market; a map of all relevant finance
mechanisms available to support energy efficiency in Brazil; and an evaluation of existing technical
assistance and awareness raising initiatives built to drive Brazil’s efficiency market.
(iii) An analysis of assistance requirements to unlock Brazil’s energy efficiency market, based on feedback
gathered through interviews to identify remaining barriers hindering the development of this market
and identify proposed solutions to each barrier.
4(iv) Concluding this report is an assessment of the additionality of the TI4E and next steps. This section looks
back into the initial assumptions to check how the analysis affects those, and concludes that the TI4E’s
support would be most additional if directed to solve barriers across the energy efficiency supply chain,
from customer-related barriers, to ESCO-related ones, through to financial-related barriers. Solutions
to these barriers are summarized and barriers are ranked on a scale of low, medium and high priority
in terms of their importance to unlock market opportunities, guiding the TI4E’s next steps.
BRAZIL’S ENERGY EFFICIENCY MARKET SIZE
Brazil’s latest 10-year energy plan, launched in 2015, foresees significant energy savings to be delivered in
multiple sectors by 2024, of which a significant share can be captured by ESCOs. Departing from a potentially
optimistic baseline energy consumption scenario1, in which the total energy demand rises from 247 Mtoe in
2015 to 350 Mtoe in 2017, the plan assumes 2.1% of the baseline can be saved by 2019 (6,045 ktoe) and 4.7%
by 2024 (16,573 ktoe), as illustrated in Figure 1.
Figure 1. Brazil’s total energy demand in baseline and efficient scenarios between 2015-2024 (ktoe)
360,000
Brazil's annual energy
340,000
demand (ktoe)
320,000 EFFICIENT SCENARIO
ENERGY
300,000 CONSUMPTION
280,000
BASELINE ENERGY
260,000
CONSUMPTION
240,000
220,000
200,000
2015 2016 2017 2018 2019 2020 2021 2022 2023 2024
Source: Derived from (EPE, 2015).
Focusing on the area in between the baseline and efficient scenarios, the bulk of energy savings are expected
to occur in the industrial and transport sectors. As a result, about two-thirds of the energy savings are
expected to come from increased fuel efficiency in both the industry and transport sectors, rather than
through reductions in electricity consumption, as illustrated in Figure 2. Nonetheless significant power saving
opportunities lie within the residential, industrial and service sectors, the latter including public sector saving
prospects.
Figure 2. Brazil’s fuel and electricity savings per sector 2015-2024 (ktoe)
18,000
16,000
energy savings (ktoe)
14,000 Agriculture & livestock (fuel)
Agriculture & livestock (electricity)
12,000 Residential (fuel)
10,000 Residential (electricity)
Services (fuel)
8,000 Services (electricity)
6,000 Transport (fuel)
4,000 Transport (electricity)
Industry (fuel)
2,000 Industry (electricity)
0
2015 2016 2017 2018 2019 2020 2021 2022 2023 2024
Source: Derived from (EPE, 2015). Note: Public sector savings are included within the services category.
1
Brazil’s 10-year energy plan (2015-2024) assumed average GDP growth of 1.8%/year in between 2015 and 2019; and
4.5%/year between 2020 and 2024; well above the -3.8% registered in 2015 and -3% registered in 2016.
5Despite the greatest opportunities lying with fuel efficiency, Brazil’s key energy efficiency programs are
primarily focused on electricity savings. For example, ANEEL’s Energy Efficiency Programme (PEE) is the
greatest source of energy efficiency finance and approximately 80% of its resources are dedicated to power
savings. The National Energy Conservation Programme (PROCEL) and the Brazilian Labelling Programme (PBE)
have focused their efforts almost entirely on defining minimum performance levels and labelling criteria for
appliances such as refrigerators, fans, lightbulbs, and air-conditioning systems. This suggests there is an
untapped potential in targeting fuel efficiency. Further details on these programmes and other national
initiatives are described further below.
In line with the 10-year energy plan, a yet-to-be-published study delivered by the World Bank and Brazil’s
National Confederation of Industries (CNI) shows that ~60% of the energy efficiency opportunities identified
within the 50 largest industries in Brazil are based on thermal efficiency. These projects are often more
complex to deliver, measure and verify, which makes it harder for the companies to opt for performance
contracts – even though thermal efficiency projects may have more attractive returns than the electricity
saving ones.
Analysing the potential savings described above in more detail, and assuming values in R$/ktoe for the cost
of fuel and electricity per sector (considering each sector’s average fuel mix), it is possible to estimate the
cost savings within the period per sector. Furthermore, assuming average lifetimes of energy saving measures
per sector and cost savings from avoiding new installed capacity, it is possible to estimate the size of the
market opportunity for energy efficiency per sector split across fuel and electricity savings, as illustrated in
Figure 3 below.
Figure 3. Brazil’s energy efficiency market is expected to grow on average by 14% per year between 2015 and 2024,
amounting to more than R$ 22 billion in 2024
25,000
size per year (R$ million)
Energy Efficiency market
20,000
15,000
14 %
10,000
5,000
0
2015 2018 2021 2024
Energy Efficiency market size for fuel savings Energy Efficiency market size for electricity savings
Source: Carbon Trust Analysis based on Brazil’s 10-year energy plan (EPE, 2015). Notes: Estimates represent the cost
savings from EE measures, but not of actual infrastructure investments. Assumes 2017 electricity and fuel price averages
throughout the period. Increasing the cost of fuels and electricity in time would lead to greater market sizes.
While on the one hand, the size of the opportunity described above can be said to be inflated by the optimistic
GDP growth scenario foreseen in Brazil’s 10-year energy plan, on the other hand, the estimated savings in
the plan are modest - a reduction in 4.7% of total energy demand by 2024 - and are thus below the technical
potential for energy savings in Brazil.
Not all the energy efficiency opportunities presented in Figure 2 can be captured by ESCOs in Brazil. For the
purpose of creating a realistic ESCO-related scenario derived from Figure 2, capture factors have been
assumed for electricity and fuel savings presented per sector in the 10-year energy plan. The result of this
exercise is shown in Figure 4 and reveals that ESCOs could realistically save 2,800 ktoe by 2024 (17% of the
16.6 ktoe savings foreseen in Brazil’s 10-year energy plan in that year).
Moreover, it becomes clear that ESCOs are more likely to capture electricity-related opportunities rather than
fuel-related ones – given power savings are the focus of Brazilian ESCOs’ business, as demonstrated by the
analysis further below. In the transport sector for example, ESCOs are unlikely to capture any fuel saving
6opportunities, as this refers to a modernization of the fleet which is not typically an area of ESCO focus. In
the industrial sector, where fuel savings can be the greatest, ESCOs are unlikely to capture most opportunities
because they have limited expertise and access to work within core industrial processes.
Figure 4. ESCOs can capture approximately 17% of the energy efficiency opportunity outlined in Brazil’s 10-year energy
plan, and are more likely to capture electricity-related opportunities.
3,000
Agriculture & livestock (fuel)
2,500
energy savings (ktoe)
Agriculture & livestock (electricity)
Residential (fuel)
2,000
Residential (electricity)
1,500 Services (fuel)
Services (electricity)
1,000 Transport (fuel)
Transport (electricity)
500 Industry (fuel)
Industry (electricity)
0
2015 2016 2017 2018 2019 2020 2021 2022 2023 2024
Source: Carbon Trust analysis. Notes: Capture factors for each sector’s electricity and fuel saving opportunities, and
respective assumptions are presented in the table below.
Sector Capture factor Rationale
Electric efficiency
Industry 50% • A large share of electric efficiency improvements in industries are bound to occur
with industrial modernization and without the support of ESCOs.
• ESCOs are well prepared to deliver electricity savings in industry.
Transport 10% • Very few Brazilian ESCOs claim to have the electric transport sector (e.g. trams and
subways) as a business focus.
• ESCOs have limited expertise in this domain.
Services 50% • ESCOs have the capacity and expertise to capture a large share of this opportunity.
Residential 10% • ESCOs have limited focus on the residential sector, which tends to become more
efficient on its own.
Agriculture 10% • ESCOs have limited focus on the agricultural sector, which tends to become more
efficient on its own.
Fuel efficiency
Industry 20% • ESCOs have limited expertise in fuel efficiency in core industrial processes and
industries are reticent to open such opportunities to ESCOs.
Transport 0% • Transport sector fuel efficiency is typically not an ESCO domain.
Services 0% • There are no fuel savings forecasted in this sector in the 10-year energy plan.
Residential 0% • There are no fuel savings forecasted in this sector in the 10-year energy plan.
Agriculture 10% • ESCOs have limited focus on the agricultural sector, which tends to drive efficiency
improvements on its own.
MARKET SURVEY OF THE ESCO SECTOR IN BRAZIL
This section presents a characterization of Brazil’s ESCO market, based on data collected by questionnaires
answered by the 80 active companies which form Brazil’s ESCO Association (ABESCO). It includes data on the
size of these organisations, their regional base, activity focus, business model, target audience and
accreditation.
It is important to note that the concept of Energy Service Companies (ESCOs) is not consistently defined
throughout the world, often leading to confusion. The main defining feature of an ESCO is its acceptance of
an element of risk related to the provision of energy services. In other words, ESCOs trade on the promise of
generating revenues through energy savings, generally using Energy Performance Contracts (EPCs) which split
savings into revenues for the ESCO’s own remuneration and savings to be kept by the end-user/client, as
illustrated in Figure 5. In Brazil, the term ESCO has been used to define companies conducting energy saving
assessments, implementing energy efficiency projects, or selling energy efficient equipment, regardless of
whether the ESCO’s revenue is directly linked to the performance of their products or services.
7Figure 5. Energy Performance Contract model
Source: Frankfurt School of Management, FS-UNEP Collaborating Centre for Climate & Sustainable Energy Finance
CHARACTERIZATION OF BRAZILIAN ESCOS
ABESCO subdivides its associates across annual revenue categories, and between ESCOs and suppliers. Figure
6 shows the number of ESCOs and suppliers by annual revenue, and reveals that most Brazilian ESCOs and
suppliers are small (BRL 3 million. Out of these, four are subsidiaries of electricity utility companies operating
in major capitals and regions with high energy consumption, as listed in Table 1. Three other independent
ESCOs are also within the highest revenue category, and again located in highly populated regions, namely:
3E Engenharia em Eficiência Energética (Sorocaba); Ação Engenharia e Instalações (São Paulo); and
Multiempreendimentos Engenharia Consultiva (Recife). Amongst the category of suppliers, there are only
three large companies: Siemens; Schneider Eletric; and WEG Equipamentos Elétricos – all of which operate
or distribute their products across Brazil.
Figure 6. Number of ESCOs per annual gross revenue category - according to ABESCO’s categories
50
43 ANNUAL GROSS REVENUE:
ESCO 1 < BRL 250k
40
Number of ABESCO members
ESCO 2 < BRL 500k
ESCO 3 < BRL 3.0 M
30 ESCO 4 > BRL 3.0 M
SUPPLIER 1 < 500k
20 SUPPLIER 2 < 3.0 M
10 SUPPLIER 3 > 3.0 M
7 7 8
10
2 3
0
ESCO 1 ESCO 2 ESCO 3 ESCO 4 SUPPLIER 1 SUPPLIER 2 SUPPLIER 3
Source: Carbon Trust analysis based on data from ABESCO’s questionnaire responses.
Table 1. Five large power utilities have ESCO subsidiaries which offer energy efficiency opportunities
Utility name Region of concession/operation Subsidiary ESCO
CPFL São Paulo CPFL Eficiência Energética S.A.
AES Eletropaulo São Paulo AES Ergos
CEMIG Belo Horizonte Efficientia S.A.
Light Rio de Janeiro Light ESCO
EDP São Paulo e Espírito Santo EDP-AP
Source: Carbon Trust analysis based on data from ABESCO’s questionnaire responses.
The geographical distribution of ABESCO’s members is shown in Figure 7, and unsurprisingly ESCOs and
suppliers are concentrated in the states with the highest economic activity and presence of energy intensive
sectors. More than half of ABESCO’s members are based in São Paulo, with a significant share of members
based in the states of Minas Gerais, Rio de Janeiro and Santa Catarina. A smaller number of ESCOs operate in
Southern states, Centre West, North and North-eastern states. Important energy consuming industrial
centres such as Salvador, Recife and Manaus, which have more than 600 medium and large industries in its
free trade zone, have very few ESCOs associated with ABESCO, which may be an additional barrier for
developing energy efficiency projects in such regions.
8Figure 7 also shows that 61% of ABESCO members do not hold the QualiESCO label, the only ESCO-specific
certification available in Brazil. This label was created by ABESCO in 2011 to build capacity across ESCOs, as
well as to assess and certify their technical capacity to deliver energy saving services and products. However,
the QualiESCO label provides limited commercial value to ESCOs, as it is not linked to any form of financial
incentives (e.g. certified ESCOs could be eligible for concessional loans). The main perceived value of the label
by ESCOS is that they can demonstrate to their clients that they have been through a certification process.
Figure 7. Number of ESCOs per state and number of ESCOs with QualiESCO certification.
MT, 1 PE, 1 DF, 1 CE, 1
PR, 2
RS, 3
PA, 3 31
SC, 6 RJ, 6 SP, 46
49 Certified
Non-
MG,
certified
10
Source: Carbon Trust analysis based on data from ABESCO’s questionnaire responses.
The core business of ABESCO’s members varies across a range of energy-related products and services to
end-users. Most ESCOs offer generalist EE-related services (including energy audits, project planning,
sourcing suppliers, implementing interventions and monitoring impacts). Only twelve Brazilian ESCOs deliver
EE projects along with project finance (primarily through EPCs), sixty-eight others provide multiple EE services
with no financial solutions, many of which are specialized in services for specific technology fields (e.g.
metering, maintenance and training services), or sell specific pieces of kit (e.g. automation equipment,
lighting, and solar PV systems). Figure 8 shows the ESCOs’ responses regarding their areas of expertise.
The limited number of ESCOs offering project finance suggests that only a small number of ESCOs are able to
take loans to cover upfront investment costs of energy efficiency projects. Behind this is a clear link between
the size of the ESCOs, their technical and financial structure, and their business model. The small number of
large ESCOs are subsidiaries of large power distribution companies (listed in Table 1), initially created to
comply with ANEEL’S PEE, which mandates utilities to invest 0.5% of their net operational income in energy
efficiency projects – according to law 9,991 of 2000. These companies have larger balance sheets and assets
that allow them to access low-cost funding if needed, and a robust technical structure to offer energy
performance contracts (EPCs) to the market. However, such ESCOs are allowed to offer EPCs using PEE
resources only within their parent utilities’ concession areas, which significantly limits their portfolio of
projects and consumer outreach.
Figure 8. Only twelve Brazilian ESCOs offer general EE project services along with financial solutions. A large number
of ABESCO members are suppliers or focused on specific technology areas and do not offer finance.
30
Number of ABESCO members
25
20
15
10
5
0
Source: Carbon Trust analysis based on data from ABESCO’s questionnaire responses.
9Given that only twelve ESCOs offer project finance solutions, it is Figure 9. Most ABESCO members do not
not surprising that 62% of ABESCO members do not rely on EPCs use energy performance contracts (EPCs).
to deliver their services, as shown in Figure 9. Thirty ABESCO
members indicated they use EPCs, suggesting that eighteen ESCOs
which do not offer project finance solutions are willing to take 30
performance risks, but are not taking loans themselves to offer 50 Use EPCs
full financial solutions2 - due to these being medium or small-sized Do not use
ESCOs with limited capacity to take and back-up loans. EPCs
Figure 10 shows that thirty Brazilian ESCOs are primarily focused
on the industrial sector, while twenty-eight are exploring Source: ABESCO’s questionnaire responses.
opportunities in all sectors. ESCOs targeting energy utilities focus
on the energy efficiency finance opportunity that arises from Brazil’s Electricity Regulator’s Energy Efficiency
Programme (ANEEL’s PEE). Under this obligation scheme, utilities open annual public tenders to finance
energy saving projects in their concession areas and select winning projects based on criteria established by
ANEEL. Several ESCOs have thrived from developing projects with end-users and submitting bids to secure
funding from the utilities under this scheme - a stable source of finance amounting to R$ 630 million in 2015,
which is evaluated in detail further below.
Figure 10. Most Brazilian ESCOs either target the industrial sector or are open to working in any sector.
Number of ABESCO members
40
30 28
30
20 14
10 7
1
0
Industrial All Energy utilities Commercial Building
Source: Carbon Trust analysis based on data from ABESCO’s questionnaire
CHARACTERIZATION OF BRAZILIAN ESCOS’ PIPELINE OF PROJECTS
This section estimates the size of the current pipeline, characterizes this pipeline (to the extent allowed by
the data available), and assesses how it compares to the ESCOs’ potential opportunity identified in Figure 4
by matching data obtained from the questionnaires filled-out by ABESCO members, to data gathered from
conversations with ABESCO, individual ESCOs and secondary research. The purpose of this section is to
understand whether this pipeline can, in principle, be sufficiently attractive for external investors.
VALUE AND CHARACTERIZATION OF THE ESCO PIPELINE – ESCO DEAL FLOW
The sum of all of ABESCO members’ reported gross revenues, according to their questionnaire responses,
amounts to R$ 1.1 billion per year. These revenues translate into 1,151 MWh/year in savings 3 (99 ktoe),
estimated by summing the savings from: (i) the share of such revenues originating from ANEEL’s PEE
programme (R$ 633 million in 2016), or 578,000 MWh saved in 2016 at a unit cost of R$ 1,094/MWh avoided
according to (ANEEL, 2015); and (ii) the share of revenues originating from privately funded projects (R$ 470
million in 2016), leading to 533,000 MWh saved in 2016 - assuming 20% lower unit costs for energy saved,
2Examples of such ESCOs are: Witzler; Union Rhac Tecnologia em Eficiência Energética; Qualilight Energia; P3
Engenharia Elétrica; KMR Energia e Meio Ambiente; Exper Soluções Luminotécnicas; Eficien Energia Comercial.
3
To translate ESCO revenues into MWh savings we assumed realistic values per MWh per sector, noting for example that
energy is cheaper for the industry than it is for street lighting.
10given large industrial and commercial clients pay less for electricity and fuels. Although it is not possible to
attribute these savings to specific sectors (given the limitations of existing data), this number can be
compared to the scenario of efficiency opportunities which can be realistically captured by ESCOs previously
estimated in Figure 4. In our theoretical scenario, ESCOs could potentially deliver 370 ktoe of savings in 2016
(of which 54% in electricity and 46% in thermal savings). This suggests that ESCOs are currently capturing 27%
of the theoretical potential.
The detailed breakdown of ESCOs’ gross revenues (in terms of project categories, technologies, or clients) is
not available within ABESCO or third party sources. To overcome this limitation, ANEEL’s PEE programme
statistics were used as a proxy to estimate the composition of the greater ESCO pipeline, given the
programme’s expenditures represent approximately 60% of this pipeline (R$ 633 million in 2016). In the
paragraphs below, a breakdown of the PEE stats is shown, leading to conclusions around the composition of
a revised ESCO pipeline.
An analysis of ANEEL’s PEE stats, reveals that 72% (R$ 456 M) of the programme’s budget is spent on low
income household projects (namely free distribution of lighting, water heating and refrigerators), and 18%
(R$ 112 M) on public sector projects (lighting and air-conditioning), as shown in Figure 11. In fact, until
recently, the regulation underpinning the PEE determined that at least 60% of the utilities’ PEE budget had
to be allocated to low income household projects of this kind. However, in late 2016, the law 13,280
superseded that mandate stating that up to 60% of the utilities’ PEE budget can be allocated to low income
household projects - allowing utilities to decrease this allocation and transfer it to other areas from 2017
onwards.
Crucially, public energy efficient lighting projects and low income household projects are not suitable for the
typical ESCO EPC contracting model. In fact, such projects are not executed by traditional ESCOs but rather
by technology suppliers within ABESCO, which offer common technology warranties instead of performance
contracts to public entities (in the case of public lighting) or to low income families (in the case of households).
Figure 11. Power utilities’ PEE budget is primarily directed to the public sector and to low income households
Source: ANEEL, 2016
A further analysis of PEE stats reveals that very few technologies are being incorporated into client facilities
and most focus on power savings, rather than thermal savings - a clear misalignment with the opportunity
that could be captured by ESCOs shown in Figure 4. ABESCO members are primarily providing efficient lighting
technologies for public buildings and streets, as well as efficient lighting and refrigerators to low income
households. Less than 20 ESCOs provide more advanced technology solutions (e.g. compressed air, heat
recovery, energy integration and combined heat and power to commercial and industrial end users) as shown
in Figure 12.
11Figure 12. ANEEL’s PEE project distribution per technology in 2016.
Source: ANEEL, 2016
The initial estimated pipeline of R$ 1.1 bn was hence adjusted to reflect two factors: (i) that annual ESCO
revenues are mostly composed of efficient lighting and refrigeration provided by technology suppliers rather
than ESCOs, within ANEEL’s PEE; and (ii) that a large share of ABESCO member revenues are actually
composed of equipment supply and maintenance (within and beyond ANEEL’s PEE). In this revision, we
assumed the non-PEE share of the pipeline follows the same technology breakdown than the PEE – due to a
lack data on this aspect and interviewee confirmations that the PEE’s technology focus is a good proxy. The
revised ESCO pipeline, therefore considers only the share of projects that may fit under typical ESCO energy
performance contracts and are hence most interesting from the perspective of external investors.
Figure 13. The revised ESCO pipeline has R$ 531 million/year
Source: Carbon Trust analysis based on data from ABESCO’s questionnaire responses and (ANEEL, 2015) Notes: The
breakdown of technologies is based on ANEEL’s PEE projects profile, with adjustments considering energy efficiency
projects database from (CNI, 2014).
12Having re-assessed gross ESCO revenues, to derive the share which is most relevant for ESCO-based
performance contracts, a new value of R$ 531 million/year is obtained - composed of the relevant4 share of
PEE projects and (R$ 64 million/year) plus the non-ANEEL-PEE share of the pipeline (R$ 467 million/year).
Such revenues translate into 590,000 MWh/year (51 ktoe), roughly equally divided across industrial and
commercial sectors. Comparing this figure to the efficiency opportunities which can be realistically captured
by ESCOs - shown in Figure 4 - ESCOs can be said to be capturing 14% of the market assigned to them in 2016.
Importantly, it is also clear that ESCOs are focused on electricity saving opportunities (largely driven by
ANEEL’s PEE) despite the largest opportunity highlighted in Figure 4 being related to industrial fuel efficiency.
Assuming the revised R$ 531 million/year ESCO pipeline is composed of projects with an average value of
R$ 2 million, there could be approximately 265 ESCO-based projects operating with energy performance
contracts in Brazil per year. The revised pipeline is dominated by Brazil’s few large ESCOs, with small ESCOs
being largely dependent on ANEEL’s PEE. Large ESCOs have solid assets and good access to finance, but the
extent to which these projects have been implemented with own finance from ESCOs or clients, or with
banking finance, is yet unknown - as noted above.
ESCO CLIENT BASE
A closer look into ESCO clients allows us to reflect on how these influence ESCOs’ capacity to take-up finance.
Extensive desk-research on more than half of ABESCO members’ websites reveals medium to large clients,
some of which are listed in Table 2 below, split between the industry and commercial sectors. Whilst these
should work in ESCOs’ favour in terms of proving their pipeline’s creditworthiness, the extent to which they
do so is unclear because whether such clients have been won under ANEEL’s PEE programme is so far
unknown. Moreover, it is unclear if the finance paying for projects beyond ANEEL’s PEE is coming from banks,
end-users’ own capital, or from ESCOs’ own capital. ESCOs’ capacity to take up finance to implement projects
beyond the PEE is certainly very limited, as explored in a subsequent section of this report.
Table 2. Examples of clients in ESCO’s pipeline
Industrial Commercial sectors
Large • Votorantim • Bradesco Bank
corporates • Thyssenkrupp • Honda
• Petrobras • Infraero
• Vale • Itau Bank
• Souza Cruz • Burger king
• Nestlé • Motorola
• Ambev • Pão de Açúcar
• Fiat • Banco do Brasil
• Phillips • Accor
• Natura • Band TV
Medium • Hidropan • Andrade & Canellas
companies • Brose • Albert Einstein Hospital
• Tecfil • Cinemark
• Boehringer • Anhanguera Schools
• Atlantica • JFK Shopping
• Sabesp • Ibirapuera Shopping
Source: Authors’ analysis based on desk-research on sample Brazilian ESCO websites 5
4
The full ANEEL PEE pipeline minus the public lighting and low income household shares – which are not relevant for
ESCO-based performance contracts.
5
http://www.acaoenge.com.br/clientes.htm; http://www.aesergos.com.br/Paginas/Default.aspx; http://acxxus.com.br/clientes.php;
http://www.animaprojetos.com.br/clientes.html;http://www.energias.com.br/;http://www.greenyellowbr.com/;
http://indecoweb.com.br/clientes/
13ATTRACTIVENESS TO EXTERNAL INVESTORS
The extent to which Brazil’s ESCO-based project pipeline is attractive to external investors is yet unclear, and
will require a further detailed assessment of the pipeline identified above. Three factors indicate that the
attractiveness will be limited at this point:
(i) The pipeline is concentrated in very few ESCOS (5-10) and limited in terms of the number of projects
(likely 5-10 projects per ESCO) and the size of such projects (R$ 1-5 million on average). Further analysis
is required to identify their applicability for EPCs and their capacity to deliver high-IRRs.
(ii) ESCOs have been limited in their interaction with the industrial sector, where major opportunities lie.
Brazil’s industrial sector is responsible for 33% of the country’s energy consumption, and the 50 largest
industrial companies account for 20% of Brazil’s national energy consumption. Brazil’s Association for
Energy-Intensive Consumers (ABRACE) indicates that less than 10% of its member companies have ever
developed projects with ESCOs. This low level of interaction between the industries and ESCOs indicates
that a large portion of the energy efficiency opportunities identified in Figure 4 is not availed by ESCOs,
despite there being a clear need for energy efficiency within the industry. Rather than calling on ESCOs,
the limited number of large companies deploying energy saving measures have resorted to their own
technology teams, or in some cases, to international services companies to deliver energy saving
interventions – such as Worley Parsons, Cofely and Shell Global Solutions.
(iii) Brazilian ESCOs lack thermal-saving-related expertise and the pipeline is focused primarily on power
saving opportunities, leaving thermal saving opportunities largely unaddressed.
Whilst these points suggest a limited attractiveness of the existing pipeline, they also suggest there is a major
business opportunity to further develop this market and generate investable projects. This opportunity lies
particularly on projects that provide services, methodologies and technology solutions to address thermal
efficiency within the industrial and commercial sectors - where there is little competition and a large
performance gap to be closed. The technical and financial needs to develop this pipeline are discussed in a
dedicated section further below.
In line with this conclusion, ABESCO has estimated that the ESCO market size could increase from R$ 1 billion
to R$ 4 billion per year if ESCOs could tap into the full industrial energy saving opportunities (ABESCO, 2015).
Converting this opportunity into real investments would, however, require significant efforts to develop
Brazilian ESCOs’ technical delivery capacity in this field - the topic of a dedicated section below. The
availability of local finance to cover the electric and thermal energy efficiency gap is also explored in a
dedicated subsection below.
SUPPORTING POLICY AND REGULATOR Y LANDSCAPE FOR ENERGY EFFICIENCY IN BRAZIL
The opportunity described above is relatively well known across government, financial institutions, large
corporates and sector associations. A complex policy and regulatory landscape exists to drive Brazil’s low
carbon development, including national plans, federal and state level regulation, financial incentives and
sector-focused plans. This section maps out this landscape, including all initiatives that directly or indirectly
drive the energy efficiency market in Brazil. These items are listed in below from broadest to narrowest scope
and are again listed and outlined in more detail in Annex 1.
14Table 3. Supporting policy and regulatory landscape for energy efficiency in Brazil
FEDERAL PLANS
• National Plan on Climate Change
• National Energy Efficiency Plan
• Plano Brasil Mais Produtivo
• Plano Inova
CROSS-SECTOR FEDERAL PROGRAMMES
• ANEEL’s Energy Efficiency Programme (PEE)
• Equipment Labelling Programme (PBE)
• National Programme for Electricity Conservation (PROCEL)
• National Programme for the Rational Use of Oil and Gas Products (CONPET)
• Urban Mobility Growth Acceleration Programme (PAC2 Mobilidade)
• Federal and state government’s Sustainable Purchase Programme
CROSS-SECTOR FEDERAL REGULATION
• Energy Efficiency Law
TRANSPORT SECTOR PLANS AND REGULATION
• National Plan for Logistics and Transport (PNLT)
• National Urban Mobility Plan (PNMU)
• Automotive Pollution Control Programme (PROCONVE)
• Inovar Auto
INDUSTRIAL SECTOR PLANS AND REGULATIONS
• Petrobras’ operational energy efficiency programme
BUILDINGS SECTOR PLANS AND REGULATIONS
• Building labelling for commercial, public and residential buildings
• Caixa Azul Label
Source: Carbon Trust analysis derived from multiple sources listed under each item’s description in Annex I.
SOURCES OF FINANCE AVAILABLE TO ESCOS AND ENERGY EFFICIENCY PROJECTS IN BRAZIL
At least 22 relevant financial mechanisms are available for energy efficiency in Brazil, from public and private
sources, covering all major sectors of economic activity (and hence energy efficiency opportunities), as shown
in Table 4 below. Finance originates from the following five main sources of capital: (i) Brazil’s Development
Bank (BNDES); (ii) federal commercial banks (Caixa Econômica Federal and Banco do Brasil); (iii) other
commercial banks; (iv) electricity distribution utilities operating under ANEEL’s PEE; and (v) other
international development banks, e.g. Inter-American Development Bank (IDB).
These credit lines disburse BRL billions each year but the precise figure directed towards actual energy
efficiency is not clear, as: (i) most finance mechanisms are not targeting energy efficiency, but general
‘modernization’ of sectors or end-user groups, which includes services, investments in increased production
capacity, new (not necessarily efficient) equipment, and renewable energy, e.g. BNDES’ FINAME credit line,
which disburses ~R$23bn/year; and (ii) financial institutions (especially private ones) do not publish their
independent disbursements for energy efficiency.
Despite the availability of approximately R$ 10 billion in finance, which can in theory fund energy efficiency
projects, Table 4 provides evidence that financial institutions have limited focus on capturing the energy
efficiency opportunity highlighted in Figure 2 and seldom account for energy efficiency finance achievements.
The barriers limiting energy efficiency finance from demand and supply sides are explored in the following
section.
15Table 4: At least 22 financial products were identified as being available to support energy efficiency investments in Brazil.
Credit line/ Total budget Yearly Loan size
Solely energy Route to Target Payback time limit Approx. Interest rate (per
program name available disbursement range
efficiency? recipient clients/sectors (years) year)
(R$ million) (R$ million/yr)
FINEM
>R$20M for companies: 9.1%-
13.5%
Undisclosed >R$5M >R$20M for local
Energy Efficiency Direct ESCOs, end-users, Public lighting: 15 y
~ R$500 Yes R$20M) or and utilities Other projects: 10 y
R$5MR$10M – 5.1% -15% (depending on
Industrial
~R$ 200 (equipment Industry R$1M – 20
Not available Yes commercialRenewable micro
Direct 7%-15% (depending on
Inova Energia Undisclosed No generation and
FINEP & BNDES (>R$20M) or commercial banks’ risk
R$ 1,200 automotive EE >R$1M 20 y
via commercial perception in case of indirect
Inova Industrial and R$ 500k
Desenvolve SP Linha verde Undisclosed R$ 30 No Direct Multiple sectors 10 y 12%-13%
R$100k
Crédito Verde Undisclosed Undisclosed No 4.5 y 1.3% -
transport R$400k 9-15% (depending on Caixa’s
Federal Proger Urbano with revenues
Undisclosed Undisclosed investment forEXISTING TECHNICAL ASSISTANCE INITIATIVES TO PROMOTE ENERGY EFFICIENCY
There are few technical assistance initiatives that work in tandem with the financial mechanisms outlined above
to encourage energy efficiency investments in Brazil. The exact amount of technical assistance available to
catalyse the market for energy efficiency in Brazil is unknown since the initiatives are decentralized, often
combined with broader programmes/budgets and there is limited or no data available on their expenditures and
performance. All major technical assistance initiatives identified to promote the energy efficiency market in
Brazil are listed in Table 5, including basic information on their focus, delivery agents and key activities.
Table 5: Multiple initiatives provide awareness raising and/or technical assistance on energy efficiency.
Name of Focus Target Implementin Funder Key activities
initiative municipality sector/ g partners
and state audience
Plano Brasil Country- Industrial SENAI & MDIC, ABDI, Advice package and face-to-
Mais wide SMEs SEBRAE PROCEL face technical support for
Produtivo industrial SMEs to render
their activities more efficient.
A particular emphasis is given
to SMEs in metal works,
clothing, shoes, furniture,
food and drink industries.
PROCEL sub- Country- Buildings, PROCEL and PROCEL PROCEL’s sub-programmes for
programmes wide industry, industries, commerce,
commerce, buildings, public sector and
public public lighting have delivered
sector, a range of publications on EE
public advice, funded energy audits
lighting in multiple sectors, and
directly financed the
enhancement of EE specialist
laboratories in a range of
universities.
CNI & SENAI Country- Industries SENAI CNI and CNI and SENAI have jointly
‘soft wide SEBRAE published a range of technical
support’ reports on EE opportunities,
delivered courses and
workshops to support
investments on EE in multiple
sectors. To some extent
(figures unknown) it has also
contributed with face-to-face
support for specific industries
over the past decades.
18Aliança Country- Energy- CNI; ABRACE; UK’s Foreign CNI’s most hands-on initiative,
Programme wide intensive and Commonwe the Aliança Programme has
industries independent alth office, spent ~R$ 1 million with
consultants CNI; contributions from CNI and
ABRACE; and the UK’s FCO to deliver energy
co-funding saving assessments in the
from facilities of two major
industrial industrial corporations (GM &
beneficiaries Clariant).
Having demonstrated the
potential to identify ‘low
hanging’ efficiency
opportunities, it expects to
move onto a scaled-up phase
in 2018, at the cost of R$ 9
million. CNI estimates the
delivery of a pipeline worth
R$ 1 billion in 2018.
Further detail on the Aliança
Programme is provided in
Annex II.
Off balance Country- Energy- CNI; ABRACE; World Bank; Since 2015, CNI has worked
sheet wide intensive and CNI; and with ABRACE and the World
financing industries independent ABRACE. Bank to develop an off-
initiative consultants balance sheet finance
mechanism to deliver energy
saving interventions in
energy-intensive industries.
Further detail on the Aliança
Programme is provided in
Annex III.
SEBRAE Country- SMEs in all SEBRAE SEBRAE Since its inception, SEBRAE
wide sectors provides advice to support
although SMEs in a range of sectors to
few state render their activities more
offices of productive and competitive,
SEBRAE run with EE being a key
independent component of its support.
programmes
Source: Carbon Trust research, adapted from: (PROCEL, 2017); (MDIC, 2017); (SENAI, 2017) and interview with representative
of CNI.
ASSISTANCE REQUIREMENTS TO UNLOCK BRAZIL’S EE MARKET
Despite the existence of numerous regulatory drivers, finance mechanisms and technical assistance initiatives,
most of Brazil’s energy efficiency opportunity is yet to be realised. This section seeks to define how the TI4E can
best use donor funds to unlock opportunities in Brazil’s energy efficiency market. To do so, it looks through an
initial understanding of barriers restraining the market from the perspective of end-users, ESCOs and financiers.
These barriers, in addition to the analysis of the regulatory and financial landscape outlined above, were sense-
checked with 10 interviewees from relevant institutions composing Brazil’s energy efficiency market (including
the government, ABESCO, ESCOs, public and private financiers and an expert consultancy). The interviews also
discussed in detail how best to overcome such barriers. In the process of doing so, the initial understanding of
19barriers was refined, leading to what is presented below, along with interviewees insights into how best to use
donor funds to deliver opportunities in Brazil’s energy efficiency market – i.e. the technical assistance
requirements to unlock this market.
BARRIERS AND SOLUTIONS TO SCALING UP ESCO A CTIVITIES IN BRAZIL
An array of barriers has so far limited the commercial exploitation of the energy efficiency opportunities in Brazil
and are outlined in this section. The initial insights used to build this section draw on the Carbon Trust and local
consultant’s expertise and engagements in Brazil for the past 4 years on the topic of energy efficiency, including
past interviews with the private sector, government, regulatory agencies, associations, public and private
financial institutions. These insights were tested and refined through ten interviews conducted with
representatives of key Brazilian institutions - as listed in Table 6 below. Interview transcripts are presented in
their entirety in Annex II.
Table 6. Summary of interviews.
Institution Type of Organization Name of Position
interviewee
Ministry of Mines and Energy Federal Government George Soares EE Coordinator
ABESCO Association Marcelo Sigoli Technical Director
Desenvolve SP Financial institution Alvaro Sedlaceck Financial Director
Santander Financial institution Jorge Ball Asset Based Finance
Atla Consultoria Financial consultancy Alvaro Silveira Partner
Ação Engenharia ESCO 4 José Starosta Director of Engineering
Power Energia e Sustentabilidade ESCO 3 Pedro Brunoro Partner
INDECO ESCO 1 Otavio Santoro Partner
CPFL Eficiência Energética ESCO 4 Rodrigo Guedes Comercial Manager
Vitalux-ECO ESCO 4 Eduardo Moreno Partner
Notes: ESCO categories defined on the basis of annual gross revenues declared to ABESCO as: ESCO 1• Lack of regulatory drivers and political instability limits end-users’ willingness to invest.
ESCO-related barriers
• Lack of accepted contractual risk allocation framework, hindering project ‘finance-ability’.
• Limited technical expertise to identify opportunities (primarily thermal efficiency ones) and limited
access to end-user facilities, across the majority of ESCOs.
• Lack of administrative and financial capacity to adequately fulfil financiers’ basic requirements and
make compelling investment cases, across the majority of ESCOs.
• SMEs (including most ESCOs) struggle to provide the required collateral to secure loans, limiting their
interest in most finance mechanisms.
• Existing regulation limits ESCOs’ capacity to deliver public-private partnerships, within or outside
ANEEL’s PEE.
Financier-related barriers
• Small projects increase transaction costs; leading financial institutions to increase interest rates, or
simply to reduce their interest in energy efficiency loans.
• Bureaucracy, associated with obtaining subsidized financial mechanisms.
• High risk perception of financial institutions, leading to higher cost of finance.
• Intrinsic difficulties in settling potential disputes, leading financial institutions to demand marketable
asset collateral for each loan.
Source: Carbon Trust analysis gathered from interviews outlined above.
These barriers are elaborated on below, along with interviewees’ views on solutions to them. Crucially, they
demonstrate that enabling the ESCO-related energy efficiency opportunity in Brazil requires a solution that goes
beyond supporting ESCOs themselves, and includes: (i) supporting the creation of a pipeline across consumers;
(ii) supporting ESCOs’ to build a better pipeline and enhance their capacity to offer more attractive solutions to
end-users and financial institutions; and (iii) supporting financial institutions to render their products more
attractive to ESCOs and a range of end-users.
CUSTOMER-RELATED BARRIERS WEAKENING THE DEMAND FOR ESCO SERVICES
Lack of awareness of the commercial benefits of energy -efficiency, best practice and available
finance
Lack of awareness about energy efficiency is often identified as a common barrier in the literature and in all of
the stakeholder interviews, and its effects span across both the demand and supply of finance. From the
perspective of end-users, not knowing how energy efficiency can increase productivity and revenues, or the
means through which to finance and implement energy saving interventions leads to lack of demand for energy
efficiency products and services.
In Brazil, a range of awareness raising campaigns have been carried out to highlight the potential and benefits
of energy efficiency in multiple sectors – usually targeting end-users. These have been primarily led by PROCEL,
CNI, SENAI and SEBRAE and to some extent by local industry federations, governmental arms and private sector
associations in multiple sectors, all of which have had limited results 6 in terms of unlocking a widespread existing
potential. Few or no initiatives have sought to raise awareness across banks, other than BNDES and the Business
6
A detailed analysis of the results achieved by existing awareness raising initiatives is not included in this report due to its
scope limitation. Stakeholders unanimously point to the fact that such initiatives have not unlocked the widespread adoption
of Brazil’s energy efficiency potential.
21You can also read