Transforming the EU power sector: avoiding a carbon lock-in - EEA Report No 22/2016
←
→
Page content transcription
If your browser does not render page correctly, please read the page content below

EEA Report    No 22/2016

Transforming the EU power sector:
         avoiding a carbon lock-in

                                  ISSN 1977-8449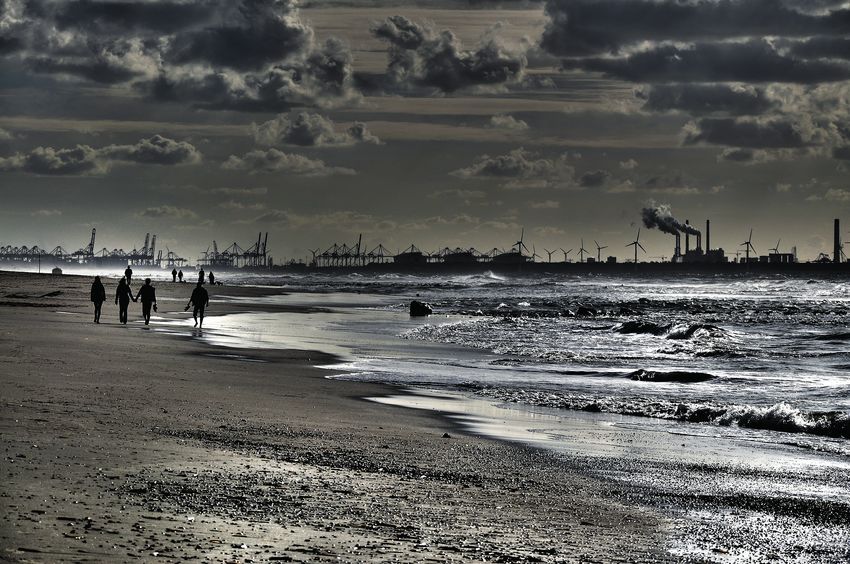
EEA Report   No 22/2016

Transforming the EU power sector:
         avoiding a carbon lock-in
Cover design: EEA
Cover photo: © asafta (www.istockphoto.com)
Small photo left: © Andrzej Bochenski, ImaginAIR/EEA
Small photo right: © Marco Veneziani
Layout: Pia Schmidt

Legal notice
The contents of this publication do not necessarily reflect the official opinions of the European Commission or other
institutions of the European Union. Neither the European Environment Agency nor any person or company acting on
behalf of the Agency is responsible for the use that may be made of the information contained in this report.

Copyright notice
© European Environment Agency, 2016
Reproduction is authorised provided the source is acknowledged.

More information on the European Union is available on the Internet (http://europa.eu).

Luxembourg: Publications Office of the European Union, 2016

ISBN 978-92-9213-809-7
ISSN 1977-8449
doi:10.2800/692089

European Environment Agency
Kongens Nytorv 6
1050 Copenhagen K
Denmark

Tel.: +45 33 36 71 00
Web: eea.europa.eu
Enquiries: eea.europa.eu/enquiries
Contents

Contents

Glossary......................................................................................................................................... 4

Acknowledgements..................................................................................................................... 6

Executive summary..................................................................................................................... 7

1 Introduction.......................................................................................................................... 17
     1.1 Background............................................................................................................................. 17
     1.2 Purpose................................................................................................................................... 19
     1.3 Assessment framework.........................................................................................................19
     1.4 Report structure..................................................................................................................... 25

2 Current sectoral profile....................................................................................................... 26
     2.1 EU profile................................................................................................................................. 26
     2.2 Regional profiles.....................................................................................................................28
     2.3 Ownership profiles.................................................................................................................32
     2.4 Comparison of current sectoral profiles with the Energy Roadmap levels....................34

3 Hypothetical pathways........................................................................................................ 41
     3.1 Revised decommissioning path reflecting potential need for upgrading
         to meet IED emissions requirements .................................................................................42
     3.2 Hypothetical decommissioning pathways..........................................................................46

4 A comparison of the bottom‑up profiles with key Energy Roadmap 2050 scenarios......56
     4.1 Evolution of the fossil fuel power sector ............................................................................56
     4.2 Risk of carbon lock-in and stranded assets........................................................................61
     4.3 Assessment of fossil fuel carbon intensities.......................................................................66
     4.4 Conclusions.............................................................................................................................68

References.................................................................................................................................. 69

Annex 1	Sensitivity analysis.................................................................................................. 71

                                                        Transforming the EU power sector: avoiding a carbon lock-in                                       3
Glossary

    Glossary

    AVG                   Illustrative sectoral profile obtained from the bottom‑up assessment, assuming medium-term
                          capacity lifetimes

    BFG                   Blast furnace gas

    CCS                   Carbon capture and storage

    CEE                   Central-eastern Europe

    CI                    Carbon intensity: the average rate of emission of a given pollutant from a given source relative to
                          the intensity of a specific activity; for example, grams of carbon dioxide released per megajoule of
                          energy produced, or the ratio of greenhouse gas emissions produced to gross domestic product.

    CON                   Units under construction

    CWE                   Central-western Europe

    DAC                   Units that have been deactivated or mothballed

    DEL                   Units that are delayed after the start of construction

    DG CLIMA              European Commission's Directorate-General for Climate Action

    DG ENER               European Commission's Directorate-General for Energy

    DG ENV                European Commission's Directorate-General for Environment

    DST                   Diversified supply technologies. One of the three scenarios from the Energy Roadmap 2050

    EEA                   European Environment Agency

    Eionet                The European Environment Information and Observation Network (Eionet) is a network of
                          environmental bodies and institutions in the EEA member countries

    ELV                   Emissions limit values set by the Industrial Emissions Directive (IED)

    Energy Roadmap 2050   The European Commission's Energy Roadmap, published in 2011, sets out routes to a more
                          sustainable, competitive and secure energy system in 2050. The current study uses three of its
                          scenarios (high energy efficiency, high renewable energy and diversified supply) as the top-down
                          scenarios for comparison with the bottom‑up assessment

    Energy transition     Long-term structural change towards a more sustainable energy system

    E-PRTR/EPRTR          European Pollutant Release and Transfer Register

    EU                    European Union
    EU-28                 The 28 Member States of the European Union
    EU-27                 The 27 Member States of the European Union prior to the accession of Croatia in 2013

    ETS                   The EU's Emissions Trading System. The EU ETS is one of the main measures introduced by the EU to
                          achieve cost-effective reductions in greenhouse gas (GHG) emissions and reach its targets under the
                          Kyoto Protocol and other commitments. ETS data are recorded in the European Union Transaction
                          Log (EUTL). This study used ETS data on carbon dioxide emissions from power plant units

    EUTL                  The European Union Transaction Log is an online registry that covers all 31 countries participating
                          in the EU ETS and that is operated by the European Commission. The EUTL holds accounts for
                          stationary installations (transferred from the national registries used before 2012) and for aircraft
                          operators (included in the EU ETS since January 2012)

    EXT                   Illustrative sectoral profile obtained from the bottom‑up assessment using currently expected,
                          longer (extended), capacity lifetimes

    GHG                   Greenhouse gas

4   Transforming the EU power sector: avoiding a carbon lock-in
Glossary

GWe/MWe/TWe          Gigawatt electric/megawatt electric/terawatt electric are the units used to measure the rated
                     electricity capacity of units

GWth                 Gigawatt thermal is the unit used to measure the thermal capacity of the input fuel used by units

EE                   High energy efficiency. One of the three scenarios from the Energy Roadmap 2050

RES                  High renewable energy sources. One of the three scenarios from the Energy Roadmap 2050

IED                  Industrial Emissions Directive (2010/75/EU)

Installed capacity   Capacity that is operational, deactivated, mothballed or delayed

IPCC                 Intergovernmental Panel on Climate Change. This study used IPCC emissions factors to estimate
                     energy output from carbon dioxide emissions.

LCP                  Large combustion plants with a rated thermal input equal to 50 MW or more, irrespective of the
                     type of fuel used (solid, liquid or gaseous) and falling under the scope of the Large Combustion Plant
                     Directive (2001/80/EC)

(LCP) Plant          The level at which emissions are reported under the LCP Directive. A power plant can consist of
                     several units

Lifetime             Lifetime designates the period from the commissioning of a certain asset (unit) until the end of the
                     life of that asset. Technical lifetime is defined as the total period of time during which a unit can
                     technically perform before it must be replaced or shut down. Expected lifetime is the period of time
                     during which a unit is expected to perform before it must be replaced or shut down, based on its
                     technical lifetime and anticipated actual operational lifetime

LNG                  Liquefied natural gas

Lock-in              The term lock-in describes a large (fossil fuel-based) technological overcapacity in the power sector,
                     compared with its optimal configuration. It conveys a certain risk of path dependency and inertia
                     in large fossil fuel-based energy systems that inhibit attempts to introduce alternative energy
                     technologies and energy efficiency measures designed to reduce GHG emissions. Specifically, in this
                     report, lock-in indicates the amount of fossil fuel capacity that exceeds the fossil fuel-based capacity
                     in the selected Energy Roadmap 2050 scenarios that are consistent with the EU's 2050 climate
                     objectives

MSR                  The market stability reserve (MSR) is a mechanism introduced under the broader EU ETS that aims
                     to increase the carbon market's resilience to sudden shocks by regulating the supply of emissions
                     permits in order to prevent extremes

NEB                  Northern Europe and the Baltic States (in this report the Baltic States are referred to as the Baltics)

NOX                  NOX is a generic term for the mono-nitrogen oxides NO (nitric oxide) and NO2 (nitrogen dioxide).
                     They are produced as a result of the reaction of nitrogen and oxygen gases in the air during
                     combustion, especially at high temperatures

OPR                  Units that are in commercial operation

PLN                  Units that are planned

Power sector         The industrial sector responsible for the generation of electric power for consumption by the general
                     public and industry

PPT                  Power Plants Tracker (database) — Enerdata

PRIMES               The PRIMES model is an agent-based and price-driven model of the energy system used to obtain
                     the projections for the Energy Roadmap 2050

REV                  Illustrative sectoral profile obtained from the bottom‑up assessment using extended capacity
                     lifetimes (EXT profile) and taking into account the need for potential upgrading to comply with the
                     IED (it includes the results of the EIONET consultation)

SOx                  Sulphur oxides refer to several sulphur- and oxygen-containing compounds

SSEE                 South and south-eastern Europe

Unit                 One boiler or turbine

UR                   Uranium

WEPP                 World Electric Power Plants Database, 2014 — Platts

WSTH                 Waste heat

                                             Transforming the EU power sector: avoiding a carbon lock-in                        5
Acknowledgements
Acknowledgements
This report was prepared by the European Environment EEA member countries and collaborating
Agency, with the support of a consortium led by countries
Trinomics and guided by a dedicated Advisory Group.
Alexandra Tsakiraki (Greece), Anne Jensen
The authors of the report were Mihai Tomescu, from the (Denmark), Artur Bobovnicky (Slovakia), Barbora
EEA, and Koen Rademaekers, Jessica Yearwood, Peter Cimbalnikova (Czech Republic), Charlotte Vanpoucke
Coenen and Stijn Dellaert, from Trinomics and TNO. (Belgium), Dag Henning (Sweden), David Pfeiffer
(Germany), Dília Jardim (Portugal), Ferenc Kulin
We are also grateful for the support received from (Hungary), Francesca Lena (Italy), Gabriella Kun
Antoon Visschedijk (TNO), Jeroen Kuenen (TNO), (Hungary), Iliuță Paraschiv (Romania), Irene Olivares
Nick Rothengatter (Trinomics) and Roel van der Veen Bendicho (Spain), Jože Roth (Slovenia), Kristiina
(Trinomics), who contributed to the implementation and Tammeraid (Estonia), Małgorzata Bednarek (Poland),
improvement of the assessment framework. Mark Nowakowski (Germany), Mart Raamat (Estonia),
Matthieu Lae (France), Nina Zovko (Croatia), Patrick
The EEA acknowledges the valuable comments and Geoghegan (Ireland), Paula Cristina Gomez (Portugal),
contributions received from the Advisory Group Radoslav Virgovič (Slovakia), Slavka Stroffekova
members Anita Matic (DG ENV), Daniel Martin‑Montalvo (Slovakia), Żaneta Woźniak (Poland).
Álvarez (EEA), Jan Nill (DG CLIMA), Joan Canton (DG ENER),
John van Aardenne (EEA), Lorenz Moosmann (UBA The project manager would like to thank Paul McAleavey,
Vienna), Rebecca Collyer (ECF) and Tomas Wyns (IES). Andreas Barkman, Spyridoula Ntemiri, Francois Dejean,
Martin Adams, Johannes Schilling, Eva Goossens, Andy
The EEA would also like to acknowledge and thank the Martin and Brendan Killeen from the EEA for their
following experts for having provided comments to the involvement in framing the report and improving its
draft report and to the consultation on large combustion messages.
plants facing investment needs for meeting stricter air
pollution limits:
European Commission and other
organisations
Hans Bergman (DG CLIMA), Joao Serrano-Gomes
(DG CLIMA), Filip Francois (DG ENV), Claire Dupont
(Vrije Universiteit Brussel), Ils Moorkens (European
Topic Centre for Air Pollution and Climate Change
Mitigation (ETC/ACM).
6 Transforming the EU power sector: avoiding a carbon lock-inExecutive summary
Executive summary
Europe and the global community are committed to a effects in the context of transition studies. With regard
low-carbon future, a goal to be reached by mid-century. to the energy system, lock-ins are usually understood
In 2009, the European Council set an objective to reduce as mechanisms inhibiting the diffusion and adoption of
EU-wide emissions of greenhouse gases (GHGs) to 80– carbon-saving technologies (Klitkou, 2015; Frantzeskaki
95 % of the 1990 levels by 2050 (European Council, 2009). and Loorbach, 2010; Unruh, 2000). Throughout this
report, the term 'lock-in' is used to refer to situations
The electricity generating sector is at the heart of where the amount of fossil fuel capacity could exceed
Europe's decarbonisation strategy and it is also the focus the levels that correspond to the EU's long-term
of this report. To date, power generation remains the decarbonisation objectives according to selected Energy
largest GHG-emitting sector in Europe, being responsible Roadmap 2050 scenarios.
for roughly one third of all energy-related GHG emissions
and more than half of the verified emissions under the By examining in detail the fuel type, status and age of the
EU Emissions Trading Scheme (ETS) (EEA, 2015a; IEA, existing and planned fossil fuel capacity and the potential
2015). lock-ins in the illustrative profiles, this report contributes
to a better understanding of the sector and provides
According to the European Commission's Energy useful information for investors and policymakers.
Roadmap 2050, by mid-century, the currently available
climate mitigation options can deliver a cost-effective The report also looks at the unintended consequences
decarbonisation of the power sector of 90–98 % of the Industrial Emissions Directive (IED) (1) on capacity
compared with 2005 (EC, 2011c). To reach this goal, lifetime. By doing so, it contributes to the evaluation of
however, a fundamental change in the composition climate and environmental policies and their interactions
of Europe's electricity sector will be needed. With and, in particular, to broadening our understanding of
fossil fuels still contributing to roughly half of the the coherence between climate and industrial emissions
electricity generated in Europe, moving away from a policies.
carbon‑intensive power supply over the next few decades
will require a commitment to increase investment in The report illustrates that, under certain assumptions
clean technology, restructure the fossil fuel energy (in particular regarding the longevity of installed
infrastructure and ensure a secure and affordable power capacity), the EU power sector could evolve towards
supply. excessive fossil fuel capacity by 2030, compared with
the optimal capacity levels in the Energy Roadmap 2050.
In this context, this report fills an important information The prolonged operation of inflexible, carbon‑intensive
gap by looking at: power plants, along with the planned construction of
new fossil fuel capacity, could translate into higher costs
• the theoretical evolution of fossil fuel capacity by 2030 for decarbonising Europe's power sector by locking it
in the absence of strong drivers to counter present in to a dependence on a high‑carbon capacity, while
trends; simultaneously exposing owners and shareholders to the
financial risk of capacity closures (potentially stranded
• how this hypothetical evolution would fit in with the assets). Within this context, one question is whether
need to create a qualitatively different EU power national initiatives that aim to increase the adequacy of
sector by 2030 and beyond, in line with EU climate domestic generation — currently under discussion in
goals. many Member States — could increase fossil fuel (and
in particular solid fuel) overcapacity and delay the
The concept of 'lock-in' has been extensively used to decommissioning of fossil fuel capacity across Europe
study the effects of path dependencies and reinforcing (see Box ES.1).
(1) EU, 2010, Directive 2010/75/EU of the European Parliament and of the Council of 24 November 2010 on industrial emissions (integrated
pollution prevention and control) (OJ L 334, 17.12.2010, pp. 17–119.
Transforming the EU power sector: avoiding a carbon lock-in 7Executive summary
Box ES.1 Main findings of this report:
• Much of the EU’s coal-based power capacity is near the end of its lifetime.
• One quarter of the new fossil fuel capacity in Europe could potentially come from coal.
• t present, operators tend to extend the lifetime of their fossil fuel capacity. If sustained, this would clash with the EU’s
A
decarbonisation efforts.
• odernising power plants to comply with the EU legislation on air pollutants would marginally affect the overall fossil
M
fuel capacity, but would slightly increase the excess solid fuel-fired capacity.
• Central and eastern Europe and south and south-eastern Europe are at a lower risk of solid fuel-fired capacity lock-in.
Drawing on this, the following policy considerations are made:
√√ A pan-European approach can provide least-cost opportunities for decarbonising the power sector.
√√ egular sharing of information regarding the evolution of fossil fuel capacity over the short- and medium-term can
R
improve the consistency of decarbonisation efforts.
√√ Increased alignment of energy, climate and environmental policies can speed up the transition to a secure and
sustainable EU power sector.
Approach with the EU's optimal decarbonisation scenarios for
the power sector, as described in the Energy Roadmap
The assessment framework is based on the World 2050.
Electric Power Plants (WEPP) database (Platts, 2014) and
other data sources linked to it, in particular the Large The hypothetical evolution of fossil fuel capacity up to
Combustion Plants (LCP) and the European Pollutant 2030 is calculated by extending the life of each power
Release and Transfer Register (LCP-EPRTR) datasets unit into the future, based on its year of commissioning
managed by the EEA and the European Commission (2), and the generic lifetime assumptions shown in
the European Union Transaction Log (EUTL) dataset Table ES.1. The latter were derived from the literature
under the ETS, and the Power Plant Tracker (PPT) and an assessment of the average age of retired units
database (Enerdata, 2015). The analysis consists of a and of the currently expected, longer (extended),
bottom‑up investigation of the current structure of the lifetime of units in the Platts and Enerdata databases.
EU power sector capacity above 200 MWe output — They also include an assessment (based on country
fossil fuel capacity by fuel type, age, GHG intensity and consultations) of the potential need for upgrading
expected lifetime — its potential evolution up to 2030 across the sector to comply with stricter air pollution
under current circumstances and how that compares limits under the IED. This is important because
Table ES.1 Lifetime assumptions implemented in the bottom‑up profiles
Lifetime assumptions Average Extended
Capacity by fuel type (used in AVG profile) (used in EXT and REV (a) profiles)
Coal 40 years 50 years
Gas 35 years 45 years
Oil 40 years 50 years
Note: ( ) In the REV profile, a 20-year lifetime starting with 2023 was implemented for that capacity for which a technical upgrade to comply
a
with the IED was assumed to take place.
(2) The LCP-EPRTR database contains data reported by EU Member States to the Commission under the European Pollutant Release and Transfer
Register (E-PRTR) Regulation and the Large Combustion Plants (LCP) Directive.
8 Transforming the EU power sector: avoiding a carbon lock-inExecutive summary
technological upgrades tend to extend the lifetime Europe, central-eastern Europe, northern Europe and
of capacity. Information on the planned expansion the Baltics, and south and south‑eastern Europe.
of capacity is taken from the Platts database. These
conditions led to three illustrative capacity profiles: Care is needed when interpreting the results. The
AVG, the bottom up profile considering historic average illustrative sector profiles should not be confused with
lifetimes. EXT, bottom-up profile considering extended model-based forecasting. They are constructed to reflect
lifetimes. REV, bottom-up profile considering potential credible lifetimes under prevailing market conditions.
upgrades/closures to comply with the requirements However, the report does not look at the potential
to reduce air pollutant emissions (including country interactions between the illustrative profiles and the
consultation results). implications of the ETS cap between 2020 and 2030 on
installed power generation capacity. Similarly, it does not
In this way calculated, the illustrative sector profiles are attempt to represent dynamically the evolution of other
compared with optimal power sector decarbonisation factors that influence the lifetime of individual fossil
scenarios in the Energy Roadmap 2050 impact fuel capacity in practice, such as international fossil fuel
assessment (EC, 2011c). An excess fossil fuel capacity prices, macro-economic conditions and electricity market
in the illustrative profiles indicates a risk of lock-in or of conditions (including national capacity mechanisms,
stranded assets. where they exist). Most information available for new
projects is for the five years after the release date (Platts,
The assessment results are calculated for the EU level. 2014), with data for the near-term being more reliable
The results are also grouped according to four generic than data for capacity expected to come online in later
country clusters, shown in Box ES.2: central-western years (see Box 1.5).
Photo: © Tamas Parkanyi, ImaginAIR/EEA
Transforming the EU power sector: avoiding a carbon lock-in 9Executive summary
Box ES.2 Regional aggregation and capacity data
Generic country clusters
Northen Europe Central-eastern
and the Baltics Europe
Denmark Bulgaria
Estonia Croatia
Finland Czech Republic
Ireland Hungary
Latvia Poland
Lithuania Romania
Sweden Slovakia
United Kingdom Slovenia
Central-western South and south-eastern
Europe Europe
Austria Cyprus
Belgium Greece
France Italy
Germany Malta
Luxembourg Portugal
Netherlands Spain
The regional aggregation in this study is illustrated above (for details, see Section 1.3.2, Scope and limitations).
Fossil fuel capacity across the EU‑28
47 %
COAL
Solid-fired
44 % capacity
GAS
END OF 2014 2015
Gas-fired
capacity
Installed fossil Units under
fuel capacity construction and
9% +
OIL 308 planned 15
GWe GWe
Liquids-fired
capacity
2015 BEYOND 2015
Expected Units under
2015 – capacity construction and
+
323 planned 88
GWe GWe
BEYOND 2015
Total
expected
capacity 411
GWe
Capacity assessed in this study: at the end of 2014, the EU's installed fossil fuel capacity ≥ 200 MWe equalled 308 GWe.
If units that were planned and under construction in 2015 are included (15 GWe), the expected 2015 capacity reaches
323 GWe. If new units planned beyond 2015 are also included (88 GWe), it increases to 411 GWe (the total expected
capacity, i.e. the maximum capacity assessed in this study, obtained when all units are summed, irrespective of their
commissioning date). Solid fuel- and gas‑fired capacity as proportions of total installed 2014 capacity are similar (47 % and
44 %, respectively), while the proportion of liquids-fired capacity is smaller (9 %).
10 Transforming the EU power sector: avoiding a carbon lock-inExecutive summary
Main findings fossil fuel capacity being decommissioned in 2015.
A decommissioning rate near this level was not
1. A large part of the EU's coal-based power capacity observed in practice. This implies that current fossil fuel
is near the end of its lifetime. From an assets units are already operating for longer than they used to
management perspective, this is an opportunity to in the past.
decarbonise the sector
4. A sustained tendency of operators to extend the
Almost three quarters of all solid fuel-fired capacity is lifetime of fossil fuel power plants would clash with
25–35 years old, or more. In contrast, gas‑fired capacity the EU's decarbonisation efforts
is considerably younger, almost four fifths of it having
been in place for 15 years or less. Oil-fired capacity Currently, the EU is progressing well towards its 2020
is relatively old, with four fifths of it having been climate and energy targets (EEA, 2015b). However, if
constructed before 1980 and almost all the remaining the existing and planned units operate in accordance
capacity having been commissioned before 1989. with extended lifetimes (EXT profile), this would result
in excess fossil fuel capacity in both 2020 and 2030
As natural gas‑fired capacity is generally half as carbon compared with the cost-effective capacity levels in the
intensive as coal-fired capacity and technologically Energy Roadmap 2050: by 48–51 GWe in 2020 and by
more suited to supporting the integration of variable 56–66 GWe in 2030 (roughly one fourth of the capacity
renewable energy sources into the electricity grid in the EXT profile would be in excess in 2030), as
because the output can be more easily varied, the age illustrated in Figures ES.1 and ES.4. Overcapacity would
profile of the EU's capacity presents an opportunity also arise if the existing and planned units operated
for decarbonisation when the sector is viewed from a in accordance with average lifetimes (AVG profile);
European perspective. however, in this case the cost-effective levels in the
Roadmap would be surpassed by much less in 2030
2. One quarter of the new fossil fuel capacity in Europe than they would be in the case of the extended
could come from coal lifetimes (EXT profile).
According to commercially available information (Platts, When assessing capacity by fuel type, in the bottom‑up
2014), across the EU there is a significant amount of assessment with extended lifetimes, solid fuel-fired
new fossil fuel-based capacity under way (88 GWe), capacity would be consistently higher than the capacity
either already under construction or planned. Gas in the Roadmap — with up to 30 GWe of potential
constitutes three quarters of the new fossil fuel-based stranded assets by 2030 under the revised (REV) profile.
capacity. Coal-based capacity (i.e. solid fuels) makes
up the remaining quarter, while oil‑based power Assuming that the extended capacity lifetimes become
generation will almost disappear when existing oil‑fired a reality, the risk of fossil fuel capacity lock-in, or of
units are decommissioned. stranded assets, would have emerged by 2020 in all
regions and would have grown further by 2030.
3. At present, operators tend to extend the lifetime of
their fossil fuel capacity Since the adoption of the Roadmap, the prospects
for developing carbon capture and storage (CCS)
The medium and old age of many of the fossil fuel units technologies by 2030 have declined significantly: to
assessed, and the fact that few new units were installed date, none of the 12 large-scale EU CCS demonstration
during the 1990s, indicates that the expected lifetime projects that were expected to be up and running by
of the operating units is increasing compared with 2015 is in place. Under these circumstances, not only
historically observed average lifetimes. would the projected CCS capacity levels in the Roadmap
be insufficient to tackle GHG emissions from excess
To obtain the hypothetical evolution of the fossil fuel fossil fuel capacity. In reality, the actual CCS capacity
power sector from a technical lifetime perspective, the levels are likely to be smaller too, due to the current
remaining lifetime of each operational and planned unit delays. That will have implications for the fossil fuel
was calculated. Two illustrative profiles were calculated capacity that can be fitted with CCS technology, while
based on the assumption of (1) a continuation of the converting some of that overcapacity to run on biomass
recent longer lifetimes (extended lifetimes — EXT could exacerbate the pressure on natural resources
profile), and (2) a return to historic average power plant and raise questions about sustainability.
lifetimes (AVG) (see Table ES.1 and note to Figure ES.1).
Assuming average capacity lifetimes, the old capacity,
Implementing the average lifetime values in the AVG constructed before 1980, would rapidly disappear as
profile, however, resulted in one third of all operational it reaches the end of its lifetime. Up to 2025, more old
Transforming the EU power sector: avoiding a carbon lock-in 11Executive summary
Figure ES.1 Illustrative sector capacity profiles and cost-effective capacity levels from the Energy
Roadmap 2050 scenarios
GWe
350
304
300 301 EXT: 23–28 % fossil overcapacity
AVG: 4–8 % fossil overcapacity
254
245 245 245
250 233
235
212 222
216 210
200 195 199
177 188
175
145
150 150
122
100
85
50
30
0
2014/2015 2020 2025 2030 2035 2040 2045 2050
EXT AVG
Roadmap capacity Roadmap capacity
(scope corrected, incl. CCS) without CSS
EXT & no New REV
Note: Note:EXT:
EXTthe
: thesectoral
sectoral profile based
profile based onon
thethe assumption
assumption of currently
of currently expected,
expected, longer (extended)
longer (extended) lifetimes,
lifetimes, derived derived
from the from the
increasingly longincreasingly
lifespans long
lifespans
observedosobserved so far in practice.
far in practice.
AVG:
AVGthe
: thesectoral profilebased
sectoral profile basedonon
thethe assumption
assumption of historic
of historic averageaverage
lifetimes.lifetimes. The implementation of average lifetime assumptions
in AVG leads to a significant rate of decommissioning already by 2015 (30 %) and t o the complete disappearance of capacity older
The implementation of average lifetime assumptions in AVG leads to a significant rate of decommissioning already by 2015 (30 %) and
than 35 years after 2020. Worth noting is that even the AVG profile ends up in 2030 with excess capacity due to planned new capacity
to the complete disappearance of capacity older than 35 years after 2020. Worth noting is that even the AVG profile ends up in 2030 with excess
additions.
capacity due to planned new capacity additions.
REV: the sectoral profile based on the assumption of extended lifetimes, but taking into account possible retrofits and closures due to
REV
the : the sectoral profile based on the assumption of extended lifetimes, but taking into account possible retrofits and closures due to the IED.
IED.
EXT
EXT &&nono New:the
New: theextended
extended lifetime
lifetimeprofile under
profile the assumption
under of no new
the assumption fossil
of no new capacity
fossiladditions
capacitypost 2015. post 2015.
additions
Source: EEA (based on EC, 2011c; Platts, 2014; the LCP-EPRTR and ETS databases and own calculations).
capacity would be decommissioned than new capacity The importance of the two illustrative profiles (EXT and
constructed. This would result in an initial sharp AVG) is twofold. On the one hand, they question the
decrease in fossil fuel capacity, followed by an increase consistency between plans to expand or retrofit fossil
in capacity after 2025 (see AVG profile in Figure ES.1), fuel capacity and national and EU-wide decarbonisation
as by then more new capacity would have been measures. On the other hand, they illustrate that it is
installed than old capacity decommissioned. By 2030, necessary to adopt a sector-wide perspective to ensure
the assumption of average lifetimes would lead too to rational decommissioning of fossil fuel capacity, in line
excess fossil fuel capacity (9 GWe). with the existing transformation goals for the sector.
12 Transforming the EU power sector: avoiding a carbon lock-inExecutive summary
5. Modernising power plants to comply with EU As both the EXT and the REV profiles result in
legislation on air pollutants would marginally affect considerable overcapacity compared with the
the overall fossil fuel capacity, but it would slightly Roadmap levels, a more detailed assessment was
increase the excess in solid fuel-fired capacity made of overcapacity by fuel type. It showed that by
2030 solid fuel- and gas‑fired capacity levels in the
Given the old age of many units in the power sector, EXT profile would be about 30 % greater than the
without further action, a relatively large noncompliance equivalent capacities in the Roadmap. In absolute
with the emission limit values (ELVs) for certain air terms, however, excess gas‑based capacity in the
pollutants set under the IED is to be expected. From EXT profile would be twice as high as the solid
the installed fossil fuel capacity, the EEA analysis of fuel‑fired overcapacity (see Table 4.2), a situation
the requirements for technological upgrading to meet deemed less problematic from a climate perspective
future ELVs set under the IED identified that about 37 % than if most overcapacity were to be solid fuel fired.
of the capacity (113 GWe — especially older coal plants) Oil‑based capacity levels would be lower than those
would exceed either the NOX (nitrogen oxides) or the in the Energy Roadmap 2050, because beyond 2015
SO2 (sulphur dioxide) ELVs, or both, based on the actual there are hardly any plans to construct new oil‑fired
emissions reported in 2012. capacity.
To ensure compliance with the strengthened ELVs, In the REV profile, a slight increase in the excess solid
operators will have to decide in these cases whether fuel-fired capacity would be observed in 2030 (36–38 %
or not to make further investments to upgrade their in excess of the cost-effective solid fuel capacity level).
current fossil fuel plants. If implemented, these This is due to technological upgrading to comply
upgrades could extend the technical lifetime of the with EU legislation on air pollutants and the 20-year
respective capacity. average lifetime extension associated with retrofits
(see Section 1.3.3, Lifetime assumptions).
To illustrate the potential consequences of these
decisions on the hypothetical evolution of the power 6. Central-eastern Europe and south and
sector, a revised sectoral lifetime (REV) profile was south‑eastern Europe are at a lower risk of solid
constructed using extended lifetime assumptions. This fuel-fired capacity lock-in
profile was based on the information available in the
context of the LCP and IED Directives and on additional The age of the assessed capacity differs considerably by
information received directly from Member States in region, with the oldest capacity located in central‑eastern
the context of this project (the European Environment Europe (CEE) and the newest found in south and
Information and Observation Network, or Eionet, south‑eastern Europe (SSEE) (Figure ES.2).
consultation). The resulting information suggests
that many of today's fossil fuel power plants will be Across all regions, plans for new fossil fuel capacity
upgraded technologically to comply with the IED, and after 2015 are similar, in the range of 20–23 GWe, as
thus they will continue to operate after 2020. shown in Figure ES.3. In absolute terms, the greatest
expansion in gas‑fired capacity would be in northern
Compared with the EXT profile, the REV profile would Europe and the Baltics (NEB) (23 GWe), which would
lead to an initial decrease in capacity by 2020, as some see almost no new solid fuel based capacity. The
existing capacity would be decommissioned. This would greatest expansion in solid fuel‑fired capacity is
then be followed by a small increase (+ 3 GWe) by 2030, planned in CEE (13 GWe).
due to technological upgrading to meet the IED ELVs (3).
Taking into account the installed and planned capacity Nevertheless, when compared with the Roadmap
and the retrofits under the REV profile, the excess fossil levels for solid fuels, CEE does not appear to run the
fuel capacity would range between 41 and 44 GWe by risk of a significant solid fuel-fired capacity lock-in
2020 and between 59 and 69 GWe by 2030. (see Table 4.4). This is because a large proportion of the
old capacity is expected to have been decommissioned
The REV profile thus illustrates that the technological by 2030. The risk of a solid fuel-fired capacity lock-in is
upgrades would lead to only a marginal strengthening lower also in SSEE (+ 2–3 GWe, or roughly 10 % above
of the capacity lock-in across the EU, by roughly 3 GWe the Roadmap levels), owing to only a few new coal-fired
in 2030 compared with the hypothetical EXT profile. units being planned in this region (+ 3 GWe).
(3) According to the REV profile, approximately 12 % of the total operational capacity in 2014 could potentially be closed by 2024, while 25 % of the
operational capacity in 2014 could be renovated to comply with the IED ELVs (taking into account the expected lifetime set and the planned new
capacity).
Transforming the EU power sector: avoiding a carbon lock-in 13Executive summary
Figure ES.2 Age of capacity by fossil fuel type, by region
100 % 2%
5% 6% 7%
10 % 10 %
13 % 7%
90 % 20 %
5%
31 % 28 %
21 % 5%
80 % 40 % 18 %
32 %
15 % 19 %
70 % 4%
67 % 9%
10 %
60 % 3%
5%
30 %
50 % 19 %
95 %
90 % 19 % 27 % 34 %
87 %
40 %
57 % 71 %
30 % 17 % 20 % 62 %
20 % 25 % 6%
35 %
31 %
17 % 28 %
10 %
16 %
8% 2% 6%
3%
0%
CEE CWE NEB SSEE CEE CWE NEB SSEE CEE CWE NEB SSEE
Gas Oil Solid
Post-2015 2010–2015 2000–2009 1990–1999 1980–1989 Before 1980
Note: Includes all installed and expected new units ≥ 200 MWe (all statuses).
Source: EEA (based on Platts, 2014).
By 2030, the greatest risk of a lock-in in solid fuels, in
Figure ES.3 New fossil fuel capacity post-2015,
by region in the EU-28 absolute terms, is to be found in central and western
Europe (CWE) (+ 18 GWe, or roughly 65 % in excess of
the cost-effective Roadmap levels), followed by NEB
GWe
(+ 7 GWe, or about 84 % above the levels identified in the
30
top-down analysis).
25 Interestingly, for NEB the risk of stranded solid fuel fired
0
capacity is closely linked to the anticipated technological
20
3
upgrading to reduce emissions of air pollutants in
13 5 1 accordance with the IED. In CEE, however, the same level
15 of technological upgrading would result in only a minor
increase in potentially stranded solid fuel fired capacity
23
10
(+ 2 GWe), whereas in CWE and in SSEE it would lead to
17 a slight decrease in excess coal-fired capacity compared
15
11
with the units being decommissioned in line with their
5
extended technical lifetimes. In practice, this could mean
that more decommissioning of capacity than retrofitting
0 is planned in order to meet the IED ELVs.
CEE CWE NEB SSEE
Solid Oil Gas
Source: EEA (based on Platts, 2014).
14 Transforming the EU power sector: avoiding a carbon lock-inExecutive summary
Considerations capacity, the EU's fossil fuel capacity would become
increasingly excessive.
This report assesses the importance of capacity
lifetimes and planned expansions in capacity for the The illustrative evolution of the sector towards
hypothetical evolution of the power sector in Europe fossil fuel overcapacity under the chosen lifetime
and the resulting alignment of the sector with EU assumptions puts an emphasis on the significance
climate goals. Because its purpose is to highlight the of longer term public and private sector planning, as
importance of a rational, progressive decommissioning well as a commitment to progressively decommission
of fossil fuel capacity across the EU, the analysis is not fossil fuel capacity to ensure that the sector is
geared towards forecasting future interactions between decarbonised at the lowest overall cost to consumers.
installed capacity, on the one hand, and EU climate Yet, a number of near-term decisions, concerning new
and energy policies and evolving macro-economic and fossil fuel capacity additions or modernisations, and
market conditions (e.g. the evolution of international the potential introduction of capacity mechanisms
fossil fuel prices), on the other hand. to maintain or increase the security of electricity
supply, risk promoting the opposite, namely fossil
Drawing on the assessment, the following policy fuel capacity additions and lifetime extensions that
considerations are made: could perpetuate the demand for capacity payments
and distort the efficient functioning of the integrated
• Seek out the least-cost, pan-European approach to EU electricity market. Such interventions should
decarbonising the power sector be considered only as a last resort, if the reformed
EU electricity and carbon markets fail to address
In terms of overall efforts, keeping the power sector concerns over the adequacy of electricity generation.
transition in Europe on the cost-effective pathway Where implemented, such interventions ought to
outlined by the Energy Roadmap 2050 would require be made consistent with EU and national long‑term
the removal of 20–24 % of all EU fossil fuel capacity decarbonisation pathways.
up to 2030 (Figure ES.4). Active decommissioning of
carbon‑intensive, inflexible baseload capacity would • Provide early information and long-term projections
facilitate the integration of higher shares of variable for the evolution of fossil fuel capacity, as part of the
renewable energy sources into the sector. Alignment integrated climate and energy plans under the EU
with the Roadmap would mean a 45 % reduction in Energy Union
the installed coal-fired capacity by 2030 compared
with the installed capacity in 2014, while gas‑fired Under the applicable EU climate legislation, Member
capacity could increase by 6–11 % over its 2014 levels. States are already required to prepare and update
biennially GHG emission projections up to 2020 and
To prevent unsustainable future levels of fossil fuel low-carbon development strategies up to 2050 (4). The
overcapacity, avoiding the commissioning of new fossil drawing up of integrated national energy and climate
fuel units (in particular coal) and decommissioning the plans — currently under discussion between the
old, existing units would be essential. As illustrated European Commission and the Member States as part
in Figure ES.1, if building the currently planned of the governance structure under the Energy Union —
new fossil fuel capacity was accompanied by the could provide the right framework for Member States
decommissioning of the same amount of existing to include early information available to competent
capacity, the fossil fuel capacity would be aligned authorities on the projected evolution of power
with the levels in the Energy Roadmap 2050 (see the capacity and planned closures by fuel type for the
'EXT & no New' profile). This would, however, require period 2021–2030 and provide longer term strategic
firm action to be taken within the current decade. In planning up to 2050. Providing such information, along
this respect, decommissioning first those plants that with information on expected carbon-intensity levels
would require investment in order to comply with the and existing and planned policies and measures, could
IED could free up financial resources for alternative improve the consistency between national 2030 climate
investments in low-carbon technologies. Such a and energy strategies, increase regulatory stability as a
strategy would be particularly beneficial, given the prerequisite for longer term investments, and enable
impact of the recent financial crisis on the availability Member States to contribute to the EU electricity
of finance for renewable energy investments across market more efficiently through interconnections and
the EU. In contrast, if power plant operators were the use of cross-border capacities and demand-side
to continue extending the lifetime of their installed approaches.
(4) The Monitoring Mechanism Regulation (MMR) (Regulation No 525/2013).
Transforming the EU power sector: avoiding a carbon lock-in 15Executive summary
Figure ES.4 Capacity by fuel in 2030 vs. 2014 (Roadmap and EXT, EU-27)
– 50 to
– 81 %
– 62 %
OIL
– 13 to
– 21 GWe
– 16 GWe
– 45 to
– 30 %
– 46 %
COAL
– 66 to
– 44 GWe
– 67 GWe
+ 6 to
+ 40 %
+ 11 %
GAS
+ 8 to
+ 55 GWe
+ 15 GWe
EXT profile
Roadmap (by 2030 compared to 2014)
2014
Capacity decommissioning by 2030 vs. 2014
Roadmap scenario EXT profile
– 20 % to – 24 % –3%
• Increase the alignment of energy, climate and challenges in the form of a large surplus of allowances
environmental policies to speed up the transition to a that has accrued over time and low carbon prices. As
secure and sustainable EU power sector these conditions could affect the ability of the ETS to
send clear signals to operators and investors regarding
From an EU policy perspective, the IED is expected the envisaged long-term decarbonisation of the power
to have only a small overall effect on existing fossil sector, solutions need to be found to tackle the surplus
fuel capacity, as shown in Figure ES.1. Consequently, allowances so that the ETS price becomes effective
preventing the unsustainable build-up in fossil fuel much earlier than 2030. To that end, the ongoing
capacity in the EXT and REV profiles relies, indirectly, revision of the ETS should take into account the risk of
on the effective functioning of the EU ETS. As discussed future fossil fuel capacity lock-in owing to current plans
elsewhere (EEA, 2015c), the EU carbon market faces to expand and to retrofit fossil fuel capacity.
16 Transforming the EU power sector: avoiding a carbon lock-inIntroduction
1 Introduction
1.1 Background dioxide emissions by 2050, with mid-term reviews
in 2030 and 2040 (EC, 2011a);
1.1.1 EU policy landscape
• the Energy Roadmap 2050, as it sets out competitive
The EU and its Member States have put in place and and energy-secure decarbonisation scenarios
consolidated a number of decarbonisation policies for the EU energy sector, with a focus on power
and initiatives that create a framework for transition generation.
towards a low-carbon and resource-efficient European
economy (see Box 1.1). Within that framework, the The power sector is at the heart of Europe's
European Commission roadmaps aim to create decarbonisation strategy and it is also the focus of this
clarity and transparency regarding the necessary, report.
manageable and cost-effective medium- and
long‑term transitions away from the current fossil In 2014, power generation remained the largest
fuel-based energy system. greenhouse gas (GHG)-emitting sector in Europe, being
responsible for roughly one third of all energy‑related
Two European Commission roadmaps are particularly emissions and more than half of the verified emissions
important for this report: under the EU Emissions Trading Scheme (ETS)
(EEA, 2015a; IEA, 2015). The sector's strong reliance on
• the 'Roadmap for moving to a competitive fossil fuels and the availability of low-carbon substitutes
low carbon economy in 2050', as it sets out mean that it could be decarbonised more rapidly and
cost‑effective sectoral trajectories to reduce carbon economically, compared with other sectors (EC, 2011b).
Box 1.1 Medium- to long-term EU climate and energy objectives
The EU Climate and Energy Package of 2009 set three main targets for 2020: a 20 % reduction in GHG emissions (compared
with 1990), a 20 % share of renewable energy sources in energy consumption, and 20 % improvement in energy efficiency.
In January 2014, the European Commission proposed medium-term targets for 2030: a 40 % reduction in GHG emissions
(compared with 1990), a 27 % share of renewable energy consumption, and a 27 % improvement in energy efficiency.
To limit climate change to below 2 °C, EU leaders have endorsed the objective of reducing Europe's GHG emissions by
80–95 % by 2050, compared with 1990 levels, as part of measures taken by developed countries as a group to reduce their
emissions by a similar degree. In line with this long-term objective, GHG emissions in the EU power sector need to fall by
48–66 % by 2030 and by 90–98 % by 2050 compared with 2005.
The 'Roadmap for moving to a competitive low carbon economy in 2050', the Energy Roadmap 2050 and the Transport
White Paper reflect the EU's goal to reduce GHG emissions in the run-up to 2050, with a 54–68 % cut in emissions by 2030
and an 80–95 % reduction by 2050, both compared with levels in 1990.
These targets, set at the macro-level, have profound implications for the — largely fossil fuel-based — EU power sector and
should set out the requirements for a huge cross-sectoral transformation. The vision is that electricity should come almost
entirely from renewable sources, nuclear power plant units and fossil fuel power plant units equipped with CCS technology.
The EU's medium-term climate and energy targets represent sectoral transformation benchmarks (EC, 2009, 2014) against
which policy effectiveness and coherence can and should be assessed.
Transforming the EU power sector: avoiding a carbon lock-in 17Introduction
For the power sector, the Energy Roadmap 2050 the economic crisis of 2007–2008. In 2013, fossil fuel
illustrates how currently available climate mitigation electricity generation decreased by 5.9 % year on year
options could deliver a 90–98 % cost-effective in the EU; nuclear electricity generation decreased by
decarbonisation, compared with 2005, by 2050 0.6 % year on year and accounted for 26.9 % of the
(EC, 2011b, 2011c). Those scenarios, however, are total production.
neither binding nor a substitute for EU, national and
local measures. Between now and 2020, the owners of fossil fuel
plants will need to take important decisions regarding
At the EU level, GHG emissions from the power sector their current and planned capacity and ensuing
and from other energy-intensive industrial sectors investments. These decisions will be taken in the face
and commercial airlines are regulated by the ETS, of considerable uncertainty and in a context in which:
which ensures that the emissions of these sectors
decline in line with an annually decreasing EU-wide • The total GHGs that can be emitted by the power
emissions cap. According to the projections that sector is constrained and should decrease linearly
the Member States submitted in 2015 under the EU in accordance with the ETS cap. The stringency
reporting regulation, with the existing measures in of this cap will depend on the effectiveness and
place, emissions from stationary installations under the speed at which the MSR and the wider review of
EU ETS will decrease by 8 % between 2015 and 2020, the EU ETS, currently under negotiation, succeed in
and by a further 5 percentage points between 2020 and tackling the oversupply of allowances.
2030 (EEA, 2015b).
• Electricity consumption in Europe has broadly
However, although the GHG emissions from the remained flat since 1990, and it may not increase
installations under the ETS are falling as intended, the significantly until 2030. Moreover, for 2020 and
ETS faces challenges in the form of a large surplus of 2030 there are binding targets for the consumption
allowances that has accrued over time and low carbon of renewable energy and non-binding targets
prices. Together, these conditions are a disincentive for improvements in energy efficiency. Together,
to long-term investment in low-carbon technologies these factors are likely to affect the need for fossil
and could affect the ability of the ETS to meet more fuel‑based power generation.
demanding emission reduction targets cost-effectively.
• An increasing number of Member States are
To address this imbalance, the EU has postponed the taking action to secure their electricity supplies
auctioning of 900 million allowances until 2019–2020 and prevent potential black-outs by introducing
and decided to establish a market stability reserve capacity mechanisms. These offer additional
(MSR) for the ETS, to make the system more resilient rewards to capacity providers, on top of income
in the face of imbalances in supply and demand generated by selling electricity, in return for
(EC, 2015). In addition, in 2015 the Commission tabled maintaining existing capacity or investing in
a proposal for a wider review of the EU ETS, including new capacity needed to guarantee the security
an increased rate of reduction in the ETS cap beyond of the electricity supply. Where implemented,
2020. This proposal is currently being negotiated by national capacity markets (will) have an impact
the European Parliament and the Council through the on competition and on the decisions taken by
ordinary legislative procedure. individual power plant owners and investors
to install, maintain or decommission fossil fuel
capacity.
1.1.2 The sector and the investors' perspective
• As the energy sector contributes significantly to
Along with nuclear energy, fossil fuels — coal and harmful air pollution (EEA, 2014a), the Industrial
gas — still represent a key energy source for the Emissions Directive (IED) is making the emission
European power system. In 2014, conventional fossil limit values (ELVs) for certain air pollutants more
fuel electricity generation accounted for a bit less than stringent. Those plants that do not meet the
half of the electricity produced in the EU. Between 1980 revised ELVs will need to be either upgraded
and 2008, it increased continuously and thereafter technologically to become less polluting or
decreased irregularly due to the growing output from decommissioned. But technological upgrading may
renewable energy sources (5) and the consequences of also mean extending their technical lifetime.
(5) The share of renewable energy sources in gross electricity consumption in the EU-28 increased by 8 % year on year between 2008 (17 %) and
2014 (27.5 %), driven by a rapid growth, especially in wind power and solar photovoltaic systems (EEA, 2016).
18 Transforming the EU power sector: avoiding a carbon lock-inIntroduction
Box 1.2 Bottom-up sector capacity and projections of power and CO2 outputs
The bottom‑up sector capacity was obtained by adding up all operational units (OPR), units under construction (CON),
delayed units (DEL) and planned units (PLN) up to a given year, from which the capacity of those units expected to have
been decommissioned by that year could be extracted.
To project the illustrative electricity generation and annual CO2 emissions of the power plant units in the bottom‑up analysis
into the future, the then-operational plants were considered and load factors (based on the average load factors per fuel
type in 2014) and fuel-dependent IPCC emission factors were assigned to them to determine the requisite outputs.
For then-operational plants that are also currently operational, real CO2 outputs — as reported in ETS 2012 — were
used, along with IPCC emission factors to determine energy output. If these energy outputs delivered a load factor
> 0.9 compared with capacity, the emissions factors were deemed inaccurate and a load factor averaged over the study
database was used instead (additional information on this assessment is provided in Annex 1). These average load factors
were also used for then-operational plants that are not currently operational, in order to determine the energy outputs.
The CO2 emissions of these plants were calculated using the aforementioned emissions factors.
1.2 Purpose evolution of the power sector, this report contributes
to a better understanding of policy and, in particular, to
This report aims to fill an important information gap a broadening of our understanding of the coherence
by illustrating the potential size of the excess fossil between climate and industrial emissions policies.
fuel capacity by 2030, assuming continuing inertia in
the power sector. This has been done by calculating
hypothetical future profiles for the evolution of the fossil 1.3 Assessment framework
fuel power sector in Europe up to 2030, on the basis
of selected lifetime assumptions, and then comparing 1.3.1 Method
these with the scenarios for cost-effective power sector
decarbonisation in the Energy Roadmap 2050. The The assessment is based on an innovative approach and
principal aim is to understand the convergence, or the recent, detailed power sector data that give a robust
risk of lock-in, of the hypothetical profiles, with respect quantitative insight into the fossil fuel power sector at EU
to the decarbonisation scenarios in the Roadmap and, and regional level. The analytical framework builds on a
more widely, with the EU's long-term decarbonisation detailed, unit-by-unit and plant‑by-plant investigation of
objectives. the current structure and GHG profile of the EU power
sector, carried out through a 'bottom‑up assessment'.
By examining in detail the fuel type, status and age of
the existing and planned fossil fuel capacity, and linking The bottom‑up assessment draws in particular on
this information to company ownership, the report the Platts World Electric Power Plants (WEPP) 2014
also aims to contribute to a better understanding of database, which has been linked to other information
the power sector and to provide useful information for sources, especially the Large Combustion Plants dataset
investors and policymakers. and the European Pollutant Release and Transfer
Register dataset (LCP-EPRTR), managed by the EEA and
Last but not least, the report looks into technological the European Commission (6), the European Union
upgrading needs across the sector to comply Transaction Log (EUTL) dataset under the ETS, and the
with stricter ELVs under the IED. In essence, these Power Plants Tracker (PPT) database of Enerdata.
requirements for upgrading needs signal the potential
need for investment and, where realised, mean The risk of a fossil fuel lock-in is exemplified as excess
extending the lifetime of the upgraded capacity into fossil fuel capacity in the illustrative power sector
the future. By exploring the consequences of the IED profiles developed for this report, compared with the
on capacity lifetime and, thereby, on the potential cost-effective levels in key mitigation scenarios in the
(6) The LCP-EPRTR database contains data reported by EU Member States to the Commission under the European Pollutant Release and Transfer
Register (E-PRTR) Regulation and the Large Combustion Plants (LCP) Directive.
Transforming the EU power sector: avoiding a carbon lock-in 19You can also read