Transportation Research Part A
←
→
Page content transcription
If your browser does not render page correctly, please read the page content below
Transportation Research Part A 148 (2021) 305–315
Contents lists available at ScienceDirect
Transportation Research Part A
journal homepage: www.elsevier.com/locate/tra
Integrated weather effects on e-cycling in daily commuting: A
longitudinal evaluation of weather effects on e-cycling in
the Netherlands
Joost de Kruijf a, *, Peter van der Waerden b, Tao Feng b, Lars Böcker d, Dea van
Lierop a, Dick Ettema a, Martin Dijst c
a
Faculty of Geosciences, Utrecht University, Princetonlaan 8A, 3584 CB Utrecht, the Netherlands
b
Built Environment, Urban Planning and Transportation, Eindhoven University of Technology, the Netherlands
c
Luxembourg Institute of Socio-Economic Research (LISER), Luxembourg
d
Institute of Transport Economics, Norway
A R T I C L E I N F O A B S T R A C T
Keywords: While in many regions the conventional bicycle has already been regarded as an environmentally
E-cycling friendly and healthy alternative to the car for daily commuting, societal and policy agendas are
E-bike also increasingly promoting e-bike adoption. Adding to recent research on e-bike safety, satis
Weather conditions
faction with travel and behavioral change, this paper reports on the impact of weather circum
Behavior change
GPS-data
stances on the use of the e-bike in daily commuting in an e-cycling incentive program in the
province of Noord-Brabant, the Netherlands. The impact of this incentive program was analyzed
using a longitudinal design, and it combined travel patterns that were derived from individuals’
GPS data over nine months, hourly observed meteorological data, and questionnaires on intended
behavior and sociodemographic characteristics. The findings suggest that the presence of snow
and ice, total precipitation, and high windspeed negatively affected the choice of commuting to
work by e-bike, in this decreasing order of impact. Although the overall impact of air temperature
on e-cycling was positive, the likeliness to commute by e-bike decreased at higher air tempera
tures. E-cycling under specific weather conditions was more likely if participants’ intention to e-
cycle under such weather conditions was stronger. Our study indicates that the benefits of the e-
bike in daily commuting are underestimated in relation to adverse weather conditions. Re
spondents from households with one car only, therefore, have fewer alternatives in poor weather
conditions: for these individuals, only total precipitation and the presence of relatively low air
temperature impact e-cycling. In addition, reported gender and high wind speeds might have
been expected to influence participation in e-cycling.
1. Introduction
Over the last decades, cycling has become increasingly regarded as an environmentally friendly alternative to car trips for short
distances. With increasing concerns about the environmental impact of car traffic, health, and livability, many cities are showing
increasing interest in promoting the use of the bicycle as a part of the total urban transportation system (Fishman and Cherry, 2016;
* Corresponding author.
E-mail address: j.kruijf@uu.nl (J. de Kruijf).
https://doi.org/10.1016/j.tra.2021.04.003
Received 11 June 2020; Received in revised form 15 December 2020; Accepted 5 April 2021
Available online 20 April 2021
0965-8564/© 2021 The Authors. Published by Elsevier Ltd. This is an open access article under the CC BY-NC-ND license
(http://creativecommons.org/licenses/by-nc-nd/4.0/).
J. de Kruijf et al. Transportation Research Part A 148 (2021) 305–315
Handy et al., 2014; Pucher and Buehler, 2012). Regardless of health and environmental benefits related to conventional cycling (c-
bikes) for short trips, many travelers choose to use other forms of transportation. Particularly for commuting to work, extensive
research has revealed that distance, the built and natural environment, socio-economic factors, psychological factors, and an in
dividual’s physical condition may prevent people from commuting using c-bikes (Heinen et al., 2010; Heinen and Handy, 2012;
Vandenbulcke et al., 2009; Gatersleben and Appleton, 2007; (MacArthur et al., 2014). Next to these personal and context specific
circumstances, bicycle ownership and/or the presence of bike-sharing schemes also influence bicycle use. Although differences in
personal factors such as gender and age have not been shown to have a distinctive influence on the likeliness to use shared bicycles,
time of day and day of the week, as well as trip purpose have been found to be significantly different across users (Noland et al., 2016;
Zhao et al., 2015). With the introduction of the electric peddle supported bicycle (e-bike), new opportunities have occurred where
range (distance) and physical effort become less of a barrier compared to the c-bike.
In recent years, the substitution effect of e-bikes has gained increasing attention in research (Fishman and Cherry, 2016). Although
several studies provide insights into the adoption of the e-bike and the reduction in trips made by competing modes of transport,
information on the specific factors influencing e-cycling is limited. In general, the modal shift to e-cycling is affected by the availability
of alternative modes of transport in the specific local context (Kroesen, 2017), the presence of bicycle infrastructure, and the existing
cycling levels within a given area (Haustein and Møller, 2016). The shift from c-bikes towards the use of e-bikes has been prominent
over the last decade in the Netherlands and Denmark, where cycling has already been common practice for a longer time (Sun et al.,
2020; Fishman and Cherry, 2016). In areas with less established cycling cultures, but where public transport is more dominant, notably
in many Chinese cities, the recent shift to e-bike usage came at the cost of using public transport, particularly buses (Cherry et al., 2016;
Cherry and Cervero, 2007; Kroesen, 2017). In car-dominant areas like many North American and Australian cities where cycling is
often still considered to be a fringe activity, e-bikes are substituted more frequently for car travel (Johnson and Rose, 2013; MacArthur
et al., 2014; Popovich et al., 2014).
Existing research in the Dutch context on the degree of e-bike substitution and initial mode of transport seems to be inconsistent
(Lee et al., 2015; Kroesen, 2017; Plazier et al., 2017; de Kruijf et al., 2018; Sun et al., 2020) because of differences in the availability of,
and experience with, alternative modes of transportation, the local context, and the possibility of participating in incentive programs.
However, research has shown that the use of e-bikes is influenced by gender, physical condition, car ownership, and household
composition, and it has a positive impact on travel satisfaction in daily commuting for short and mid-range distances (de Kruijf et al.,
2018). Limitations in range (as a result of the slower speed) and physical effort as a constraint of c-bikes are decreased by the
introduction of the e-bikes (de Kruijf et al., 2018; Sun et al., 2020). Many Dutch regions have become aware over the last decade of the
technical benefits associated with the e-bike and have accordingly developed cycling policies which emphasize high quality, safe
regional cycling routes catering to the mid-range (7.5 – 15 km) cycling trip distances, which is highly relevant for commuting. In
addition, they initiate e-cycling incentive programs aimed to engage employers and employees to reduce mental and monetary barriers
to e-bike adoption. These policies have contributed to the increasing popularity of the e-bike among all age groups, with 18% of all
cycling trips being made by e-bike (KiM, 2018).
Other factors that influence the attractiveness of c-bike commuting are the weather and climatic conditions (Rodríguez and Joo,
2004; Heinen et al., 2010), and several studies have suggested that weather conditions and cycling are strongly and closely linked
(Nankervis, 1999; Corcoran et al., 2014). Several studies have demonstrated the effects of daily weather and climatic conditions on a
wide range of travel behavior, including transportation mode choice and trip generation (Sabir et al., 2010; Böcker et al., 2013;
Creemers et al., 2015; Liu et al., 2015). Especially for active modes such as walking and cycling, inclement weather conditions have a
negative impact (more than other modes of travel) because of the exposure to the elements (Nahal and Mitra, 2018). As might be
expected, commuters have been shown to be less sensitive to weather changes, compared to non-commuters. For example, poor
visibility and heavy rain impact the travel intention, travel time and number of trips for non-commute related travel (Liu et al., 2015).
Existing studies of the effects of weather on cycling demonstrate the impact of observed weather conditions, such as wind, total
precipitation, and air temperature on cycling. As expected, generally warm and sunny weather positively contributes to walking and
cycling, whereas cold, wet, and windy weather conditions show the opposite effect (Nankervis, 1999; Bergström and Magnusson,
2003; Aaheim and Hauge, 2005; Gallop et al., 2011; Sabir et al., 2011; Flynn et al., 2012; Sears et al. 2012; Thomas et al., 2013). The
effect of air temperature on cycling has been found to be non-linear in the sense that weather at low air temperatures and also at high
air temperatures has a negative impact on cycling (Ahmed et al., 2012; Phung and Rose, 2007; Miranda-Moreno and Nosal, 2011;
Lewin, 2011; Böcker et al., 2019). Rain does not only negatively impact cycling at the specific time of cycling, but also significantly
affects cycling prior to adverse weather conditions indicating behavioral anticipation (Zhao et al., 2018; Zhao et al., 2019). Recent
research on the combined effects of weather conditions on cycling in the Dutch, Danish, and Norwegian context show considerable
regional differences with regard to the impact of weather on active travel (Böcker et al., 2019).
To date, research on the relationship between e-cycling and weather conditions is lacking, but it is necessary to gain insight about
the commuting patterns by e-bike that are related to adverse weather conditions and to determine the potential of e-cycling as a
sustainable mode of transport in transport planning. The effects of weather conditions on e-cycling likely differ from the effects on c-
cycling for several reasons (Fishman and Cherry, 2016). First, use of e-bikes, generally results in shorter overall travel times due to the
relatively higher speeds of e-bikes; because the duration of exposure to weather decreases, the effect of weather may be different for e-
bike commuters. In most weather-cycling related studies, travel time has not been explored sufficiently, although it can be argued that
the tolerance to adverse weather conditions is affected by the duration of the exposure (Böcker and Thorsson, 2014). Additionally, it
can be questioned whether having access to a car and having a back-up plan to use the car under bad weather conditions will influence
e-cycling as it does c-cycling.
In addition, the motor assisted peddle support feature that is associated with e-biking has a mediating effect on thermal (dis)
306J. de Kruijf et al. Transportation Research Part A 148 (2021) 305–315
comfort (e.g. Nikolopoulou and Steemers, 2003; Thorsson et al., 2004, 2007; Eliasson et al., 2007) and mechanical (dis)comfort (e.g.
Oliveira and Andrade, 2007, see my dissertation for references), which are common effects of using a c-bike in high air temperatures
(Heinen and Handy, 2012). Peddle support mediates the effect of weather on perception of thermal comfort (i.e. bodily assessment of the
thermal conditions as a function of air temperature, solar radiation, relative humidity, wind speed, duration of exposure, clothing,
intensity of physical activity, and bodily response in form of sweating), as it interferes with several of these elements. In addition to the
possible effect of e-cycling at high air temperatures, less physical effort could negatively affect e-cycling at low air temperatures. The
peddle support might further reduce the sensitivity to wind compared to the c-bike and the cycling distance might be expected to be
less affected by the impact of total precipitation. Consequently, peddle support likely increases thermal comfort during hot weather
(less physical activity intensity, more wind friction), and additionally reduces the discomfort of getting sweaty, reducing sensitivity to
heat.
The present study is the first to systematically investigate the impact of weather conditions on expected and actual engagement in e-
cycling. This investigation is based on daily commuting data over a period of 9 months, which was combined with meteorological data.
The impacts of weather on e-cycling are particularly relevant for commuting because this trip type occurs throughout the year under
varying weather conditions. Additionally, as a daily travel type, substituting car travel by e-bike plays an important role in making
commuting more sustainable and healthier. Finally, the effects of travel behavior change intentions and car occupation are taken into
account. It is likely that participants’ expectations and intentions before the program will impact the extent of shifting toward e-bike
use, where, according to the Extended Model of Goal-directed Behavior (EMGB) (Perugini and Conner, 2000), the addition of the desire
originating from individuals’ specific goals influences their behavior. Similarly, car access and having a back-up alternative might
influence mode choice.
2. Methods
Although the Netherlands is known for cycling in daily travel, which amounts to a proportion of 28.5%, many people (48.6%) still
take the car as driver or passenger to commute to work (KiM, 2018). From a sustainable mobility policy perspective, the introduction of
the e-bike opens new opportunities to stimulate behavioral change of employees living a mid-range (5–15 km) distance from work (de
Kruijf et al., 2018; Plazier et al., 2017). To incentivize the behavioral change from car-oriented commuting to e-cycling, the regional
Noord-Brabant government developed a large-scale e-cycling incentive program (B-Riders) that targeted commuters who lived be
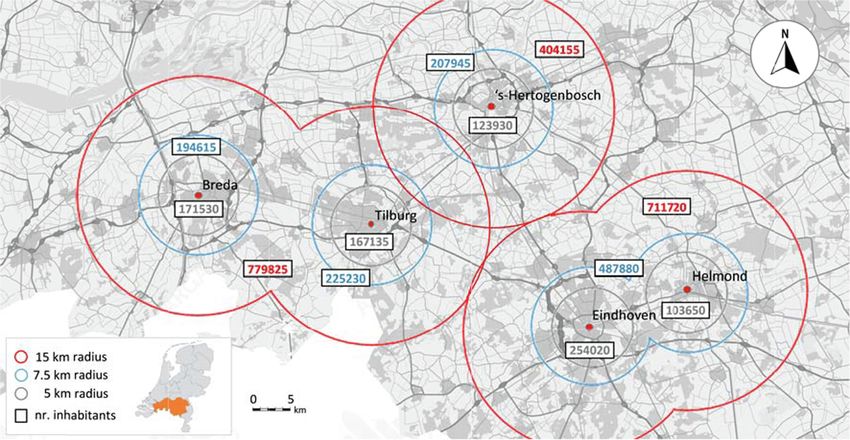
tween 5 and 15 km from their work (Noord-Brabant, 2013). With approximately 1 million people (40% of all inhabitants of the region)
living between 5 and 15 km from the major five cities (Eindhoven, Tilburg, ‘s-Hertogenbosch, Breda, and Helmond), the regional
government invited people working in Noord-Brabant to participate in the e-cycling incentive program using regional newspapers and
social media.
For this study, the behavior of participants in the e-cycling incentive program was monitored from January 2014 until mid-
September 2014. A mixed methods approach was applied to this end using GPS data, which determined whether a commute took
place and by what mode. Online surveys were conducted to assess intended e-cycling commuting behavior related to weather
conditions.
Fig. 1. Overview of the Province of North Brabant, with 5, 7.5 and 15 km radius for main five city centers.
307J. de Kruijf et al. Transportation Research Part A 148 (2021) 305–315
2.1. Study design
The B-Riders incentive program was initiated in 2013, and specifically targeted commuters who travelled to work by car having a
minimum of 50% of their working days per week. The participants had to meet three other recruitment conditions, as follows: (i)
minimum commute distance of at least 3 km; (ii) 18 to 65 years old; and (iii) working in the province of North-Brabant, the Netherlands
(Fig. 1). The region has a population of 2.5 million, with 1.9 million people living within a range of 15 km from the top five city centers.
To stimulate e-bike usage, participants were given financial compensation based on their overall e-bike participation. Because the
B-Riders program was developed to reduce regional peak hour car-congestion, a differentiation between peak and off-peak was
introduced with €0.15 per kilometer and €0.08 per kilometer, respectively. Participants received a maximum of €1,000 in financial
incentives per person over 12 months. To make the program more appealing, participants could earn compensation for e-bike
commuting and for e-cycling for other types of trips. The rough pre-study estimation made by the program was an average of 10 km of
commute distance, and it would take approximately 1 year to reach the maximum financial compensation. With their explicit
approval, the daily activity patterns and travel behavior of all participants were monitored 24/7 with a dedicated smartphone app
provided by the program using the smartphones’ GPS-sensor. In first 3 three months of the first edition of B-Riders program (which ran
from September 2013 until September 2014), the tracking and monitoring technique was optimized. Because of the optimization of the
data and the system as a whole, the data of the first three months is not used in this study. From January until September 2014 some
participants actually reached the maximum financial incentive by e-cycling to work. The incentive program builds on previous projects
in the Netherlands, in which participants received financial compensation upon changing their behavior in a more sustainable mode
choice, such as the Spitsmijden (peak avoidance) project (Ben-Elia and Ettema, 2009).
2.2. Questionnaire
In addition to the GPS tracking, a questionnaire was administered via the internet to measure participants’ intention to use e-bikes
in specific weather conditions and to collect information about the sociodemographic characteristics of the study participants. Ac
cording to the literature on the adaptation to e-cycling, related variables include personal and household characteristics, work-related
circumstances, and spatial characteristics, which were suggested in cycling research (Fishman and Cherry, 2016; Heinen et al., 2010;
Plazier et al., 2017; de Kruijf et al., 2018). To take path dependency into account in our analysis, we initially assumed that participants’
habitual travel behavior before the incentive program influenced one’s behavior in the program. Habit or past behavior have
frequently been demonstrated to predict future behavior better than measures of intention and attitude (e.g. Bentler and Speckart,
1979; Verplanken et al., 1997; Verplanken and Aarts, 1999). We expected participants with conventional cycling commute behavior
before the program to use the e-bike more frequently regardless of the weather conditions. Therefore, the same control variables are
used as in recent studies.
Table 1
Sample composition of 573 participants.
Variable Category Total
Age 25–39 years old 12.22%
40–49 years old 39.09%
50–65 years old 48.69%
Gender Male 46.42%
Female 53.57%
Education level Lower education | primary and secondary 12.91%
Vocational education 34.73%
Higher education | (applied) scientific 52.36%
Car ownership 1 car 51.51%
2+ cars 48.49%
Net household incomeJ. de Kruijf et al. Transportation Research Part A 148 (2021) 305–315
The weather conditions were divided into air temperature (Ta), total precipitation, heavy wind (wind speed 5◦ Beaufort or higher),
and snow/sleet. Participants were asked to report their intention to commute by e-bike to work under specific weather conditions on a
seven-point Likert-scale ranging from very unlikely (1 = very unlikely) to very likely (7 = very likely). First, air temperature was
divided into the following groups: very cold (Ta < 0 ◦ C), cold (0 ◦ C ≤ Ta < 10 ◦ C), mild (10 ◦ C ≤ Ta < 20 ◦ C), warm (20 ◦ C ≤ Ta < 30 ◦ C),
and hot (Ta ≥ 30 ◦ C). Second, the total precipitation was categorized as follows: dry weather, light precipitation (short showers and
drizzle), and heavy precipitation. Finally, participants’ intention to e-bike in a heavy wind (above 5◦ Beaufort) and with presence of
snow/sleet was documented. In addition, the questionnaire asked participants about their travel behavior during a regular week before
starting to commute by e-bike and a set of questions about personal and household characteristics including gender, age, educational
level, income, car ownership, household composition, and subjective health status. For each participant, the urbanization level was
derived from the postal code of the home location. By adding the postal code of the work location using the GIS (Geographical In
formation System) fastest path analysis based on the Open Street Map cycling network, commuting e-bike distance was determined.
2.3. Sample demographic information
The study is based on responses from 573 participants. Table 1 specifies the composition of the total sample, including urbanization
and the habitual cycling proportion before commuting by e-bike.
Table 1 shows that nearly half of the participants are between 50 and 65 years old and that most have a university or higher
vocational degree. This is consistent with the publications that reported that the e-bike is especially popular in older cohorts and
among higher educated segments (Fishman and Cherry, 2016; Johnson and Rose, 2013). >50% of the participants belonged to the
category “couple with children living at home”. Half of the sample (48%) owned at least two cars, and most participants (55%) were in
the mid to high income categories (>3,000 euro/month). Additionally, 76% of the participants had a cycle-commute distance of>10
km, suggesting that the e-bike may be an important alternative to car-commuting, which also offers acceptable travel times for longer
distances. Finally, 57% of the sample had flexible working hours.
2.4. Daily commute data
Using an integrated data imputation tool, Trace Annotator (Feng and Timmermans, 2014; Feng and Timmermans, 2019), all GPS
data were segmented into journeys and stages (segments). The tool imputes, based on location of origin and destination, the specific
travel purpose such as work, shopping groceries, social and recreational, for each journey based on location of facilities and infor
mation from self-reported data about facility locations. Next, the number of different modes of transport (stages) that were used during
one relocation as well as the specific mode of transport per stage were determined. For this research that focused on daily commuting,
GPS data was collected from January 2014 until mid-September 2014. A total of 242,179 journeys and 355,996 stages where recorded,
and of these 71,772 journeys made by 573 participants from home to work were selected based on the points of origin “home” and
destination “work”. Trip chains, where participants stay for limited time at a certain location (drinks after work) on their way home are
accounted for as separate journey. Table 2 gives an overview of the total of journeys by all modes of transport recorded from January
2014 until mid-September 2014.
2.5. Weather conditions
For this research, hourly meteorological data (air temperature, wind speed, and total precipitation) for the province of North-
Brabant were obtained from the Dutch Meteorological Institute (KNMI, 2014) from January 2014 until mid-September 2014,
which was related to the available GPS data. The province of North Brabant is situated in the south of the Netherlands, consisting of
4.855 km2 land surface, is covered by the following three meteorological stations: Gilze-Rijen (51◦ 34′ N, 04◦ 56′ E), Eindhoven (51◦
27ʹN, 05◦ 23ʹE), and Volkel (51◦ 39ʹN, 05◦ 42ʹE). The region can be characterized by a warm to temperate (maritime) climate (Geiger
and Pohl, 1954) with mild winters (average minimum air temperature, 7.1 ◦ C), warm summers (average maximum air temperature,
16.3 ◦ C), and relatively stable year-round total precipitation patterns (KNMI, 2014). To link the travel behavior to the meteorological
data, participants’ home postal codes were assigned to one of the weather stations. To give an indication of weather conditions in the
Netherlands, Table 3 describes daily average (Tavg in *C), maximum (Tmax in *C), and minimum (Tmin in *C) air temperature,
average (Ws_avg in meters per second) and maximum (Ws_max in meters per second) wind speed, and the average (Pavg in mm per
hour) and maximum (Psum in mm) daily total precipitation during months of the study period in Eindhoven.
Weather effects on mobility were analyzed using meteorological variables from hourly meteorological data. The reason for hourly
Table 2
Trips by all modes based on the purpose of 573 participants January to September 2014.
Work Groceries Groceries (non- Services Social Recreational Leisure Home Rest Total
(daily) daily)
Total of journeys 71,772 29,184 12,872 1,230 26,623 13,290 6,081 80,310 817 242,179
Percentage purpose 30% 12% 5% 1% 11% 5% 3% 33% 0% 100%
Average journeys per 125 51 22 2 46 23 11 140 1 423
person.
309J. de Kruijf et al. Transportation Research Part A 148 (2021) 305–315
Table 3
Average daily air temperature, wind speed and total precipitation on a monthly basis from January to September 2014 (KNMI, 2014).
T avg (◦ C) T min (◦ C) T max (◦ C) Ws_avg (m/s) Ws_max (m/s) P avg (mm) P max (mm)
January 5.8 − 2.7 14.1 4.4 12.0 1.4 7.3
February 6.5 − 0.6 14.0 5.3 13.0 1.5 8.1
March 8.7 − 2.5 22.3 3.3 10.0 0.6 7.0
April 12.3 − 1.5 23.9 3.0 10.0 0.7 6.3
May 13.6 − 0.6 28.2 3.5 11.0 3.4 30.8
June 16.6 6.3 29.3 2.8 8.0 0.7 7.2
July 19.9 5.2 33.4 3.1 8.0 4.3 23.5
August 19.9 5.2 33.4 3.1 8.0 4.3 23.5
September 15.9 5.2 25.0 2.3 7.0 1.4 30.0
variables is three-fold. First, the GPS data (time of departure and arrival, mode choice, distances) are collected on a continuous basis,
which enables a data merge on an hourly basis. Total precipitation (Ph) is defined by the categories dry (Ph = 0 mm/hour), light total
precipitation (0 < Ph ≤ 2 mm), and heavy total precipitation (Ph > 2 mm/hour). Second, commuter e-cycling is likely to be more
affected by the total precipitation at the time of travel than the total precipitation on a daily level. However, it is likely that expected
total precipitation in the afternoon might have an impact on the choice to go by e-bike to work in the morning. For example, when
deciding to take the e-bike to work, people are likely also to consider the predicted weather for their return trip home later that day.
Next to the hourly total precipitation, the afternoon total precipitation (as predicted weather) is aggregated from the hourly total
precipitation from 15:00 until 19:00. Third, according to Böcker (Böcker et al., 2015), mode choice related to air temperature on the
hourly level revealed roughly the same picture and performance as the average daily air temperature. Next to the hourly air tem
perature (Tah), for each weather station, the data are translated into the same classes as the questionnaire, enabling a comparison
between the stated intention and the actual weather circumstances. Participants had to report on their intention to use an e-bike to
commute to work with heavy wind (indicated by wind speed 5 Beaufort or more), which can be compared with measurements of 8 m
per second by weather stations.
2.6. Statistical modelling techniques
To explore the impact of weather circumstances on e-cycling for all participants during their daily commute, a series of four in
cremental multilevel binary logistic regression analyses were performed. First, a base model explored the relationship between e-
cycling and the personal and household characteristics together with urbanization level, cycling distance, and the share of past
conventional cycling to work. Therefore, the proportion of regular cycling before entering the program is considered. Second, to
address the impact of weather conditions, a second model added the following weather-related variables: observed air temperature
when departing for work, wind speed, total precipitation when departing for time as well as the total precipitation in the afternoon
period (as proxy variable for the expected total precipitation), and presence of snow/ice. In a third model, the effect of the combination
between the air temperature, total precipitation, and wind speed at the departure time to work and the stated e-cycling behavior on
actual e-cycling were explored. Therefore, the participants’ stated intention of using an e-bike under the actually observed weather
conditions was added as an explanatory variable. Finally, to test the impact of the availability of a second car in the household on the
sensitivity to weather conditions, we added interaction terms between availability of a second car and gender, air temperature,
windspeed, and total precipitation on e-cycling. The hypothesis was that having access to a car as a back-up plan for bad weather
conditions will influence the probability of e-cycling on days with bad weather.
3. Results
3.1. Descriptive statistics
To gain insight into the relationship between the use of an e-bike or the car to commute to work based on the weather conditions, all
home to work trips with their specific date and time were merged with the observed weather condition data. Table 4 shows the data for
Table 4
Total number of trips per mode of 573 participants based on air temperature, total precipitation, and wind speed between January 2014 and mid-
September 2014.
Air temperature (◦ C) Total precipitation (mm) Wind speed (m/s)
(very) cold Mild Warm/hot Dry Light precipitation Heavy precipitation Not strong Strong
T < 10 10 ≤ T < 20 T ≥ 20 0 mm 0–2 mm >2 mm. (0–8 m/s) (8 + m/s)
CAR (n, %) 6,829 14,036 3,906 10,604 10,104 4,063 24,416 355
31% 35% 34% 31% 34% 40% 33% 42%
EBIKE (n, %) 15,353 26,235 7,592 23,992 19,203 5,985 48,684 496
69% 65% 66% 69% 66% 60% 67% 58%
Total 22,182 40,271 11,498 34,596 29,307 10,048 73,100 851
310J. de Kruijf et al. Transportation Research Part A 148 (2021) 305–315
all commuting trips between January 2014 and mid-September 2014, and the relationship between the mode of transport and the
momentary air temperature, total precipitation, and wind speed at the time of use. Because of the low number of observations of air
temperatures below 0 ◦ C and above 30 ◦ C, these values are integrated into the adjacent category.
As shown in previous research (de Kruijf et al., 2018), the proportion of participants in the incentive program who e-cycled to work
was relatively high with an average of 67%. From all three air temperature categories, the highest proportion of commuting by e-bike
(69%) occurred at air temperatures below 10 ◦ C. With an increase in the air temperature, the proportion of e-cycling in the daily
commute compared to using a car slightly decreased. With total precipitation, a stronger effect was noticeable, where the use of the e-
bike decreased from 69% in dry weather to 60% in heavy rain. Although there were few trips under conditions with hard winds, the
proportion of e-bike use compared to the car were the lowest (58%). Combinations of these individual weather conditions influenced
the choice to commute by e-bike.
Table 5
Binary regression analysis of weather conditions on e-cycling in daily commuting.
MODEL 1 MODEL 2 MODEL 3 MODEL 4
Variable Category B Sig. B Sig. B Sig. B Sig.
Intercept − 0.1668 0.444 − 0.0958 0.658 − 1.7154 0.000 − 1.6524 0.000
Age 25–39 years − 0.3917 0.020 − 0.4020 0.016 − 0.4311 0.009 − 0.4308 0.009
40–49 years − 0.0937 0.451 − 0.0990 0.421 − 0.1054 0.388 − 0.1048 0.391
50–64 years – – – – – – – –
Gender Male − 0.1795 0.089 − 0.1960 0.061 − 0.1930 0.063 − 0.2445 0.095
Female – – – – – – – –
Physical condition Bad − 0.1601 0.351 − 0.1699 0.318 − 0.1084 0.520 − 0.1115 0.509
Neutral 0.1100 0.451 0.1018 0.481 0.1314 0.359 0.1286 0.370
Good 0.0863 0.491 0.0967 0.435 0.1231 0.316 0.1236 0.314
Excellent – – – – – – – –
Car ownership 1 car − 0.0644 0.549 − 0.0547 0.607 − 0.0730 0.489 − 0.1345 0.372
2 + cars – – – – – – – –
Household income < 3,000 0.3000 0.019 0.2891 0.022 0.2818 0.024 0.2844 0.023
(in € per month) 3,000–< 4,000 0.2401 0.065 0.2258 0.079 0.2280 0.074 0.2290 0.073
> 4,000 – – – – – – – –
Household composition Single − 0.1339 0.593 − 0.1135 0.647 − 0.1096 0.656 − 0.0954 0.700
Single parent − 0.1033 0.723 − 0.0787 0.785 − 0.0532 0.853 − 0.0406 0.888
Couple without 0.1949 0.440 0.1802 0.471 0.1866 0.451 0.1730 0.487
children
Couple with children – – – – – – – –
Residence urbanization Highly Urbanized − 0.2609 0.094 − 0.2618 0.090 − 0.2501 0.102 − 0.2494 0.103
moderate urban. − 0.1681 0.245 − 0.1713 0.232 − 0.1725 0.224 − 0.1721 0.226
Less urbanized − 0.0506 0.699 − 0.0513 0.692 − 0.0464 0.717 − 0.0500 0.697
Not urbanized – – – – – – – –
Cycle Distance 0–5 km 0.4792 0.107 0.5374 0.068 0.5299 0.070 0.5328 0.068
(per commute trip) 5–J. de Kruijf et al. Transportation Research Part A 148 (2021) 305–315
3.2. Regression models
Four incremental multilevel binary logistic regression analyses were performed on factors influencing the choice of commuting by
e-bike or a competitive mode of transport, where each model builds upon the previous model to understand the impact of additional
variables (Table 5). Overall, the four models indicate that the actual choice of commuting to work by e-bike is not systematically
related to most personal and household characteristics of participants in the incentive program such as age, gender, income, or
household income and composition. Only the youngest group of participants (aged 25 to 39 years old) had a significantly lower
probability of e-cycling compared to the age group 50 to 64-year-olds, whereas a low household income (J. de Kruijf et al. Transportation Research Part A 148 (2021) 305–315
These weather circumstances could, therefore, be less of an impact on e-cycling in daily commuting than on conventional cycling,
strengthening the reasoning from a policy perspective to invest in e-cycling as environmentally friendly alternative to car commuting.
As not all population segments are equally interested in arguments of environmentally friendly behavior change, a more specific target
group approach is therefor recommended.
Finally, this paper established to what extent availability of a car as an alternative to the e-bike in combination with gender and
specific weather conditions affects e-cycling. Although previous research has shown differences in the e-cycling behavior between men
and women (de Kruijf et al., 2018), the combination of gender and car availability did not affect e-cycling significantly in this
particular study. The total precipitation in combination with car possession, however, was shown to have a significant impact on e-
cycling. Participants with only one available car in the household tended to e-cycle more under rainy circumstances than those with an
available car as an alternative. Additionally, air temperature in combination with car possession by the household slightly affected e-
cycling. Although the e-bike mitigates the effects of effort compared to the conventional bicycle and increases commuting via cycling
for mid-range distances (de Kruijf et al., 2018), adverse weather conditions somewhat limit the choice to leave the car permanently.
However, from a policy perspective, the study shows that both men and women more often choose to commute to work by e-bike than
by car, indicating that the e-bike can be regarded as a structural commuting mode of transport for short and mid-range distances
despite light adverse weather conditions. This could be because of a conscious choice related to the higher purchase value of the e-bike
compared to the conventional bicycle. Where the effects seem positive, the extent of these effects can be argued in relation to the e-
cycling incentive program conditions. The results of the present study can be helpful for further strengthening Dutch cycling policies
which target commuter cyclists. For example, commuters being less sensitive to changes in weather conditions in combination with the
development of high quality and safe regional cycling routes decreases existing mental, natural and physical barriers (Heinen et al.,
2010) and increases the bicycle use in daily commuting. Given the rapidly increasing sales rate (38%) of e-bikes between May 2019
and 2020 (BOVAG, 2020), and the government and employer led incentive programs, e-bikes could function under many weather
circumstances as a sound alternative for car-commuting. Although it is likely that not all commuters will fully switch to using e-bikes in
all weather conditions, a vast amount of car-commuting trips can be substituted with effective cycling policy measures (de Kruijf et al.,
2018).
Overall, the results indicate that e-bikes have a clear potential to substitute car use in commute trips. A reduction in car use of more
than 60% is very significant and raises the question whether the car is still needed as a back-up in case of e.g., adverse weather
conditions, or whether this could be fulfilled by public transport or forms of shared mobility. Answering this question is speculative
and requires insight into the reasons of using the car. If this reason is adverse weather, (almost) door-to-door services such as car
sharing may be more attractive than public transport, which still requires access and egress travel often by walking or cycling. The
variation in car share across weather conditions suggests, however, that weather is not the main reason for car use. Another possible
reason for car use may be the opportunity to have more complex trip patterns, have serve passenger trips etc. Such needs or not likely
met by public transport, but more likely by shared mobility options, suggesting some potential for these services to replace private car
trips. Further research will be needed to explore this.
This study had some limitations. First, the research was based on a large-scale e-cycling incentive program, where car-commuters
were incentivized to switch to e-cycling on a voluntarily basis. It remains unclear if commuters would show comparable behavior
without participating in an incentive program because their personal and household characteristics as well as the social context may
vary, and their motivation to take up e-cycle may also vary. It, therefore, remains uncertain to what extent participants’ behavior
deviates from average where participants in the program are more likely to commute via e-cycling. Second, it remains uncertain to
what extent the weather conditions affected e-cycling for other travel purposes and in other spatial contexts. Because of the regional
nature of the incentive program, similar effects are not expected in other contexts (e.g., in different geographical contexts or without
providing incentives). For the relationship between active travel and weather circumstances in different countries, these variations are
already confirmed (Böcker et al., 2019). Third, it is uncertain if similar behavior is shown by the participants over a longer period
compared to the current study. Behavioral changes brought about by incentive programs (Ettema et al., 2010) will not necessarily be
sustained when the incentive ends.
CRediT authorship contribution statement
Joost de Kruijf: Conceptualization, Formal analysis, Methodology, Project administration, Visualization, Writing - original draft,
Writing - review & editing. Peter van de Waerden: Writing - original draft, Writing - review & editing. Tao Feng: Methodology,
Formal analysis, Writing - original draft, Writing - review & editing. Lars Böcker: Conceptualization, Writing - review & editing. Dea
van Lierop: Conceptualization, Methodology, Writing - original draft, Writing - review & editing. Dick Ettema: Conceptualization,
Methodology, Writing - original draft, Writing - review & editing. Martin Dijst: Writing - review & editing.
Acknowledgements
The authors thank the Dutch province of Noord-Brabant for allowing the research to be conducted within the B-Riders program. We
would also like to thank the anonymous reviewers for their helpful comments.
313J. de Kruijf et al. Transportation Research Part A 148 (2021) 305–315
References
Aaheim, H.A., Hauge, K.E., 2005. Impacts of climate change on travel habits: A national assessment based on individual choices (CICERO Report 07). Centre for
International Climate and Environmental Research, Oslo.
Ahmed, F., Rose, G., Figliozzi, M., Jakob, C., 2012. Commuter Cyclist’s Sensitivity to Changes in Weather: Insight from Two Cities with Different Climatic Conditions.
Proceeedings Transp. Res. Board 92nd Annu. Meet.
Ben-Elia, E., Ettema, D., 2009. Carrots versus sticks: Rewarding commuters for avoiding the rush-hour-a study of willingness to participate. Transp. Policy. https://doi.
org/10.1016/j.tranpol.2009.03.005.
Bentler, P.M., Speckart, G., 1979. Models of attitude-behavior relations. Psychol. Rev. https://doi.org/10.1037/0033-295X.86.5.452.
Bergström, A., Magnusson, R., 2003. Potential of transferring car trips to bicycle during winter. Transp. Res. Part A Policy Pract. https://doi.org/10.1016/S0965-8564
(03)00012-0.
Böcker, L., Dijst, M., Faber, J., Helbich, M., 2015. En-route weather and place valuations for different transport mode users. J. Transp. Geogr. https://doi.org/
10.1016/j.jtrangeo.2015.06.003.
Böcker, L., Dijst, M., Prillwitz, J., 2013. Impact of Everyday Weather on Individual Daily Travel Behaviours in Perspective: A Literature Review. Transp. Rev. https://
doi.org/10.1080/01441647.2012.747114.
Böcker, L., Priya Uteng, T., Liu, C., Dijst, M., 2019. Weather and daily mobility in international perspective: A cross-comparison of Dutch, Norwegian and Swedish city
regions. Transp. Res. Part D Transp. Environ. https://doi.org/10.1016/j.trd.2019.07.012.
Böcker, L., Thorsson, S., 2014. Integrated weather effects on cycling shares, frequencies, and durations in Rotterdam, the Netherlands. Weather. Clim. Soc. https://doi.
org/10.1175/WCAS-D-13-00066.1.
BOVAG, 2020. https://mijn.bovag.nl/actueel/nieuws/2020/juli/vakhandel-verkoopt-recordaantal-elektrische-fietse.
Cherry, C., Cervero, R., 2007. Use characteristics and mode choice behavior of electric bike users in China. Transp. Policy. https://doi.org/10.1016/j.
tranpol.2007.02.005.
Cherry, C.R., Yang, H., Jones, L.R., He, M., 2016. Dynamics of electric bike ownership and use in Kunming. China. Transp. Policy. https://doi.org/10.1016/j.
tranpol.2015.09.007.
Corcoran, J., Li, T., Rohde, D., Charles-Edwards, E., Mateo-Babiano, D., 2014. Spatio-temporal patterns of a Public Bicycle Sharing Program: The effect of weather and
calendar events. J. Transp. Geogr. https://doi.org/10.1016/j.jtrangeo.2014.09.003.
Creemers, L., Wets, G., Cools, M., 2015. Meteorological variation in daily travel behaviour: evidence from revealed preference data from the Netherlands. Theor. Appl.
Climatol. https://doi.org/10.1007/s00704-014-1169-0.
de Kruijf, J., Ettema, D., Kamphuis, C.B.M., Dijst, M., 2018. Evaluation of an incentive program to stimulate the shift from car commuting to e-cycling in the
Netherlands. J. Transp. Heal. https://doi.org/10.1016/j.jth.2018.06.003.
Eliasson, I., Knez, I., Westerberg, U., Thorsson, S., Lindberg, F., 2007. Climate and behaviour in a Nordic city. Landsc. Urban Plan. https://doi.org/10.1016/j.
landurbplan.2007.01.020.
Ettema, D., Knockaert, J., Verhoef, E.T., 2010. Using incentives as traffic management tool: empirical results of the "peak avoidance" experiment. Transport. Lett.: Int.
J. Transport. Res. 2, 39–51.
Feng, T., Timmermans, H., 2014. Multi-Week travel surveys using GPS devices: Experiences in the Netherlands, in: Mobile Technologies for Activity-Travel Data
Collection and Analysis. https://doi.org/10.4018/978-1-4666-6170-7.ch007.
Feng, T., Timmermans, H.J.P., 2019. Integrated imputation of activity-travel diaries incorporating the measurement of uncertainty. Transp. Plan. Technol. https://
doi.org/10.1080/03081060.2019.1576384.
Fishman, E., Cherry, C., 2016. E-bikes in the Mainstream: Reviewing a Decade of Research. Transp. Rev. https://doi.org/10.1080/01441647.2015.1069907.
Flynn, B.S., Dana, G.S., Sears, J., Aultman-Hall, L., 2012. Weather factor impacts on commuting to work by bicycle. Prev. Med. (Baltim). https://doi.org/10.1016/j.
ypmed.2011.11.002.
Gallop, C., Tse, C., Zhao, J., 2011. A Seasonal Autoregressive Model Of Vancouver Bicycle Traffic Using Weather Variables. i-manager’s J. Civ. Eng. https://doi.org/
10.26634/jce.1.4.1694.
Gärling, T., Fujii, S., 2009. Travel behavior modification: Theories, methods, and programs. Expand. Sph. Travel Behav. Res.
Gatersleben, B., Appleton, K.M., 2007. Contemplating cycling to work: Attitudes and perceptions in different stages of change. Transp. Res. Part A Policy Pract.
https://doi.org/10.1016/j.tra.2006.09.002.
Geiger, R., Pohl, W., 1953. Revision of the Köppen-Geiger Klimakarte der Erde. Justus Perthes, Darmstadt.
Handy, S., van Wee, B., Kroesen, M., 2014. Promoting Cycling for Transport: Research Needs and Challenges. Transp. Rev. https://doi.org/10.1080/
01441647.2013.860204.
Haustein, S., Møller, M., 2016. E-bike safety: Individual-level factors and incident characteristics. J. Transp. Heal. https://doi.org/10.1016/j.jth.2016.07.001.
Heinen, E., Handy, S., 2012. Similarities in Attitudes and Norms and the Effect on Bicycle Commuting: Evidence from the Bicycle Cities Davis and Delft. Int. J. Sustain.
Transp. https://doi.org/10.1080/15568318.2011.593695.
Heinen, E., van Wee, B., Maat, K., 2010. Commuting by bicycle: An overview of the literature. Transp. Rev. https://doi.org/10.1080/01441640903187001.
Johnson, M., Rose, G., 2013. Electric bikes - cycling in the New World City: An investigation of Australian electric bicycle owners and the decision making process for
purchase, in: Australasian Transport Research Forum, ATRF 2013 - Proceedings.
Kennisinstituut voor Mobiliteitsbeleid (KiM) (2018) Fietsfeiten, ISBN/EAN978-90-8902-181-6, Den Haag.
KNMI, 2014. Publically Available Weather Records. .
Kroesen, M., 2017. To what extent do e-bikes substitute travel by other modes? Evidence from the Netherlands. Transp. Res. Part D Transp. Environ. https://doi.org/
10.1016/j.trd.2017.04.036.
Lee, A., Molin, E., Maat, K., Sierzchula, W., 2015. Electric bicycle use and mode choice in the Netherlands. Transp. Res. Rec. https://doi.org/10.3141/2520-01.
Lewin, A., 2011. Temporal and Weather Impacts on Bicycle Volumes. Trb 2011.
Liu, C., Susilo, Y.O., Karlström, A., 2015. Investigating the impacts of weather variability on individual’s daily activity-travel patterns: A comparison between
commuters and non-commuters in Sweden. Transp. Res. Part A Policy Pract. https://doi.org/10.1016/j.tra.2015.09.005.
MacArthur, J., Dill, J., Person, M., 2014. Electric Bikes in North America. Transp. Res. Rec. J. Transp. Res. Board. https://doi.org/10.3141/2468-14.
Miranda-Moreno, L., Nosal, T., 2011. Weather or not to cycle: Temporal trends and impact of weather on cycling in an urban environment. Transp. Res. Rec. https://
doi.org/10.3141/2247-06.
Nahal, T., Mitra, R., 2018. Facilitators and barriers to winter cycling: Case study of a downtown university in Toronto. Canada. J. Transp. Heal. https://doi.org/
10.1016/j.jth.2018.05.012.
Nankervis, M., 1999. The effect of weather and climate on bicycle commuting. Transp. Res. Part A Policy Pract. https://doi.org/10.1016/S0965-8564(98)00022-6.
Nikolopoulou, M., Steemers, K., 2003. Thermal comfort and psychological adaptation as a guide for designing urban spaces, in: Energy and Buildings. https://doi.org/
10.1016/S0378-7788(02)00084-1.
Noland, R.B., Smart, M.J., Guo, Z., 2016. Bikeshare trip generation in New York City. Transp. Res. Part A Policy Pract. https://doi.org/10.1016/j.tra.2016.08.030.
Noord-Brabant, 2013. http://www.briders.nl/b-riders-fietsen-naar-het-werk.
Oliveira, S., Andrade, H., 2007. An initial assessment of the bioclimatic comfort in an outdoor public space in Lisbon. Int. J. Biometeorol. 2, 3–4. https://doi.org/
10.1007/s00484-007-0100-0.
Perugini, M., Conner, M., 2000. Predicting and understanding behavioral volitions: The interplay between goals and behaviors. Eur. J. Soc. Psychol. https://doi.org/
10.1002/1099-0992(200009/10)30:53.0.CO;2-#.
Phung, J., Rose, G., 2007. Temporal variations in usage of Melbourne’s bike paths. in. 30th Australasian Transport Research Forum.
314J. de Kruijf et al. Transportation Research Part A 148 (2021) 305–315
Plazier, P.A., Weitkamp, G., van den Berg, A.E., 2017. “Cycling was never so easy!” An analysis of e-bike commuters’ motives, travel behaviour and experiences using
GPS-tracking and interviews. J. Transp. Geogr. https://doi.org/10.1016/j.jtrangeo.2017.09.017.
Popovich, N., Gordon, E., Shao, Z., Xing, Y., Wang, Y., Handy, S., 2014. Experiences of electric bicycle users in the sacramento, california area. Travel Behav. Soc.
2014. https://doi.org/10.1016/j.tbs.2013.10.006.
Pucher, J.E., Buehler, R.E., 2012. City cycling. MIT Press, Cambridge, MA.
Rodríguez, D.A., Joo, J., 2004. The relationship between non-motorized mode choice and the local physical environment. Transp. Res. Part D Transp. Environ. 2004.
https://doi.org/10.1016/j.trd.2003.11.001.
Sabir, M., van Ommeren, J., Koetse, M.J., Rietveld, P., 2010. Impact of weather on daily travel demand, Working paper. CROW Fietsberaad.
Sabir, M., van Ommeren, J., Koetse, M., Rietveld, P. Adverse Weather and Commuting Speed. Networks Spat. 2011 Econ. https://doi.org/10.1007/s11067-010-9130-
y.
Sears, J., Flynn, B.S., Aultman-Hall, L., Dana, G.S., 2012. Tobike or not to bike—Seasonal factors for bicycle commuting. Transport. Res. Recreat. 2314, 105–111.
https://doi.org/10.3141/2314-14.
Sun, Q., Feng, T., Kemperman, A., Spahn, A., 2020. Modal shift implications of e-bike use in the Netherlands: Moving towards sustainability? Transp. Res. Part D
Transp. Environ. https://doi.org/10.1016/j.trd.2019.102202.
Thomas, T., Jaarsma, R., Tutert, B., 2013. Exploring temporal fluctuations of daily cycling demand on Dutch cycle paths: The influence of weather on cycling.
Transportation (Amst). https://doi.org/10.1007/s11116-012-9398-5.
Thorsson, S., Lindqvist, M., Lindqvist, S., 2004. Thermal bioclimatic conditions and patterns of behaviour in an urban park in Göteborg. Sweden. Int. J. Biometeorol.
https://doi.org/10.1007/s00484-003-0189-8.
Vandenbulcke, G., Thomas, I., de Geus, B., Degraeuwe, B., Torfs, R., Meeusen, R., Int Panis, L., 2009. Mapping bicycle use and the risk of accidents for commuters who
cycle to work in Belgium. Transp. Policy. https://doi.org/10.1016/j.tranpol.2009.03.004.
Verplanken, B., Aarts, H., 1999. Habit, Attitude, and Planned Behaviour: Is Habit an Empty Construct or an Interesting Case of Goal-directed Automaticity? Eur. Rev.
Soc. Psychol. https://doi.org/10.1080/14792779943000035.
Verplanken, B., Aarts, H., Van Knippenberg, A., 1997. Habit, information acquisition, and the process of making travel mode choices. Eur. J. Soc. Psychol. 1997
https://doi.org/10.1002/(sici)1099-0992(199709/10)27:53.3.co;2-1.
Zhao, J., Guo, C., Zhang, R., Guo, D., Palmer, M., 2019. Impacts of weather on cycling and walking on twin trails in Seattle. Transp. Res. Part D Transp. Environ.
https://doi.org/10.1016/j.trd.2019.09.022.
Zhao, J., Wang, J., Deng, W., 2015. Exploring bikesharing travel time and trip chain by gender and day of the week. Transp. Res. Part C Emerg. Technol. https://doi.
org/10.1016/j.trc.2015.01.030.
Zhao, J., Wang, J., Xing, Z., Luan, X., Jiang, Y., 2018. Weather and cycling: Mining big data to have an in-depth understanding of the association of weather variability
with cycling on an off-road trail and an on-road bike lane. Transp. Res. Part A Policy Pract. https://doi.org/10.1016/j.tra.2018.03.001.
315You can also read