Transportation Research Part D
←
→
Page content transcription
If your browser does not render page correctly, please read the page content below
Transportation Research Part D 14 (2009) 281–290

                                                        Contents lists available at ScienceDirect

                                              Transportation Research Part D
                                           journal homepage: www.elsevier.com/locate/trd

Comparative environmental impacts of electric bikes in China
Christopher R. Cherry a,*, Jonathan X. Weinert b, Yang Xinmiao c
a
    Civil and Environmental Engineering, University of Tennessee-Knoxville, 223 Perkins Hall, Knoxville, TN 37996-2010, USA
b
    Independent Consultant, 2165 Acton St, Berkeley, CA 94702, USA
c
    Institute of Transportation Studies, Tsinghua University, 1 Qinghua Yuan, Beijing 100084, China

a r t i c l e           i n f o                         a b s t r a c t

Keywords:                                               Electric two-wheelers have become a significant mode of transportation in China in the
Electric bike                                           past decade. Though marketed and publicized by some as zero-emission vehicles, little past
Two-wheeler                                             research has been done to quantify the environmental impacts of electric two-wheelers in
China                                                   China. This paper quantifies some of the environmental impacts of the production pro-
Life cycle analysis
                                                        cesses and use phase of electric two-wheelers and compares them to the environmental
Motorcycle
Lead pollution
                                                        impacts of competing modes, including bicycles, buses, motorcycles and cars. The use
                                                        phase emissions are quantified geographically with significantly higher emissions in coal
                                                        rich regions, compared to regions relying more on hydropower. The results show that elec-
                                                        tric two-wheelers emit several times lower pollution per kilometer than motorcycles and
                                                        cars, have comparable emission rates to buses and higher emission rates than bicycles.
                                                        Lead is one pollutant on which electric two-wheelers perform poorly, because of their
                                                        use of lead acid batteries.
                                                                                                          Ó 2008 Elsevier Ltd. All rights reserved.

1. Introduction

   China’s transportation system is undergoing a phenomenal transformation that began in the last decade, with tens of mil-
lions of individuals accessing motorized transportation for the first time. Auto ownership has grown at rates of 30–40% per
year. Simultaneously, automobiles, buses, bicycles, motorcycles and most recently, electric two-wheelers (hereafter referred
to as electric bikes) have filled urban road capacity. Electric bike sales have grown far faster than the sales of any other mode
in China’s history, from a modest 150 000 sold in 1999 to an estimated 21 million sold in 2007 (CHR Metals, 2008). It is esti-
mated that there are 40–50 million electric bikes on China’s roadways today (Jamerson and Benjamin, 2007), which has
forced policy makers to act rapidly to develop national and local policy to promote, discourage or regulate electric bikes.
Electric two-wheelers have two general design types, bicycle style electric bikes (BSEB) and scooter style electric bikes
(SSEB). These variations are significant in form, but the underlying technologies are the same.
   There are two notable national policies that have given credibility to the electric bike. The first was the National Technical
Standards (China Central Government, 1999), which specified standard size and performance characteristics to manufacture
electric bikes with similar form and function of traditional bicycles. The second was the National Road Transportation Law
(China Central Government, 2004), which classified electric bikes as bicycles from a legal and regulatory perspective, requir-
ing no licensing or helmet use, and allowing access to bicycle infrastructure. Since these two national policies, there have
been several local policies that have been critical to the development of electric bikes. Beijing introduced a ban on electric
bikes in early 2006, which was quickly retracted. Guangzhou also introduced a ban on electric bikes in late 2006, which offi-
cially continues today. Chengdu has announced a licensing scheme that will restrict use of electric bikes in the city center
based on size and speed characteristics (CHR Metals, 2008).

    * Corresponding author.
      E-mail addresses: cherry@utk.edu, outstretchedhand@yahoo.com (C.R. Cherry).

1361-9209/$ - see front matter Ó 2008 Elsevier Ltd. All rights reserved.
doi:10.1016/j.trd.2008.11.003
282 C.R. Cherry et al. / Transportation Research Part D 14 (2009) 281–290
Electric bikes have been criticized on a number of grounds, including environmental performance, contribution to con-
gestion, and safety (Fairley, 2005). The environmental impacts of electric bikes have remained unclear. It is understood that
electric bikes emit zero tailpipe emissions at their point of use and that their overall energy efficiency is higher and emissions
per kilometer are lower than gasoline scooters and cars; it is unclear however how the life cycle emissions compare to other
alternative modes that are considered the highly sustainable, buses and bicycles. Should electric bikes be prohibited or re-
stricted, some evidence suggests that these riders would substitute to other lower emission modes such as bus or bicycle, as
opposed to gasoline scooter or car (Weinert et al., 2007a).
We analyze the environmental costs of electric bikes and alternative modes in China to help inform policy that will affect
tens of millions of users. It investigates emissions during use as well as some of the larger life cycle emission sources, such as
raw material production. This paper builds off of previous efforts to identify the relative effects of mode shift on the
environment (Cherry and Cervero, 2007; Weinert et al., 2007b). The environmental analysis of electric bikes and various
modes of transportation draws heavily on a larger report written by the authors (Cherry et al., 2008).1 The remainder of
the paper is organized as follows. Section 2 discusses methodology and data used in the analysis. Section 3 presents the envi-
ronmental impacts of electric bikes and alternative modes of transportation. Section 4 concludes and provides policy
recommendations.
2. Methodology and analysis
Most of the environmental impacts of any mode of transportation can be divided into two categories, those that occur
during the production processes and those that occur during the use phase. The electric bike also has some significant emis-
sions during its disposal phase, although these emissions are difficult to quantify given the infancy of this mode and the scar-
city of information on disposal practices. One notable disposal emission is that of lead (Pb) from batteries. This section
discusses emissions from the production processes, lead losses, and use phases of the electric bike and its alternatives.
2.1. Production processes
The main production processes for vehicle manufacturing include mining or extraction of raw materials, processing those
raw materials into usable refined materials, fabricating refined materials into individual parts, and finally, assembling the
parts into a vehicle. Aggregate data, reported in industrial statistical yearbooks, were used in this analysis to identify emis-
sion intensities (kg pollutant per kg of material produced) and energy intensities (kWh energy per kg of material produced)
(China Data Online, 2007; National Bureau of Statistics, 2007). Moreover, some specific emission and energy intensities for
steel and other non-ferrous metal industries are reported in (Lawrence Berkeley National Laboratory, 2004).
Based on site visits and a sample of energy use and emissions during electric bike assembly, the assembly and fabrication
processes are insignificant compared to raw material extraction and refinement. Nevertheless, this study is not meant to be a
full life cycle analysis, but rather to investigate some of the largest energy using and polluting processes.
Material inventories were gathered from leading electric bike, bicycle, motorcycle, and bus producing companies in
China. These inventories, shown in Table 1, are ultimately used to calculate the emissions and energy use requirements
of the production processes.
Several assumptions and omissions were made to develop Table 1. This table includes energy and environmental impacts
due to the mining and production of ferrous and non-ferrous metals, and the production of plastic and rubber. It does not
include the impacts of battery electrolyte production or fillers in rubber production (particularly carbon black). It uses sim-
plified assumptions of types of steel and non-ferrous metals used in each vehicle. It also does not include transportation
logistics impacts. The values presented in Table 1 should be considered lower bounds, since several components of the life
cycle are omitted. The numbers also include the manufacture of replacement batteries and tires, and in the case of electric
bikes, motors.
2.2. Lead acid batteries
Policy makers often cite lead acid battery pollution as a reason for regulation of electric bikes. Approximately 95% of elec-
tric bikes in China are powered by lead acid batteries (Jamerson and Benjamin, 2007), although this number is dropping be-
cause of more advanced battery technologies. Based on interviews with manufacturers and service facilities, the life span of
an electric bike battery is considered to be one to two years, or up to 10 000 km. BSEBs typically use 36 V battery systems, on
average weighing 14 kg. SSEBs typically use 48 V battery systems weighing 18 kg; and, some of the newest electric bikes
have 72 V battery systems. The lead content of electric batteries is 70% of the weight, so BSEB and SSEB batteries contain
10.3 and 14.7 kg of lead, respectively.
Lead pollution is perhaps the most problematic issue for electric bikes and is the same problem (among others) that con-
tributed to the initial demise of electric car development in the United States in the early 1990s (Lave et al., 1995). Because of
the relatively short lifespan of deep discharge electric bike lead acid batteries, an electric bike could use five batteries in its
1
We do not explicitly discuss other impacts of electric bikes on the transportation system, such as safety, congestion, or mobility and access.C.R. Cherry et al. / Transportation Research Part D 14 (2009) 281–290 283
Table 1
Material inventory, emissions and energy use.
Bicycle style Scooter style Bicycle 100 cc motorcycle Bus
electric bike electric bike
Weight of component materials (kg/vehicle)
Steel 18.2 46.1% 26.2 46.5% 13.0 72.2% 76.4 81.3% 6303 57.8%
Plastic 5.7 14.4% 15.2 27.0% 2.0 11.1% 9.1 9.7% 553 5.1%
Lead 10.3 26.1% 14.7 26.1% – – 1.7 1.8% 90 0.8%
Nickel – – – – – – 0.3 0.3% – –
Fluid 2.9 7.5% 4.2 7.5% – – – – 78 0.7%
Copper 2.6 6.5% 3.5 6.1% – – 1 1.1% 109 1.0%
Rubber 1.1 2.9% 1.2 2.2% 2.0 11.1% 3.2 3.4% 405 3.7%
Aluminum 0.5 1.3% 0.6 1.0% 1.0 5.6% 1.5 1.6% 1666 15.3%
Zinc – – – – – – 0.8 0.9% – –
Glass – – 0.2 0.3% – – – – 490 4.5%
Wood 396 3.6%
Other 308 2.8%
Total weight 41.3 65.8 18.0 94 10 900
Associated energy and emissions of manufacturing processes
Energy use (tonne SCE) 0.179 0.261 0.045 0.188 34.345
Energy use (kWh) 1456 2127 363 1534 279605
Air pollution (SO2) (kg) 1.563 2.198 0.275 1 274
Air pollution (PM) (kg) 5.824 8.173 1.176 4 1064
Greenhouse gas (tonne CO2eq) 0.603 0.875 0.097 0.284 70.601
Waste water (kg) 1488 2092 393 1397 291 182
Solid waste (kg) 4.463 7.139 0.641 3 756
life, emitting lead into the environment with every battery. Lead is emitted into the environment during four processes: min-
ing and smelting lead ore; battery manufacturing; recycling used batteries; and non-recycled lead entering the waste
stream. Loss rates can be expressed in terms of unit weight of lead lost per unit weight of battery produced for each process.
Lave et al. (1995) cite that, in the US, 4% (0.04 tonnes lost per tonne of lead in produced batteries) of the lead produced is lost
using virgin production processes, 1% is lost during the battery manufacturing process and 2% is lost during the recycling
process. So, a battery composed of 100% recycled lead emits 3% of its lead mass into the environment. A battery composed
of 100% virgin material emits 5% of its lead content into the environment. In most industrialized countries, lead recycling
rates exceed 90%. Recent research corroborates these findings (Mao et al., 2008b).
China’s lead acid battery system and efficiencies are very different from industrialized countries (Roberts, 2006). Mao
et al. (2006) investigated the Chinese lead acid battery system and found that 16.2% of the lead content of a battery is lost
during mining and concentrating, 7.2% lost during primary smelting, 13.6% is lost during secondary smelting and recycling
processes, and 4.4% is lost during the battery manufacturing process. These loss rates reflect loss in terms of final battery
production (not initial lead input). Fig. 1 is derived from the analysis conducted by Mao et al. The reasons for these very high
loss rates are mostly due to poor ore quality and a high proportion of lead refined at small scale factories using outdated
technology. The official recycling rate of lead in China’s lead acid battery industry is 31.2%; however, Mao et al. estimate that
the actual number is approximately double that, or 62%, because of informal, small scale recyclers. Because of the high value
of lead, most analysts project the battery recovery rate is above 85%. More recently, the price of lead has tripled, suggesting
that this value might push battery recovery rates near 100%. The lead recycle rate partially determines the proportion of
recycled lead in each battery.
In their study of the Chinese lead acid battery system, Mao et al. (2006) use data from 1999, before electric bike batteries
were a significant share of the market. Several of the values (specifically recycling rate) are estimates and could have chan-
ged since electric bikes entered the market. As electric bikes surpass the number of cars, electric bikes represent a large pro-
portion of lead acid battery production. Because electric bikes use batteries quickly, some informal recycling and collection
practices have developed. In most cases, an electric bike customer can exchange an exhausted battery for 1=4 the price of a
new battery, or around 100 RMB ($14.30) in 2008, which is a significant amount of money in most Chinese cities. The used
batteries are then collected from service centers and sent to formal and informal lead recycling facilities. This informal sys-
tem could increase the average recycling rate of all lead acid batteries relative to published estimates. Interviews with fac-
tory owners estimate that 85–100% of electric bike batteries are recycled.2 Recycling practices and technology have also
improved dramatically and several Chinese smelters are adopting advanced technology to minimize loss.
The values in Table 2 were generated using the loss rates from Fig. 1. The proportion of recycled material that contributes
to the content of a battery is dependent on previous years’ recycling rates and the growth rate of lead demand (15–20%) (Chi-
na Data Online, 2007). It is assumed that all new demand is met by virgin lead production. Additionally, all lead that is lost to
the environment due to recycling is also met by virgin production. The maximum amount of recycled content in lead acid
batteries, assuming 100% recycling rates, would be about 60% (considering loss rates from previous time periods and
2
Interview with factory owners and managers May 15–18, 2006.284 C.R. Cherry et al. / Transportation Research Part D 14 (2009) 281–290
Fig. 1. Lead flows and losses from lead acid battery production in China (derived from Mao et al., 2006).
Table 2
Lead losses to the environment by vehicle.
Vehicle type (battery lead weight) Bicycle style electric Scooter style electric Motorcycle (1.7 kg) Bus (90 kg) Car (14 kg)
bike (10.3 kg) bike (14.7 kg)
Lead acid battery losses (kg per battery)
Recycle rate (%) 90 100 90 100 90 100 90 100 90 100
Mining and concentration loss (primary) 1.2 1.1 1.7 1.5 0.19 0.17 10.2 9.2 1.6 1.4
Smelt loss (primary) 0.4 0.4 0.6 0.6 0.07 0.06 3.8 3.4 0.6 0.5
Smelt loss (secondary) 0.9 1.0 1.3 1.4 0.14 0.16 7.7 8.5 1.2 1.3
Manufacture loss 0.5 0.5 0.7 0.7 0.08 0.08 4.3 4.3 0.7 0.7
Total production emissions 3.0 2.9 4.3 4.2 0.49 0.48 26.1 25.4 4.1 4.0
Solid waste 1.0 0.0 1.5 0.0 0.17 0.00 9.0 0.0 1.4 0.0C.R. Cherry et al. / Transportation Research Part D 14 (2009) 281–290 285
increased demand). The bottom two rows of Table 2 show production emissions, or the sum of all emissions from mining,
smelting and manufacturing; and the solid waste emissions, or lead lost due to battery disposal. It should be noted that
losses during the primary production processes (mining, concentration, and smelting) all occur at localized mining facilities
and losses (solid and liquid) are often contained to some extent in tailings and slag, reducing, but not eliminating, exposure
to the emitted lead. Secondary smelting and manufacture losses are much more distributed and potentially less contained.
However, the recycling rate does not significantly improve loss rates during the production processes, as the loss rates
during the secondary smelting process are nearly as high as the loss rates during the primary concentration and smelting
processes, resulting in low returns. Of course, the biggest gain in improving the recycling rate the removal of lead waste from
the solid municipal waste stream.
An often cited estimate of battery life in electric bikes is up to 300 recharge cycles or 10 000 km. If 90% of lead is recycled,
this results in the emission of 400 mg/km of lead for BSEBs and 580 mg/km of lead for SSEBs. It is worth noting that electric
bike lead loss rates are significantly higher than other vehicles because electric bike batteries require replacement every 1–2
years, or 10 000 km at best. Other vehicles require replacement less frequently, so that more kilometers of travel are used
between replacements, reducing the rate of lead loss.
2.3. Use phase
2.3.1. Electric bikes
Electric bikes are recharged by plugging into standard wall outlets. With their increased popularity, many apartments or
workplaces are retrofitting bicycle parking areas to accommodate electric bikes by providing electrical outlets for recharging
batteries, which require about 6–8 h to charge. Moreover, charging electric bikes at night can increase the efficiency of the
electric power generation network because excess electricity production capacity can be used to charge batteries that will be
used during the day, when electricity demand is at its peak. This has the effect of smoothing the demand peak and could
potentially require little or no electricity generation capacity improvements.
A standard electric bike requires about 2.1 kWh/100 km.3 The generation of electricity for electric bike use emits several
types of conventional pollutants and greenhouse gases depending on the mix of fuels used for generation.
In China, the energy mix is 75% coal, 15% hydro, 8% gas and 2% nuclear (National Bureau of Statistics, 2007). While
most of China’s electricity is generated by coal power plants, the actual energy mix of a city depends on its region, with some
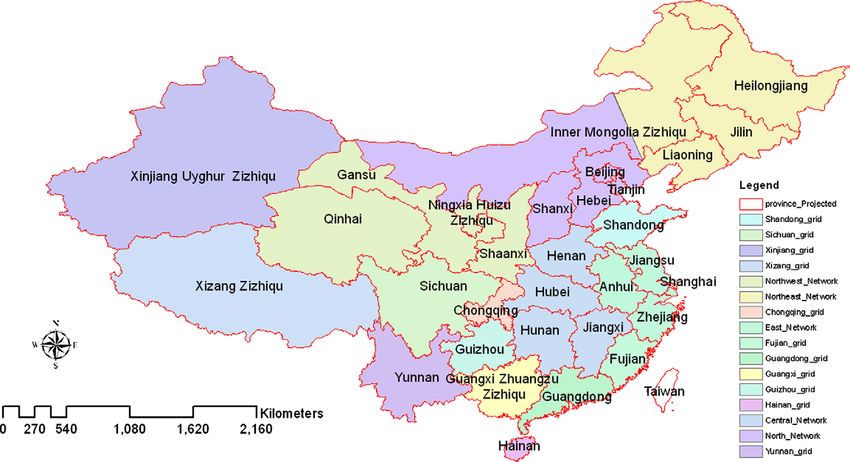
regions relying on greater than 50% hydropower. China consists of 15 regional power grids that have limited levels of con-
nectivity (Zhu et al., 2005) (Fig. 2). Each of these grids has different energy mixes and each city within a power grid receives
most of its electricity from the grid in which it is located. Currently, there is little transfer of electricity between regional
grids.
To calculate the regional electricity generation emission factors, the emission inventory by sector across China was ex-
tracted from the NASA INTEX database (Argonne National Lab, 2006). Given a regional distribution of emissions, one can
sum all emissions in a power grid and divide by the electricity generation in that grid to calculate emission rates (T/GWh)
of various pollutants. With this information, Table 3 was produced, showing the emission rates (g/100 km) of electric bikes
operating in various power grid networks. The CO2 emissions were estimated in a similar manner using data from the CARMA
online database (CARMA, 2007).
Power plant emissions, like all emissions from electric bikes are non-local. Power plants are distributed throughout the
country and serve specific population centers. Exposure to most pollutants decreases significantly as population centers are
located away from thermal power generating stations (Zhou et al., 2006). Decreased exposure to these pollutants could result
in significant public health benefits compared to modes (e.g., motorcycles and buses) with the same emission rates in urban
areas.
2.3.2. Motorcycle
There is little information related to empirically measured motorcycle emission rates in the developing world. However, a
recent report outlines the current state of worldwide motorcycle emission rates (Meszler, 2007). Table 4 shows estimated
motorcycle emission rates, coupled with China’s motorcycle emission standards which are far below the Meszler’s estimated
emission rates. This discrepancy could be because motorcycles in China have much smaller displacement engines and thus
lower emission rates. China’s two-stroke motorcycle stock has been declining over the past decade to less than 15% of the
motorcycle fleet (Wang, 2001). Because of the reduced share of two-stroke motorcycles, this section will focus on four-stroke
emissions. Based on field observations and literature, the assumed fuel efficiency of motorcycles and scooters is 3 L/100 km.
2.3.3. Bus
The energy use and emissions from the use phase of a bus constitute a majority of the environmental impacts of the life
cycle. This is because the vast majority of buses in China use diesel internal combustion engines. Local emissions, greenhouse
gas emissions, and energy use are highly related to fuel efficiency, vehicle power, vehicle loading, operating modes, and fuel
3
Considering efficiency losses in the battery charger, it is estimated that an electric bike could require up to, 1.8 kWh/100 km, from ‘plug-to-wheel’.
Moreover, there are transmission losses and in-plant use losses that are on the order of 12–14% of the energy produced with some estimates indicating that the
actual transmission loss rates might be twice those reported by the official statistics (National Bureau of Statistics, 2007). The official numbers are used.286 C.R. Cherry et al. / Transportation Research Part D 14 (2009) 281–290
Fig. 2. Electric power grid networks in China.
Table 3
Region-specific emission rates of typical SSEB electric bike.
Network name CO NOX PM 10 PM 2.5 SO2 VOC CO2 (g/km)
(g/100 km except CO2)
Hainan grid 0.87 3.43 0.56 0.31 7.41 0.35 22.7
Guangdong grid 0.70 2.53 0.72 0.43 4.25 0.28 18.9
Fujian grid 1.14 3.83 1.25 0.75 5.15 0.46 19.1
Xinjiang grid 1.34 6.21 1.32 0.76 7.32 0.53 27.3
Yunnan grid 1.53 5.81 1.34 0.76 14.05 0.62 18.1
East network 1.50 5.59 1.37 0.81 9.26 0.61 21.8
Guangxi grid 0.86 3.53 1.37 0.85 12.38 0.35 19.7
Shandong grid 1.64 6.42 1.46 0.87 16.75 0.66 25.6
Sichuan grid 1.56 6.41 1.77 1.05 23.24 0.63 15.8
North network 1.84 7.18 1.78 1.06 15.27 0.74 24.8
Chongqing grid 1.54 6.41 1.82 1.08 20.36 0.62 26.7
Guizhou grid 2.10 8.02 2.02 1.19 39.37 0.85 18.9
Central network 2.18 8.55 2.20 1.32 17.13 0.88 18.3
Northwest network 1.84 6.76 2.29 1.33 15.79 0.74 21.3
Northeast network 2.28 9.35 3.07 1.86 10.23 0.92 23.0
Weighted average 1.65 6.38 1.72 1.02 13.03 0.67 21.5
Table 4
Motorcycle emission rates (g/km) (Meszler, 2007).
Engine type CO CO2 VOC (HC) (exhaust and evap) NOX HC + NOX SO2 PM
2 stroke 18 40 16.75 0.05 0 0.5
4 stroke 12.5 55 2.25 0.15 0 0.1
China’s 2005 motorcycle emission standard
50 cc 1 1.2
quality. Because of these factors, most buses have very different emission rates. The diesel powered buses examined here use
about 45 L of diesel fuel per 100 km (Volvo, 2006). The tailpipe emissions are highly related to the sulfur content of the fuel.
Likewise, carbon monoxide emission rates increase with increased sulfur content. Conversely, increased sulfur contentC.R. Cherry et al. / Transportation Research Part D 14 (2009) 281–290 287
Table 5
Emission factors of urban buses (g/km).
Euro IIa Volvo-Sunwinb MEXc ARBd (Air Resource VTTe (Nylund and Average Per-cap emissionsf
(Volvo, 2006) Board, 2001, 2002) Erkkilä, 2005) value (g/Pax-km)
CO 6.66 1.91 19.3 4.43 1.5 7.97 0.159
CO2 1175 1299 1350 1275 25.490
HC 1.832 0.314 0.156 0.213 0.2 0.728 0.015
NOX 11.66 11.12 12.27 9.96 14 13.51 0.270
SO2 0.073 0.073 0.0015
PM 0.416 0.257 1.57 0.888 0.2 0.769 0.015
a
Euro II emission standards converted from g/kWh to g/km by using conversion factor that is the product of the engine efficiency (%), fuel energy density
(kWh/L), and fuel economy of vehicle (L/km). For the Volvo-Sunwin city bus, this is a factor of 1.67. Others report a factor of 1.8 (Nylund and Erkkilä, 2005).
b
Values adjusted from EPD document to reflect lower fuel economy than reported and multiplied emissions by ratio of Euro II standards to Euro III
standards to reflect lower fuel quality and emission technology.
c
Used values presented for 12 m Volvo city bus using diesel fuel with a sulfur content of 350 ppm.
d
Used average values for mid-1990s bus fleet in the EMFAC2000 and speed adjusted EMFAC2001 models.
e
Euro II technology operating on diesel fuel with 50 ppm sulfur content. Because of this, CO and PM rates are likely lower than buses in China and NOX
and HC rates are likely higher than buses in China.
f
Assumes an average load factor of 50 passengers.
reduces Nitrogen Oxide and Hydrocarbon emission rates. All of China’s diesel fuel requires a maximum sulfur concentration
of 2000 ppm. Major cities like Shanghai and Guangzhou have adopted more stringent 500 ppm standards and Beijing has
adopted 350 ppm standards. In 2002, China officially adopted Euro II heavy duty diesel exhaust standards and these are
thought to be an optimistic estimate of current bus emission rates. Shanghai and Beijing have more recently adopted Euro
III heavy duty diesel exhaust standards. Although the authors found no empirical studies of emission rates of buses operated
in China, several studies report bus emission rates for Euro II–III emission technology ranges with different fuel qualities.
These rates are reported in Table 5.
3. Results-emission rates during production and use phases
The life cycle emissions of bus, motorcycle, bicycle, and electric bike differ greatly as a result of their different material
inventories, fuels, and usable lifespan. Buses use more energy and emit more air pollution – several orders of magnitude
higher than bicycles or electric bikes over their life cycle, but they also carry more passengers and travel more kilometers.
Combining production and use phase emissions, partial life cycle emission rates of various vehicles in China are shown in
Table 6. For electric bikes, this table includes the average emission factors of all Chinese power plants. Emission rates are
geographically distributed across the different power sectors, implying that an electric bike’s environmental performance
could be better or worse in cleaner or dirtier grids.
Table 6 also includes estimates from a life cycle inventory of a typical four-door sedan style passenger car that was com-
pleted in the United States in the mid 1990s (Sullivan et al., 1998). These numbers can cautiously be compared with the other
modes because the emission technology of a vehicle made in the United States is similar to that of a vehicle made in China
today. That is, to the extent that most life cycle impacts of a car occur during the use phase suggests that this comparison
could be appropriate. The assumed fuel economy of this car (city and highway) is 10.2 L/100 km, about 10% lower than 2005
Table 6
Emission rates per passenger kilometer of production and use phases of life cycle.a,b
Energy use CO2 SO2 PM CO HC NOX Pbc
(kWh/100 pax-km) (g/pax-km) (g/pax-km) (g/pax-km) (g/pax-km) (g/pax-km) (g/pax-km) (mg/pax-km)
Card 47–140 102–306 0.23–0.69 0.09–0.28 3.4–10.1 0.57–1.67 0.44–1.32 18–53
Bus 8.7–26.2 24.2–96.8 0.01–0.04 0.04–0.14 0.08–0.32e 0.008–0.030e 0.14–0.54e 1–4
Motorcycle 21–42 64–128 0.04–0.08 0.20–0.40 6.3–12.5e 1.13–2.25e 0.08–0.15e 16–32
Bicycle 4.88 4.70 0.01 0.06 Unkn Unkn Unkn 0
Bicycle style electric bike 3.8–7.6 15.6–31.2 0.07–0.14 0.07–0.14 0.007–0.014e 0.027–0.053e 0.010–0.020e 145–290
Scooter style electric bike 4.9–9.9 20.2–40.5 0.09–0.17 0.10–0.19 0.009–0.017e 0.032–0.064e 0.014–0.027e 210–420
Note: (a) some fields are Unknown (Unkn) because data are not available for the emission of these pollutants from production processes and/or power plant
emissions, (b) different vehicles have different impacts on congestion, with cars being the least efficient and buses being the most space efficient forms of
mobility. Increasing congestion will yield higher emissions per km. The above emission factors assume generally uncongested city driving cycles.
a
Assuming lifespan of 197 000 km, 1 000 000 km, 20 000 km, 60 000 and 50 000 km for car, bus, bicycle, motorcycle and electric bike, respectively.
b
Ranges indicate assumed average load factors of 1–3 pax for car; 25–75 pax for bus; 1 pax for bicycle; 1–2 pax for motorcycle; and 1–2 pax for electric
bike. Notably, multiple passengers on e-bikes are illegal in many cities and energy use requirements are raised, which is not accounted for here.
c
Assuming 100% recycle rate and one battery every 10 000 km for electric bikes and one battery every 3 years or 250 000 km for buses, one battery every
3 years or 75 000 km for car, one battery every 3 years or 18 000 km for motorcycle (Wang et al., 2006).
d
Sullivan et al. (1998)-LCA of Generic US Car (cautiously compare due to different methodology).
e
Only use phase emission rate, no production processes included.288 C.R. Cherry et al. / Transportation Research Part D 14 (2009) 281–290
fuel economy standard for a Chinese vehicle in this class. This vehicle also weighs 1532 kg, on the upper end of the Chinese
passenger car weight spectrum (Sauer and Wellington, 2004).
The bicycle energy use component includes ‘energy’ required by pedaling the bicycle, though this energy is very different
in form and transferability between modes, which could make for a contentious comparison. This does not include food pro-
duction, as some analysts have suggested that the life cycle energy requirements of bicycles are higher than other modes,
when one considers the impacts of food required to provide additional calories that are burned during the bicycle use. Con-
trary to this, Bell et al. (2002) showed that those who switch from bicycling to a motorized mode have a higher incidence of
obesity, indicating that they maintain their calorie intake but reduce exercise. This shows that there is not a one-to-one rela-
tionship between bicycling energy requirements and calorie intake. Nonetheless, there are clear public health benefits from
bicycle riding.
Another important note is that the bus emission rates shown in Table 6 consider the operation emission along a bus route,
which is often longer than a more direct path taken by personal modes of transportation. Because of this, the emission rates
of buses below should be compared to personal modes with caution, and personal modes will perform relatively better than
the table implies because they make the most efficient route choice. Routing analysis done for Kunming and Shanghai indi-
cate that buses take a route that is 10% longer than the shortest route, implying 10% higher emissions per kilometer than
those reported in Table 6. The table also shows ranges of emission rates that reflect different passenger loading assumptions,
detailed in the notes.
While bicycles are the most non-polluting and energy efficient mode, electric bikes outperform other modes on almost all
metrics. Electric bikes have higher emission rates of SO2 than all motorized modes, with the exception of the car, because
electric bikes derive their power predominately from coal. Compared to a bus, electric bikes still have lower average energy
use and comparable greenhouse gas and NOX emissions. Compared to a motorcycle, electric bikes are much more energy effi-
cient and have orders of magnitude fewer emissions of most pollutants. Bicycles, on the other hand, outperform all modes in
terms of environmental impacts.
Lead pollution of electric bike battery production and disposal processes are two orders of magnitude higher than buses,
on a per passenger kilometer basis. Unleaded gasoline and diesel do contain some naturally occurring lead, so the tailpipe
lead emissions from buses and cars are not zero. In the United States, lead quantities are restricted to a maximum of
13 mg/L (Lankey et al., 1998). The naturally occurring lead content in Chinese gasoline is unknown. If gasoline and diesel
have the US level of lead, then the tailpipe emissions will be on the order of 1 mg/km for cars and 0.1 mg/passenger-km
for buses with 50 passengers. These rates of tailpipe lead emissions are dominated by the rates of lead emissions from bat-
tery production and disposal processes and are not included in the analysis.
While electric bikes have some higher emission rates on some criteria pollutants, they perform well to some extent (with
the exception of lead) against the two most efficient and sustainable modes we know of, bus and bicycle. Compared to other
motorized modes that electric bikes could potentially displace (motorcycles or cars), electric bikes perform very well.
3.1. Distribution of environmental impacts
All modes require different proportions of their life cycle impacts during different phases in the life cycle. Internal com-
bustion engine vehicles (buses and cars) consume most of their energy and emit most of their pollutants during the use
phase, so most of their impacts are local. Electric bikes are efficient energy users, so the use phase constitutes a smaller por-
tion of the life cycle impacts. Moreover, they have zero tailpipe emissions, so the use phase results in regional and national
pollution impacts from power plants. These power plant emissions can have trans-boundary effects and impact populations
in other nations as well, particularly in the case of small particles (which have long transport ranges) and in areas close to
national borders. A larger portion of electric bike life cycle impacts are imposed on non-local communities, where production
processes occur. Bicycles impose almost all of their life cycle impacts on industrial communities, as opposed to the users’
communities, because almost all of their impacts are incurred during the production phases. Electric bikes perform well
on global greenhouse gas emissions compared to most alternatives, resulting in fewer global consequences of use than other
motorized modes.
3.2. Public health impacts of lead pollution
The exposure pathways of lead are largely unknown and people are exposed from a number of sources, including air, con-
tact with solid waste, and water. Lead is a neurotoxin and children are the most adversely affected by lead poisoning, causing
a high incidence of developmental disorders, low IQ and even premature mortality, to name a few. Unfortunately, it is dif-
ficult to estimate exposure to lead pollution in the same way as traditional air pollutants because lead enters the environ-
ment in many different forms. Because exposure pathways vary depending on the source of pollution, most lead exposure
tests are done based on blood lead tests. High levels of exposure can be estimated if blood levels are above certain thresholds.
There have been few lead exposure and public health impact studies in China related to battery production (Wang and
Zhang, 2006), and it is difficult to quantify the public health impacts of such large releases into the environment as shown
in Table 2. On the other hand, a recent study showed that 56% of all Asian anthropogenic lead emissions during the mining
and manufacture phases are in mine tailings (Mao et al., 2008b). Well designed tailing facilities can reduce exposure by
reducing lead entry into water and soil in surrounding communities.C.R. Cherry et al. / Transportation Research Part D 14 (2009) 281–290 289
Perhaps the most problematic phase of the lead battery production process is primary and secondary smelting of lead
concentrate and scrap, particularly to the extent that the informal sector captures a large share of the scrap recycling market.
Informal loss rates can exceed 50% (Hoffmann and Wilson, 2000). Some studies in other Southeast Asian countries suggest
that lead levels in neighborhoods surrounding lead recycling plants suffer from significantly higher lead exposure (Cortes-
Maramba et al., 2003). Anecdotally, there was a recent uprising of local residents that caught international attention at the
factory of one of the largest electric bike battery producers (about 25% of the market4) following hundreds of children’s hos-
pitalizations because of lead poisoning from the factory (Zhang and Shao, 2005). Short of doing a public health study of blood
lead levels in communities neighboring lead mines, smelters, battery producers and recyclers, it is difficult to quantify public
health impacts of lead acid battery use in China. Based on the high life cycle emission rates, 10–20 times higher than tailpipe
emissions from leaded fuel, the public health impacts are likely significant and should be remediated.
4. Conclusion
When developing environmental policy on electric bikes, it is important to perform a comparative analysis with other
modes of transportation that are in an electric bike rider’s choice set. Electric bikes should be encouraged to the extent that
they displace car or motorcycle use. The authors’ previous work shows that the majority of electric bike users are previous
bus or bike riders (depending on the city) and would use a bus or bike in the absence of an electric bike. The electric bike
performs well in terms of environmental impacts compared to the bus and the motorcycles. Electric bike SO2 emissions
are considerably higher (because of high sulfur coal), but other pollutants are lower than or on the same order of magnitude
of bus emissions. When calculating emissions from electricity generation, it is important to consider the region in which pol-
icy is being developed and the influence of energy mix on the emission rates of electric bikes. Generally, provinces in south-
ern China have lower emission rates than provinces in the north, because of their reliance on cleaner power generation, such
as hydropower.
By far, the biggest environmental reservation associated with electric bikes is Pb pollution. The Pb emissions from battery
use reported in this study are not ‘tailpipe’ emissions for any mode, but rather emissions from production, recycling and dis-
posal processes of batteries, spread over the life cycle of the vehicle. Lead emissions per passenger kilometer are several or-
ders of magnitude higher for electric bikes than for buses, primarily because buses use fewer (although heavier) batteries
during their life cycle and get much more passenger mileage from each battery.
Lead acid batteries are not necessary for electric bike operation. Commercially available alternative technologies, such as
nickel metal hydride (NiMH) and lithium-ion (Li-ion) batteries are much more expensive, but also have much higher energy
densities, so battery weight can be reduced by more than half. A Li-ion battery that is equivalent (in power) to lead acid
would cost about four times more than a lead acid battery; however, it is likely to have two to three times the lifespan;
so while the actual life cycle cost is still higher, it begins nearing that of lead acid batteries. Ultimately, regulation of lead
acid batteries would hasten the transition to cleaner battery technologies, reducing the environmental load of the millions
of lead acid batteries entering the electric bike market yearly.
Acknowledgements
This work was funded by the Asian Development Bank, Clean Air Initiative-Asia, Sustainable Urban Mobility Asia Pro-
gram; The Volvo Foundation; and the Institute of Transportation Studies-UC Davis. The authors wish to thank Robert Cerve-
ro, Adib Kanafani, Dan Sperling, Herbert Fabian and Sophie Punte for assistance in this research as well as several reviewers.
Finally, the authors would like to thank Luke Jones and Jada Husky, along with the anonymous referees for their valuable
comments.
References
Air Resource Board, 2001. Heavy Duty Truck Emission Factors Development – Section 10. Report, ARB, Sacramento.
Air Resource Board, 2002. Urban Diesel Transit Bus Emission Inventory: Appendix E. Report, ARB, Sacramento.
Argonne National Lab, 2006. 2006 Asia Emissions for INTEX-B. (accessed 26.12.07).
Bell, A.C., Ge, K.Y., Popkin, B.M., 2002. The road to obesity or the path to prevention: motorized transportation and obesity in China. Obesity Research 10 (4),
277–283.
CARMA, 2007. Carbon Monitoring for Action. (accessed 20.12.07).
Cherry, C., Cervero, R., 2007. Use characteristics and mode choice behavior of electric bike users in China. Transport Policy 14, 247–257.
Cherry, C., Weinert, J.X., Yang, X.M., 2008. Electric Bikes in the People’s Republic of China (PRC) – Impact on the Environment and Prospects for Future
Growth. Clean Air Initiative-Asia. Report TA 6144 (REG) November 2008.
China Central Government, 1999. General Technical Standards of E-Bike (GB17761-1999) from National E-Bike Compelling Standards.
China Central Government, 2004. National Road Transportation Law.
China Data Online, 2007. China Yearly Industrial Data. (accessed 8.6.07).
CHR Metals, 2008. World Lead: Recent Developments in China’s E-Bike Market. Report. May 2, 2008.
Cortes-Maramba, N.P., Panganiban, L.R., Castillo, E.S., Dioquino, C.C., Francisco Rivera, A.T., 2003. Health and environmental assessment among residents of a
community near a battery recycling plant. Journal de Physique IV 107, 809–821.
Fairley, P., 2005. China’s cyclists take charge. IEEE Spectrum 42, 55–59.
4
Based on an interview with a company manager on 4/16/2006 at the Shanghai Bike Expo.290 C.R. Cherry et al. / Transportation Research Part D 14 (2009) 281–290
Hoffmann, U., Wilson, B., 2000. Requirements for, and benefits of, environmentally sound and economically viable management of battery recycling in the
Philippines in the wake of Basel convention trade restrictions. Journal of Power Sources 88, 115–123.
Jamerson, F.E., Benjamin, E., 2007. Electric Bikes Worldwide Reports – 20,000,000 Light Electric Vehicles in 2007. Report eighth ed. May 2007.
Lankey, R.L., Davidson, C.I., McMichael, F.C., 1998. Mass balance for lead in the California south coast air basin: an update. Environmental Research, Section A
78, 86–93.
Lave, L.B., Hendrickson, C.T., McMichael, F.C., 1995. Environmental implications of electric cars. Science 268, 993–995.
Lawrence Berkeley National Laboratory, 2004. China Energy Databook 6.0.
Mao, J., Dong, J., Graedel, T.E., 2008b. A multilevel cycle of anthropogenic lead: II. Results and discussion. Resources, Conservation and Recycling 52, 1050–
1057.
Mao, J., Lu, Z.W., Yang, Z.F., 2006. The eco-efficiency of lead in China’s lead–acid battery system. Journal of Industrial Ecology 10, 185–197.
Meszler, D., 2007. Air Emissions Issues Related to Two and Three-Wheeled Motor Vehicles. International Council on Clean Transportation, Washington, DC.
National Bureau of Statistics, 2007. China Statistical Yearbook. Report.
Nylund, N.O., Erkkilä, K., 2005. Bus Emission Evaluation: 2002–2004 Summary Report. VTT Processes. Report PRO3/P3015/05.
Roberts, H., 2006. Key issues facing China’s lead producers and consumers and implications for markets elsewhere. In: 10th European Lead Battery
Conference, Athens.
Sauer, A., Wellington, F., 2004. Taking the High (Fuel Economy) Road. World Resources Institute. Report. November 2007.
Sullivan, J.L., Williams, R.L., Yester, S., Cobas-Flores, E., Chubbs, S.T., Hentges, S.G., Pomper, S.D., 1998. Life Cycle Inventory of a Generic US Family Sedan
Overview of Results USCAR AMP Project. In: SAE Total Life Cycle Conference, Society of Automotive Engineers Paper #982160, pp. 1–14.
Volvo, 2006. Environment Product Declaration-Volvo 8500 Low-Entry. Report.
Wang, M., Huo, H., Johnson, L., He, D., 2006. Projection of Chinese Motor Vehicle Growth, Oil Demand, and CO2 Emissions through 2050. Argonne National
Lab. Report ANL/ESD/06-6.
Wang, S., Zhang, J., 2006. Blood lead levels in children, China. Environmental Research 101, 412–418.
Wang, S.Q., 2001. Efforts to Reduce Motorcycle Emission in PRC. Reduction of Emissions from 2–3 Wheelers, Hanoi, Vietnam, Asian Development Bank,
Washington.
Weinert, J.X., Ma, C.T., Cherry, C., 2007a. The transition to electric bikes in China: history and key reasons for rapid growth. Transportation 34, 301–318.
Weinert, J.X., Ma, C.T., Yang, X.M., Cherry, C., 2007b. The transition to electric bikes in China: effect on travel behavior, mode shift, and user safety
perceptions in a medium-sized city. Transportation Research Record 1938, 62–68.
Zhang, J., Shao, X., 2005. Farmers Protest Over Alleged Lead Poisoning. China Daily.
Zhou, Y., Levy, J.I., Evans, J.S., Hammitt, J.K., 2006. The influence of geographic location on population exposure to emissions from power plants throughout
China. Environment International 32, 365–373.
Zhu, F.H., Zheng, Y.F., Guo, X.L., Wang, S., 2005. Environmental impacts and benefits of regional power grid interconnections for China. Energy Policy 33,
1797–1805.You can also read