Treatment With Lipopolysaccharide Induces Distinct Changes in Metabolite Profile and Body Weight in 129Sv and Bl6 Mouse Strains - Frontiers
←
→
Page content transcription
If your browser does not render page correctly, please read the page content below
ORIGINAL RESEARCH
                                                                                                                                                published: 27 March 2020
                                                                                                                                          doi: 10.3389/fphar.2020.00371

                                           Treatment With Lipopolysaccharide
                                           Induces Distinct Changes in
                                           Metabolite Profile and Body Weight
                                           in 129Sv and Bl6 Mouse Strains
                                           Maria Piirsalu 1,2*, Egon Taalberg 2,3, Kersti Lilleväli 1,2, Li Tian 1,2, Mihkel Zilmer 2,3
                                           and Eero Vasar 1,2
                                           1 Department of Physiology, Institute of Biomedicine and Translational Medicine, University of Tartu, Tartu, Estonia, 2 Center

                                           of Excellence for Genomics and Translational Medicine, University of Tartu, Tartu, Estonia, 3 Department of Biochemistry,
                                           Institute of Biomedicine and Translational Medicine, University of Tartu, Tartu, Estonia

                                           Mouse strains differ significantly in their behaviors and responses to pathogenic and
                                           pharmacological agents. This study seeks to characterize behavioral and metabolomic
                                           profiles of two widely used mouse lines, 129S6/SvEvTac (129Sv) and C57BL/6NTac (Bl6),
                             Edited by:
                        Ulrike Garscha,    to acute administration of lipopolysaccharide (LPS). LPS caused a significant suppression
     Friedrich Schiller University Jena,   of locomotor activity and a decline in body weight (BW) in both strains within 24 h.
                               Germany
                                           However, the BW loss was more pronounced in Bl6 than in 129Sv. Comparison of strains
                       Reviewed by:
                                           revealed clear differences between their metabolomic profiles. According to the general
               Sander Michel Houten,
         Icahn School of Medicine at       linear model analysis (GLM), the 1.5 h LPS challenge in Bl6 caused a decrease of
          Mount Sinai, United States       propionylcarnitine (C3), glucogenic amino acids, and acetylornithine (Ac-Orn), whereas
            Julian Aurelio Marschner,
 Hospital of the University of Munich,     the response of 129Sv included decreased concentrations of short-chain acylcarnitines
                             Germany       (SCACs), citrulline, and elevation of glycerophospholipid (PCaa C42:0) and sphingolipid
                  *Correspondence:         [SM(OH)C16:1]. 24 h after LPS administration, robust alterations in lipid profile were
                          Maria Piirsalu
                                           observed in both strains. LPS treatment caused elevation of sphingolipids,
             maria.piirsalu@gmail.com
                                           phosphatidylcholine diacyls (PCaa) as well as a decrease in lysophosphatidylcholines
                   Specialty section:      (LysoPC). However, the number of elevated PCaa and sphingolipids was considerably
         This article was submitted to
                                           higher in 129Sv. In addition to lipids, 24 h LPS challenge in Bl6 mice induced increased
         Inflammation Pharmacology,
               a section of the journal    levels of kynurenine (KYN), putrescine and decreased levels of citrulline, hexoses, Ac-Orn,
            Frontiers in Pharmacology      and PC acyl-alkyl (PCae 38:2) as well as severe BW loss. In contrast, the 24 h LPS
         Received: 10 January 2020         challenge in 129Sv mice induced increased levels of KYN, long-chain acylcarnitines
          Accepted: 11 March 2020
         Published: 27 March 2020
                                           (LCACs) and decreased levels of citrulline as well as moderate BW loss. Altogether, our
                            Citation:
                                           study revealed both similarities and differences in response to LPS in Bl6 and 129Sv
    Piirsalu M, Taalberg E, Lilleväli K,   strains. For major differences, Bl6 mice showed stronger reduction of BW 24 h after LPS
 Tian L, Zilmer M and Vasar E (2020)
                                           treatment, accompanied by significantly reduced levels of hexoses, the ratio between
  Treatment With Lipopolysaccharide
          Induces Distinct Changes in      LysoPC16:1/LysoPC16:0, and elevated levels of neuroprotective putrescine. In 129Sv
Metabolite Profile and Body Weight in       mice, the BW loss was milder, accompanied by increased levels of hydroxylated LCACs,
       129Sv and Bl6 Mouse Strains.
            Front. Pharmacol. 11:371.
                                           probably reflecting shifts in oxidative metabolism of fatty acids. One may suggest that LPS
     doi: 10.3389/fphar.2020.00371         caused stronger hypometabolic state in the Bl6 mice than in the 129Sv strain. Altogether,

Frontiers in Pharmacology | www.frontiersin.org                                     1                                             March 2020 | Volume 11 | Article 371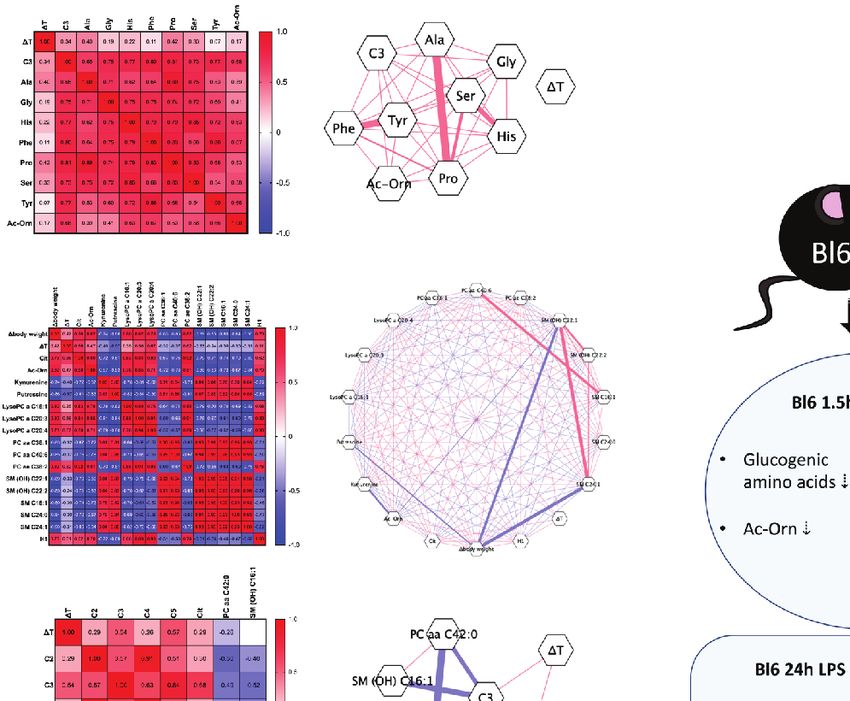
Piirsalu et al.                                                                                                  LPS Induced Metabolomic Changes

                                          this study confirms that Bl6 and 129Sv mice display vastly distinct adaptation capacities
                                          independent from the nature of stressful challenge.
                                          Keywords: lipopolysaccharide, 129Sv strain, Bl6 strain, metabolic profiling, inflammation, innate
                                          immunity, hypometabolism

INTRODUCTION                                                                metabolites in mice exposed to LPS have also been shown
                                                                            (Laiakis et al., 2012). Although rather widely studied, the effect
Majority of studies with transgenic mouse models involve the use            of systemic inflammation on blood plasma metabolites in
of inbred mouse strains, two of the most common being C57BL/                commonly used inbred mouse strains is poorly understood.
6NTac (Bl6) and 129S6/SvEvTac (129Sv). However, these two                   Thus, we undertook an extensive metabolome characterization
mouse strains differ significantly in several ways, including their          of the response to LPS in two commonly used inbred
responses to pharmacological and pathogenic agents. Bl6 mice                mouse strains.
actively cope in stressful situations, whereas the coping strategy              In order to explore the possible differences in coping with
of the 129Sv line is inherently passive. Prior environmental                inflammatory influences, we administered LPS, the activator of
enrichment in home cages amplifies the exploratory activity of               innate immune response, into mice of the two above-described
Bl6 mice in a novel and stressful environment (Abramov et al.,              strains. The effect of LPS (0.5 mg/kg) was studied on locomotor
2008), whereas in similar conditions, 129Sv mice display                    activity, body temperature, and BW. In addition, blood samples
increased anxiety and loss in BW (Abramov et al., 2008;                     were taken 1.5 and 24 h after the treatment with LPS in order to
Heinla et al., 2014). Bl6 line demonstrates increased                       measure the profile of blood metabolites. The obtained data
aggressiveness, extensive barbering behavior, and significant                enhance the knowledge pool of distinct coping strategies to
preference for alcohol (Belknap et al., 1993; Middaugh et al.,              stressful events in 129Sv and Bl6 mouse strains. Bl6 displays a
1999; Sarna et al., 2000; Heinla et al., 2014). In contrast, pain           significant hypometabolic response with reduced levels of
sensitivity of the 129Sv strain is significantly reduced compared            hexoses accompanied by robust BW decline 24 h after the
to the Bl6 mice (Võikar et al., 2004; Abramov et al., 2008). While          injection of LPS. In 129Sv mice, reduction of hexoses did not
cat odor elicits anxiety responses from Bl6 mice, it does not               occur, and the LPS challenge was accompanied by less severe BW
stimulate such responses from the 129Sv strain (Raud et al.,                loss and body temperature reduction. These different metabolic
2007). Acute treatment with amphetamine elicits different                   responses in 129Sv and Bl6 mice may explain their distinct
responses in these mouse strains, as well (Chen et al., 2007;               response to infections, like influenza. Altogether, this study
Vanaveski et al., 2018), and recent evidence links these                    confirms that Bl6 and 129Sv mice display vastly distinct
differences to a frameshift mutation in the 129Sv Disc1 gene                adaptation capacities independent from the nature of
(Mukaida et al., 1996), which causes alterations in dopamine                stressful challenge.
homeostasis and affects cognitive abilities (Koike et al., 2006;
Trossbach et al., 2016).
    We have recently found that 129Sv and Bl6 strains also differ
in the metabolite signatures in their blood samples (Narvik et al.,
                                                                            MATERIALS AND METHODS
2018). Acylcarnitine C5- is dominating in 129Sv mice, whereas               Animals
the metabolite signature of Bl6 contains three biogenic amines:             Wild-type male mice (16–23 week-old) from the two inbred
Ac-Orn, alpha-aminoadipic acid (alpha-AAA), carnosine, and                  strains, 129S6/SvEvTac (129Sv; n = 56) and C57BL/6NTac (Bl6,
LysoPC16:1. Moreover, the levels of hexoses tended to be higher             n = 56), were bred and housed in the Laboratory Animal Centre
in Bl6 mice compared to 129Sv, possibly allowing higher glucose             at University of Tartu. Mice were kept under standard conditions
availability for emerging metabolic needs (Narvik et al., 2018).            with unlimited access to food and water on a 12/12 h light/dark
These metabolic differences could be associated with the                    cycle (lights on from 07:00 to 19:00 h).
domination of active coping behavioral strategies in the Bl6
strain, requiring targeted metabolic expenses.
    Responses of 129Sv and Bl6 to pathogens also differ. For                LPS Treatment
example, infecting 129Sv mice with influenza virus causes strong             LPS (derived from E. coli serotype 0111:B4; Sigma–Aldrich, St.
inflammatory cytokine release, and the animals are more prone                Louis, MO, USA) was dissolved in 0.9% NaCl (saline). Injections
to die from infection (Davidson et al., 2014). In contrast, the             were administered intraperitoneally (i.p.) at a dose of 0.5 mg/kg.
inflammatory cytokine response in the Bl6 strain is modest, and              The vehicle consisted of 0.9% NaCl in an equivalent volume.
the animals effectively cope with the infection (Davidson                      Mice were randomly divided into three cohorts (Figure 1): 1)
et al., 2014).                                                              1.5 h LPS challenge cohort, containing mice sacrificed and trunk
    Immunological and behavioral responses to LPS in different              blood collected 1.5 h post-LPS or saline treatment (Bl6 saline, n =
inbred mouse strains have been investigated in several studies,             10; Bl6 LPS, n = 10; 129Sv saline, n = 10; 129Sv LPS, n = 10); 2)
which have shown differences between mouse strains (Mahieu                  24 h LPS challenge cohort, containing mice sacrificed and trunk
et al., 2006; Meneses et al., 2018). Drastic changes in urinary             blood collected 24 h post LPS or saline treatment (Bl6 saline, n =

Frontiers in Pharmacology | www.frontiersin.org                         2                                     March 2020 | Volume 11 | Article 371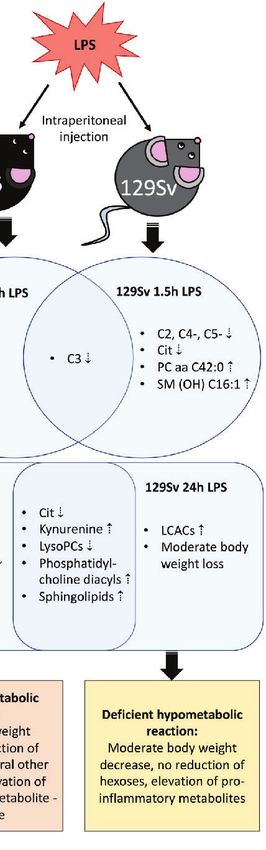
Piirsalu et al.                                                                                                                       LPS Induced Metabolomic Changes

  FIGURE 1 | Schematic overview of the experimental design. Male mice on a Bl6 (n = 56) and 129Sv (n = 56) background were used in this study. Mice from both
  strains were randomly assigned to three different experimental groups: cohort 1 was used to determine the effect of LPS on locomotor activity (Bl6 n = 16; 129Sv
  n = 16); cohort 2 was used to study the effect of LPS on the profile of blood metabolites after 1.5 h treatment (Bl6 n = 20; 129Sv n = 20); cohort 3 was used to
  study the effect of LPS on the profile of blood metabolites after 24 h treatment (Bl6 n = 20; 129Sv n = 20). In each cohort, both strains were further divided into two
  groups: LPS administration group and control group (saline administration).

10; Bl6 LPS, n = 10; 129Sv saline, n = 10; 129Sv LPS, n = 10);                           Sample Collection
cohorts 1 and 2 were used for metabolite measurements and                                Mice were euthanized by decapitation, and trunk blood was
placed back to their home cages after LPS i.p. injection; 3)                             collected into EDTA-coated microcentrifuge tubes and stored on
locomotor activity response group (Bl6 saline, n = 8; Bl6 LPS,                           ice. All the tubes were centrifuged at 2,000 g for 15 min at 4°C.
n = 8; 129Sv saline, n = 8; 129Sv LPS, n = 8). Locomotor activity                        Plasma supernatant was separated and stored at −80°C until
was registered during 24 h period after LPS administration.                              further analysis.
                                                                                         Measurement of Metabolites
                                                                                         AbsoluteIDQ™ p180 kit (BIOCRATES Life Sciences AG, Innsbruck,
Body Weight and Rectal Temperature                                                       Austria) was used to determine plasma levels of 186 different
Determination                                                                            compounds. Samples were measured on mass-spectrometry
Changes in body temperature were evaluated at 0 h, 1.5 h, and 24                         QTRAP 4500 (Sciex, Framingham, MA, USA), in combination
h post-LPS and saline i.p. injection. Body weight was measured                           with high-performance liquid chromatography (HPLC) (Agilent
before injection and 24 h post injection. Body temperature was                           1260 series, Agilent Technologies, Waldbronn, Germany).
measured using a rectal thermometer (TSE Technical &                                        The first stage of the sample preparation was carried out on
Scientific Equipment GmbH, Germany) by inserting a                                        AbsoluteIDQ Kit plate that was included in the test kit which had
lubricated rectal probe 2 cm into the rectum and maintained                              96 wells for accommodating zero-sample, three phosphate-
until stable readings could be obtained.                                                 buffered saline samples, seven calibration standards, and at
                                                                                         least three quality controls. The plasma samples were thawed
                                                                                         and centrifuged at 4°C for 5 min at 2,750 × g. In all the wells,
Locomotor Activity                                                                       except the well in A1 position, 10 ml of internal standard mix was
The effect of LPS on locomotor activity, reaction to novel                               added. After that 10 ml of calibration standards, phosphate-
environment, and anxiety-like behavior was monitored in                                  buffered saline, quality controls and plasma samples were
PhenoTyper ® (EthoVision 3.0, Noldus Information                                         transferred into their respective wells. In each well was added
Technology, Wageningen, The Netherlands). The Phenotyper                                 50 µl of 5% solution of phenyl isothiocyanate in pyridine/
testing consisted of 24 h trial where animals were individually                          ethanol/water (1:1:1, v/v/v) for amino acid derivatization.
housed in 30 cm × 30 cm × 35 cm plexiglass cages with sawdust                               After 20 min of incubation the plate was dried at room
bedding, similar to a home cage. Each animal had an individual                           temperature under dry airflow, and all the compounds were
cage. Mice had free access to food and water throughout the test.                        extracted into the solution using 300 µl 5 mM ammonium
Mice were kept under a 12:12 h light/dark cycle (lights off at                           acetate in methanol. After shaking for 30 min the plate was
19:00 h), similar to animal room standard conditions. Each cage                          centrifuged which filtered the extract into the underlying 96-well
was equipped with a top unit with integrated infrared sensitive                          capture plate through a filter membrane. From the capture plate
camera and infrared LED lights, which makes tracking possible                            50 µl of the solution was transferred to another 96-well plate and
in the dark phase. Open field arena was virtually divided into two                        diluted with 250 µl 40% (v/v) methanol in water for liquid
zones, central and peripheral zones. The center zone was defined                          chromatography (LC–MS) techniques. For flow injection
as half of the overall area of the test arena. Total distance                            analysis (FIA) 20 µl of the solution was transferred to another
travelled in the whole arena and central zone of the arena (cm)                          96-well plate and diluted using 380 µl FIA mobile phase solvent
was measured. Animal movements were continuously recorded                                which was prepared by diluting Biocrates Solvent I provided with
by video-tracking system.                                                                the kit in 290 ml HPLC grade methanol.

Frontiers in Pharmacology | www.frontiersin.org                                      3                                             March 2020 | Volume 11 | Article 371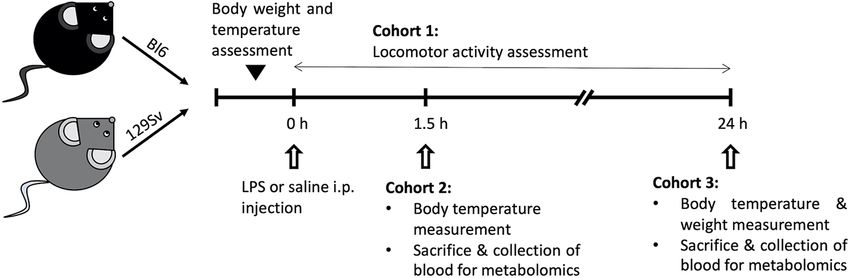
Piirsalu et al.                                                                                                 LPS Induced Metabolomic Changes

    Amino acids and biogenic amines in the samples were measured          in order to make the data correspond to normal distribution.
using the LC–MS techniques. Acylcarnitines (Cx:y), hexoses,               Results were analyzed using two-way ANOVA (strain ×
sphingolipids [SMx:y or SM (OH)x:y], glycerophospholipids                 treatment) followed by Bonferroni post hoc test. Both strains
[lysophosphatidylcholines (lysoPCx:y), and phosphatidylcholines           exhibited significant LPS-induced suppression in their
(PCaa x:y and PC ae x:y)] were measured using the FIA tandem              motor response in the 24-h period in the whole arena
mass spectrometry. For both modes of analyzing, Multiple Reaction         (treatment—F (1,23) = 49.19, p < 0.0001; Figures 2A–C).
Monitoring was used. Concentrations of the metabolites were               Additionally, LPS-exposed mice travelled significantly shorter
calculated automatically by the MetIDQ™software (BIOCRATES                distance in the central zone (treatment—F(1,23) = 28.30, p <
Life Sciences AG) in mM.                                                  0.0001) compared to their control counterparts (Figure 2D).
                                                                          However, when dividing 24 h cycle into lights-on and lights-off
Statistical Analysis                                                      periods, LPS-induced suppression of locomotor activity in the
Results are expressed as mean values ± SD. Statistical analyses for       center of the arena was only significant during the dark period
behavioral experiments, metabolomic data, body weight, and                (treatment—F(1,23) = 29.99, p < 0.0001; Figures 2E, F).
temperature were performed using GraphPad Prism 8 software.                   Difference in motor activity between Bl6 and 129Sv was
Shapiro–Wilk test was applied to assess the normality of data             observed within 2 h from the beginning of Phenotyper testing.
distribution. To normalize the distribution of locomotor and              The motor activity of the saline-treated 129Sv mice was
metabolomic data, logarithmic transformation (log10) of the               significantly lower compared to that of the saline-treated Bl6
values was preformed prior to data analysis. Body weight                  animals [strain—F(1,23) = 4.96, p = 0.04; treatment—F(1,23) =
(DBW) and temperature (DT) changes were expressed as                      13.87, p = 0.001; Figure 2G]. However, this difference was no
change of the initial weight and temperature (temperature                 longer evident from the third hour onward (Figure 2H). This
post-administration − temperature pre-administration; weight              observation could reflect higher anxiety-like trait of 129Sv in the
post-administration − weight pre-administration). Comparison              beginning of behavioral testing indicating passive adaptation.
of body weight and temperature change between saline and LPS                  Change in body temperature (DT) of Bl6 and 129Sv mice was
treatment groups was performed using two-way ANOVA                        evaluated 1.5 and 24 h post saline and LPS administration. Body
(strain × treatment for DBW; time × treatment for DT),                    temperature measurements were conducted with mice housed in
followed by Bonferroni post hoc test. To determine basal                  their home-cage environment. Groups were compared using
metabolite differences between Bl6 and 129Sv, saline treated              two-way ANOVA (time × treatment) followed by Bonferroni
control mice log10-data were compared using t-tests and                   post hoc test. Significant effect of time (F(1, 35) = 13.01 p =0.00096)
Bonferroni correction (p value less or equal to 0.0002).                  and treatment (F(1, 35) = 6.39 p =0.016) was observed in 129Sv.
Comparison of metabolomic data between groups was                         Comparison of groups demonstrated that DT of LPS treated mice
performed using two-way ANOVA (treatment × time)                          was slightly lower compared to that of saline treated controls in
followed by Bonferroni post hoc test. All differences were                both strains, although no statistically significant difference was
considered statistically significant at p < 0.05. General linear           established between the LPS and saline groups. However, there
model (GLM) multivariate analysis with a backward elimination             was a significant difference between 1.5 h and 24 h LPS response
procedure was performed to examine the associations between               in 129Sv. 24 h after LPS administration, the DT of 129Sv was
DBW, DT, metabolites, and their ratios in Bl6 and 129Sv mice.             significantly higher compared to 1.5 h LPS treatment, revealing
The associations between significantly altered metabolites, body           different LPS-induced thermoregulation in 1.5 and 24 h time
weight, and temperature change 1.5 h and 24 h after LPS                   points. In contrast DT of Bl6 mice was similar 1.5 and 24 h after
administration were analyzed using the Pearson correlation.               LPS administration (Figure 2I).
Applying Cytoscape software and the “MetScape” plugin tool,                   Two-way ANOVA (strain × treatment) demonstrated
the significant correlations (p > 0.05) were used to construct             significant difference in 24 h BW change (DBW) between the
correlation networks.                                                     LPS and saline treated mice in both strains. LPS administration
Ethics                                                                    induced a highly significant BW loss in both strains (Treatment:
All animal procedures were performed in accordance with the               F(1,36) = 175.8, p < 0.0001; Strain: F(1,36) = 20.18, p < 0.0001;
European Communities Directive (2010/63/EU) and permit (No.               strain × treatment: F(1,36) = 3.80, p = 0.06). However, LPS-induced
141, April 17, 2019) from the Estonian National Board of                  BW loss was substantially more prominent in Bl6 as they lost
Animal Experiments.                                                       12.1 ± 0.68% of BW during the 24-h time, whereas in 129Sv the
                                                                          decline was merely 7.6 ± 0.51% of the initial BW (Table 1).

RESULTS
                                                                          Metabolic Profile Differences of Bl6 and
LPS-Implicated Locomotor Activity, Body                                   129Sv
Temperature, and Weight Changes                                           To determine the basal differences in metabolic profile between
A single intraperitoneal injection of LPS (0.5 mg/kg) was                 Bl6 and 129Sv, saline treated control animals were compared
administered to Bl6 and 129Sv mice, and locomotor activity                using paired t-tests and Bonferroni correction (p value less or
was recorded for 24 h in Phenotyper cages. For the readings of            equal to 0.0002) as well as with the general linear model (GLM)
locomotor activity, original values were converted to log10 values        multivariate analysis.

Frontiers in Pharmacology | www.frontiersin.org                       4                                       March 2020 | Volume 11 | Article 371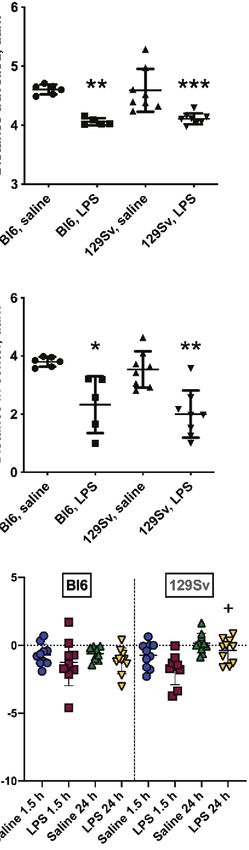
Piirsalu et al.                                                                                                                             LPS Induced Metabolomic Changes

                                A                                     B                                       C

                                D                                     E                                       F

                                G                                     H                                       I

  FIGURE 2 | Locomotor activity (log10 values, data expressed as mean ± SD) of Bl6 and 129Sv mice in the 24 h LPS challenge. (A) Total distance travelled in 24 h
  period. (B) Total distance travelled in lights-on period. (C) Total distance travelled in lights-off period. Center distance travelled in 24-h cycle (D), lights-on (E) and
  lights-off (F) periods. Distance travelled 2 h from the beginning (G) and on the third hour (H). * significant difference between LPS and saline administration groups
  (Bonferroni’s multiple comparisons): *p ≤ 0.05, **p ≤ 0.01, ***p ≤ 0.001; +significant difference between Bl6 and 129Sv mice in saline administration groups, +p ≤
  0.05. (I) Body temperature (DT) change 1.5 and 24 h after 0.5 mg/kg LPS administration in Bl6 and 129Sv. Values are represented as mean ± SD. Two-way ANOVA
  followed by Bonferroni post hoc test: + a significant difference between LPS treatment groups: +p < 0.05.

TABLE 1 | Body weight change (□BW) and weight loss % change of the initial weight (weight2 − weight1/weight1 × 100%) 24 h after 0.5 mg/kg LPS administration.

                       Saline Bl6               LPS Bl6               Saline 129Sv              LPS 129Sv                                  Two-way ANOVA
                      (Mean ± SD)             (Mean ± SD)             (Mean ± SD)              (Mean ± SD)                                     p-value

                                                                                                                         Strain          Treatment           Strain × Treatment

24 h DBW (g)           −0.50 ± 0.73         −3.44 ± 0.73****          −0.01 ± 0.40          −2.2 ± 0.52****+++         < 0.0001           < 0.0001                   0.06
24 h DBW (%)           −1.7 ± 2.49           −12.1 ± 2.16             −0.08 ± 1.43             −7.6 ± 1.62

Values are represented as mean ± SD. Two-way ANOVA followed by Bonferroni post hoc test: * a significant difference between saline and LPS treatment: ****p < 0.0001; + a significant
difference between Bl6 and 129Sv mice of the same treatment group: +++p < 0.001.

   Six metabolites survived the Bonferroni correction in both 1.5                           treated Bl6 mice had higher blood levels of serotonin and
and 24 h saline treatment groups. These metabolites included                                lower C4- compared to 129Sv. This difference was missing in
SCACs (C5-), biogenic amines Ac-Orn, alpha-AAA, carnosine,                                  the 1.5 h saline treatment groups due to the higher values of
sphingolipid (SL) SM (OH) C22:2 and the ratio of C5-/carnitine                              serotonin and lower blood plasma levels of C4- in 129Sv,
(C5-/C0). Elevations in Bl6 included Ac-Orn, alpha-AAA and                                  probably indicating acute stress-induced changes in 129Sv.
carnosine (Supplementary Figures 1A–C). In contrast,                                             GLM analysis confirmed a significant main effect [1.5 h saline: F
elevations in 129Sv included C5- and SM (OH) C22:2                                          (10,9) = 58.37, p < 0.0001; 24 h saline: F(10,4) = 87.08, p = 0.0003] of
(Supplementary Figures 1E, F). Additionally, 24 h saline                                    mouse strain on the levels of various metabolites. In both the 1.5 and

Frontiers in Pharmacology | www.frontiersin.org                                         5                                                March 2020 | Volume 11 | Article 371
Piirsalu et al. LPS Induced Metabolomic Changes
24 h saline treatment groups significantly different metabolite levels decreased 1.5 h after LPS treatment; however, 24 h after LPS
between Bl6 and 129Sv included C5-, biogenic amines (Ac-Orn, treatment it was significantly increased compared to saline treated
alpha-AAA, carnosine), LysoPCa C16:1, and SM (OH) C22:2 (all p controls (Figure 3F). Accordingly, the ratio of spermidine/
≤ 0.0001). In addition, there was a significant difference in the blood putrescine exhibited a significant increase 1.5 h after LPS
levels of PC aa C34:3 (p = 0.001), PC ae C38:4 (p = 0.005), hexoses treatment and a significant decrease 24 h after LPS treatment.
(p = 0.005), and LysoPC a C20:3 (p = 0.009) in the 1.5 h group and 1.5 h LPS administration induced a significant reduction in
of PC ae C40:6 (p = 0.0003), PC ae C36:2 (p = 0.004), SM (OH) ACs (C3:1, C4:1, C5-, C5:1, C6:1, C12-DC, C14:2-OH; Figure
C14:1 (p = 0.004), and PC ae C38:2 (p = 0.008) in the 24 h group 3A), amino acids: alanine (Ala), glycine (Gly), histidine (His),
(Supplementary Table 3). Phe, methionine (Met), proline (Pro), serine (Ser), threonine
(Thr), and valine (Val), biogenic amine alpha-AAA as well as in
Strain Specific Metabolic Shifts Induced the sum of aromatic amino acids (AAA). Furthermore, the sum
by LPS of glucogenic amino acids was significantly reduced (Figure 3B).
First, to identify differences between saline and LPS In contrast, the ratio of Gly/Ser was elevated.
administration, Bl6 and 129Sv strains were analyzed separately 24 h LPS challenge induced significant alterations in several
using two-way ANOVA [treatment (saline or LPS) × time (1.5 h metabolite levels compared to saline treated animals, including
or 24 h LPS challenge)]. Bonferroni post hoc analysis was used decrease in serotonin, LysoPC acyls (LysoPC a C16:1, LysoPC a
when applicable after statistically significant ANOVA results. C17:0, LysoPC a C18:1, LysoPC a C18:2, LysoPC a C20:3, LysoPC a
C20:4), PC acyl-alkyls (PC ae C36:2, PC ae C38:2, PC ae C38:3, PC
LPS Induced Alterations of Metabolic Profile in Bl6 ae C38:5), hexoses as well as in the ratio between Leu/KYN,
LPS administration induced altered levels of 87 metabolites and serotonin/KYN, LysoPC a C16:1/LysoPC a C16:0 and LysoPC a
their ratios in the Bl6 strain. Twenty-one of them were altered early C18:2/LysoPC a C18:1. On the other hand, significant elevation was
in the 1.5 h LPS challenge, 58 were altered later in the 24 h LPS observed of LCACs (C16, C16:1, C18, C18:1 and C18:2), biogenic
challenge, and eight of them were altered in both time points. amines [asymmetric dimethylarginine (ADMA), symmetric
Detailed results are presented in Supplementary Table 1. dimethylarginine (SDMA), KYN], PC diacyls (PC aa C32:3, PC
Metabolites that were decreased 1.5 h as well as 24 h after LPS aa C34:1, PC aa C34:2, PC aa C36:1, PC aa C38:4, PC aa C38:6, PC
treatment are SCACs (C3, C4-), amino acids citrulline and aa C40:5, PC aa C40:6, PC aa C42:4) and in the ratio of SCACs to
tyrosine (Tyr), biogenic amines (Ac-Orn, putrescine), and the free carnitine (CRT-1), LCACs to free carnitine (CPT-1), C5-/C0,
ratio between Tyr and phenylalanine (Phe). Putrescine was Arg/citrulline, KYN/Trp, KYN/alpha-AAA and LysoPC a C20:4/
A B C D
E F G H
I J K
FIGURE 3 | LPS treatment-induced changes in concentrations of (A) C3, (B) glucogenic amino acids, (C) citrulline, (D) Ac-Orn, (E) KYN, (F) putrescine,
(G) lysophosphatidylcholines (C20:3), (H) phosphatidylcholine diacyls (C36:1), (I) phosphatidylcholine acyl-alkyls (C38:2), (J) sphingolipids (OH C22:1) and (K)
hexoses in Bl6 mice after 1.5 and 24 h from administration. Data was analyzed by two-way ANOVA followed by the Bonferroni post hoc test. *significant p value
between saline and LPS treatment; +significant p value between 1.5 h and 24 h LPS treatments. *p ≤ 0.05, **p ≤ 0.01, ***p ≤ 0.001, ****p ≤ 0.0001, ++p ≤ 0.01,
++++p ≤ 0.0001.
Frontiers in Pharmacology | www.frontiersin.org 6 March 2020 | Volume 11 | Article 371Piirsalu et al. LPS Induced Metabolomic Changes
LysoPC a C20:3. One of the most significant alterations was the altered LCACs was more extended from that seen in Bl6 mice.
elevation of 12 out of 15 circulating sphingolipids. Most significant Moreover, the sum of hydroxylated LCACs was significantly
results are highlighted in Figure 3. elevated. Similar to Bl6 strain, ratios of acylcarnities to free
carnitine (CRT-1 and CPT-1) were significantly elevated. Among
LPS Induced Alterations of Metabolic Profile in 129Sv mice 24 h LPS treatment caused a significant change in the
129Sv levels of biogenic amines serotonin and KYN. The level of serotonin
The pattern of altered levels of metabolites in 129Sv differed from was significantly reduced, whereas the value of KYN was elevated.
that of Bl6. 1.5 h LPS challenge caused less alterations in 129Sv than Furthermore, the ratio KYN/Trp was elevated, whereas the ratio
seen in Bl6. 1.5 h after LPS administration merely 9 altered levels of serotonin/Trp was reduced. Moreover, the ratio KYN/alpha-AAA
metabolites and their ratios were identified, including decrease in was significantly elevated. From 90 circulating glycerophospholipids
SCACs (C2, C3, C4-, C5-), citrulline, ratios of C3/C3, C5-/0, Tyr/ (GPLs) the level of 25 GPLs was significantly altered, including
Phe and increase in PC diacyl PC aa C42:0. Detailed results are reduction of several LysoPC acyls (LysoPC a C17:0, LysoPC a C18:2,
presented in Supplementary Table 2. LysoPC a C20:3, LysoPC a C20:4) and PC acyl-alkyls (PC ae C36:2,
24 h after LPS administration large-scale alterations were PC ae C36:4, PC ae C38:2, PC ae C38:3, PC ae C38:5, PC ae C40:3),
observed in the metabolic profile, including 71 altered levels of as well as elevation of several PC diacyls (PC aa C32:3, PC aa C34:3,
metabolites and their ratios. Citrulline was the only amino acid PC aa C36:1, PC aa C36:2, PC aa C38:1, PC aa C38:4, PC aa C38:6,
significantly reduced in 129Sv. Accordingly, the ratio Arg/citrulline PC aa C40:2, PC aa C40:3, PC aa C40:5, PC aa C40:6, PC aa C42:2,
was elevated. Similarly to Bl6 mice, 129Sv exhibited significant PC aa C42:4, PC aa C42:5). Similar to Bl6 mice, the most significant
decrease of SCAC (C3) and increase in LCACs (C12, C14:1, C14:1- alteration was the elevation of sphingolipids. It is noteworthy that
OH, C14:2, C14:2-OH, C16, C16-OH, C16:1, C16:1-OH, C16:2, no changes were observed in the level of hexoses in 129Sv mice. The
C16:2-OH, C18, C18:1, C18:1-OH, C18:2). However, the number of most significant results are highlighted in Figure 4.
A B C
D E F
G
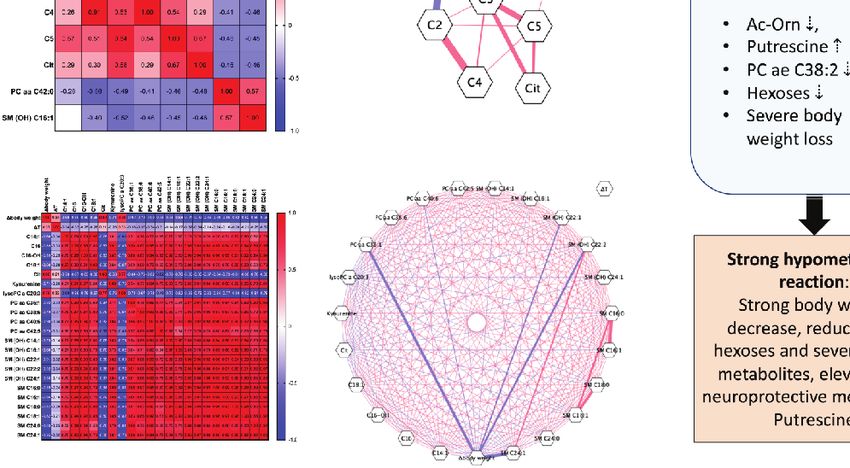
FIGURE 4 | LPS treatment-induced changes in concentrations of (A) SCACs (C3), (B) hydroxylated LCACs (C16:1-OH), (C) citrulline, (D) KYN, (E)
lysophosphatidylcholines (C20:3), (F) phosphatidylcholine diacyls (C36:1) and (G) sphingolipids (C16:0) in 129Sv mice 1.5 and 24 h after administration. Data was
analyzed by two-way ANOVA followed by the Bonferroni post hoc test. *significant p value between saline and LPS treatment; +significant p value between 1.5 h and
24 h LPS treatments. *p ≤ 0.05, **p ≤ 0.01, ***p ≤ 0.001, ****p ≤ 0.0001, ++++p ≤ 0.0001.
Frontiers in Pharmacology | www.frontiersin.org 7 March 2020 | Volume 11 | Article 371Piirsalu et al. LPS Induced Metabolomic Changes
GLM Analysis of LPS Induced Alterations in TABLE 3 | Effect of LPS treatment after 24 h on metabolite levels among Bl6 mice.
Metabolic Profile of Bl6 Metabolites Bl6 24 h LPS
Paired t-tests with Bonferroni correction (p value less or equal to
0.0002) were used to first sort out significant differences in Beta (b) b (95% Cl) t-value p-value
metabolite levels. Subsequently, GLM analysis was used to D body weight −0.90 −1.12, −0.68 −8.64 < 0.0001
confirm differences between LPS and saline treatment groups Citrulline (Cit) −0.83 −1.11, −0.54 −6.05 < 0.0001
in 1.5 and 24 h LPS challenge. Acetylornithine (Ac-Orn) −0.86 −1.12, −0.60 −6.90 < 0.0001
The final GLM model demonstrated a significant main effect Kynurenine 0.87 0.62, 1.12 7.23 < 0.0001
Putrescine 0.88 0.64, 1.12 7.80 < 0.0001
of 1.5 h LPS treatment [F(9,6) = 5.01, p = 0.03] on metabolite lysoPC a C16:1 −0.88 −1.12, −0.64 −7.64 < 0.0001
levels. Significant shifts in the model included SCAC C3 (p < lysoPC a C20:3 −0.88 −1.12, −0.64 −7.61 < 0.0001
0.0001), Ala (p = 0.0001), Gly (p = 0.001), His (p = 0.0004), Phe lysoPC a C20:4 −0.81 −1.11, −0.52 −5.78 < 0.0001
(p = 0.001), Pro (p < 0.0001), Ser (p < 0.0001), Tyr (p = 0.002), PC aa C36:1 0.85 0.57, 1.12 6.56 < 0.0001
and biogenic amine Ac-Orn (p = 0.001). The most prominent PC aa C40:6 0.85 0.58, 1.12 6.68 < 0.0001
PC ae C38:2 −0.85 −1.12, −0.59 −6.74 < 0.0001
effect was observed between the 1.5 h LPS treatment and decline SM (OH) C22:1 0.92 0.72, 1.12 9.58 < 0.0001
of C3, Ala, Pro, and Ser (Table 2). SM (OH) C22:2 0.89 0.66, 1.12 8.05 < 0.0001
The GLM model of 24 h LPS treatment demonstrated robust SM C16:0 0.94 0.76, 1.12 11.02 < 0.0001
main effect of treatment [F(17,1)= 221092, p = 0.0017] on selected SM C24:0 0.85 0.57, 1.12 6.53 < 0.0001
metabolite levels. The final model retained BW change, citrulline, SM C24:1 0.95 0.80, 1.11 12.84 < 0.0001
Hexoses (H1) −0.78 −1.10, −0.45 −5.06 < 0.0001
biogenic amines KYN, and putrescine, GPLs (LysoPC a C16:1,
LysoPC a C20:3, LysoPC a C20:4, PC aa C36:1, PC aa C40:6, PC Statistically significant regression coefficients (b), confidence intervals (CI) and t- and p
values (derived from GLM analysis) of log10-transformed metabolite levels.
ae C38:2), sphingolipids [SM (OH) C22:1, SM (OH) C22:2, SM
C16:0, SM C24:0, SM C24:1], and hexoses (all p values < 0.0001;
Supplementary Table 4). Citrulline, LysoPC acyls, PC diacyls, TABLE 4 | Effect of LPS treatment after 1.5 h on metabolite levels among 129Sv mice.
and hexoses were significantly downregulated after the 24 h LPS
challenge. On the other hand, KYN, putrescine, PC ae C38:2, and Metabolites 129Sv 1.5 h LPS
sphingolipids were significantly upregulated (Table 3). Beta (b) b (95% Cl) t-value p-value
GLM Analysis of LPS Induced Alterations in Acetylcarnitine (C2) − −1.14, −0.54 −5.93 < 0.0001
Propionylcarnitine (C3) −0.87 −1.14, −0.60 −6.81 < 0.0001
Metabolic Profile of 129Sv Butyryl- and −0.85 −1.14, −0.56 −6.22 < 0.0001
Similar to the Bl6 strain, the GLM model of the 1.5 h isobutyrylcarnitine (C4-)
LPS challenge in 129Sv displayed strong main effect of Isovalerylcarnitine and −0.78 −1.12, −0.43 −4.78 0.0002
treatment [F(7,9)= 18.29, p = 0.0001]. Significantly altered shifts 2-methybutyrylcarnitine
(C5-)
of metabolites included SCACs C2 (p < 0.0001), C3 (p < 0.0001),
PC aa C42:0 0.64 0.22, 1.06 3.22 0.006
C4- (p < 0.0001) and C5- (p = 0.0002), citrulline (p = 0.001), PC SM (OH) C16:1 0.56 0.11, 1.02 2.64 0.02
aa C42:0 (p = 0.006), and SM (OH) C16:1 (p = 0.002; Table 4).
Statistically significant regression coefficients (b), confidence intervals (CI) and t- and p
All metabolites altered in the 1.5 h LPS challenge exhibited a
values (derived from GLM analysis) of log10-transformed metabolite levels.
decline, except for complex lipids [PC aa C42:0 and SM (OH)
C16:1], which were elevated (Supplementary Table 4).
The 24 h LPS administration also showed strong main effect change and blood levels of PC diacyls (PC aa C36:1, PC aa C40:6)
of treatment [F(16,1) = 437.3, p = 0.004]. The most significant and sphingolipids [SM (OH) C22:1, SM (OH) C22:2, SM C16:0,
effect (t values > 10, p values < 0.0001) was observed in BW SM C16:1 and SM C24:1]. Moderate (t values > 5 < 10, p values ≤
0.0001) LPS-induced alterations were observed in C18:1,
citrulline, KYN, GPLs (LysoPC a C20:3, PC aa C38:6, PC aa
TABLE 2 | Effect of LPS treatment after 1.5 h on metabolite levels among Bl6 mice. C42:5) and sphingolipids [SM (OH) C14:1, SM (OH) C16:1, SM
Metabolites Bl6 1.5 h LPS
(OH) C24:1, SM C18:0, SM C18:1 and SM C24:0]. Minor
alterations (t-values < 5, p values < 0.001) included LCACs
Beta (b) b (95% Cl) t-value p-value C14:1, C16 and C16-OH (Table 5).
Propionylcarnitine (C3) −0.84 −1.15, −0.52 −5.68 < 0.0001
Alanine (Ala) −0.81 −1.15, −0.47 −5.16 0.0001 Association Between Metabolites, Body
Glycine (Gly) −0.74 −1.12, −0.35 −4.08 0.001 Weight, and Temperature Change in Bl6
Histidine (His) −0.78 −1.14, −0.41 −4.59 0.0004
Phenylalanine (Phe) −0.73 −1.12, −0.33 −3.96 0.001
After LPS Challenge
Proline (Pro) −0.86 −1.15, −0.56 −6.20 < 0.0001
Based on significant results obtained from the GLM analysis,
Serine (Ser) −0.86 −1.15, −0.56 −6.20 < 0.0001 Pearson correlation coefficient matrix was created to measure the
Tyrosine (Tyr) −0.72 −1.12, −0.32 −3.92 0.002 relationships between the metabolic profile, BW, and
Acetylornithine (Ac-Orn) −0.73 −1.12, −0.34 −4.01 0.001 temperature alterations in the 1.5 h and 24 h LPS challenges.
Statistically significant regression coefficients (b), confidence intervals (CI) and t- and p Subsequently, correlation networks were constructed based on
values (derived from GLM analysis) of log10-transformed metabolite levels. these matrices. The correlation matrices and networks revealed
Frontiers in Pharmacology | www.frontiersin.org 8 March 2020 | Volume 11 | Article 371Piirsalu et al. LPS Induced Metabolomic Changes
TABLE 5 | Effect of LPS treatment after 24 h on metabolite levels among 129Sv
mice.
Association Between Metabolites, Body
Weight and Temperature Change in 129Sv
Metabolites 129Sv 24 h LPS After LPS Challenge
Beta (b) b (95% Cl) t-value p-value
Correlation analysis of the 1.5 h LPS challenge in the 129Sv strain
revealed significant positive correlation of the 1.5 h body
D body weight −0.93 −1.12, −0.74 −10.19 < 0.0001 temperature change with SCACs C3 (r = 0.54, p = 0.03) and C5-
Tetradecenoylcarnitine (C14:1) 0.76 0.42, 1.11 4.73 0.0002
(r = 0.57, p = 0.02). These acylcarnitines showed moderate positive
Hexadecanoylcarnitine (C16) 0.77 0.43, 1.11 4.83 0.0002
Hydroxyhexadecanoylcarnitine 0.76 0.42, 1.10 4.70 0.0002
correlation among themselves as well (r > 0.51, p < 0.05). PC aa
(C16-OH) C42:0 was negatively correlated with SCACs C2 (r = −0.56, p = 0.02)
Octadecenoylcarnitine (C18:1) 0.78 0.45, 1.11 5.04 0.0001 and C3 (r = −0.49, p = 0.04), but positively correlated with SM (OH)
Citrulline (Cit) −0.89 −1.13, −0.65 −7.77 < 0.0001 C16:1 (r = 0.57, p = 0.01). Furthermore, positive correlation was
Kynurenine 0.87 0.61, 1.13 7.01 < 0.0001
established between citrulline and LCACs C3 (r = 0.68, p = 0.003)
lysoPC a C20:3 −0.85 −1.13, −0.56 −6.34 < 0.0001
PC aa C36:1 0.93 0.74, 1.12 10.19 < 0.0001 and C5- (r = 0.67, p = 0.003; Figures 5E, F).
PC aa C38:6 0.85 0.58, 1.13 6.52 < 0.0001 The 24 h LPS-induced BW change displayed strong positive
PC aa C40:6 0.95 0.80, 1.11 12.82 < 0.0001 correlation with citrulline (r = 0.80, p < 0.0001), lysoPC a C20:3 (r =
PC aa C42:5 0.80 0.48, 1.12 5.36 < 0.0001 0.76, p = 0.0002) and negative correlation with LCACs (r < −0.66, p
SM (OH) C14:1 0.88 0.64, 1.13 7.55 < 0.0001
SM (OH) C16:1 0.79 0.47, 1.12 5.23 < 0.0001
< 0.01), KYN (r = −0.71, p = 0.0006), PC diacyls (r < −0.75, p <
SM (OH) C22:1 0.95 0.79, 1.11 12.55 < 0.0001 0.0001), and sphingolipids (r < −0.68, p < 0.01). Opposite to the Bl6
SM (OH) C22:2 0.95 0.80, 1.11 12.40 < 0.0001 strain, no significant correlation was established between 24 h body
SM (OH) C24:1 0.92 0.72, 1.13 9.73 < 0.0001 temperature change and metabolites in 129Sv. Additionally,
SM C16:0 0.97 0.84, 1.10 15.98 < 0.0001 sphingolipids were positively correlated with LCACs (r > 0.51, p
SM C16:1 0.94 0.75, 1.12 10.60 < 0.0001
SM C18:0 0.91 0.70, 1.13 8.91 < 0.0001
< 0.05) and PC diacyls (r > 0.54, p < 0.05). Furthermore, strong
SM C18:1 0.92 0.71, 1.13 9.39 < 0.0001 positive correlation was observed between LCACs and PC diacyls (r
SM C24:0 0.93 0.72, 1.13 9.74 < 0.0001 > 0.66, p < 0.001). Citrulline was negatively correlated with LCACs,
SM C24:1 0.98 0.88, 1.08 20.55 < 0.0001 KYN, PC diacyls, and sphingolipids. KYN exhibited strong positive
Statistically significant regression coefficients (b), confidence intervals (CI) and t- and p correlation with LCACs, PC diacyls, and sphingolipids (Figures
values (derived from GLM analysis) of log10-transformed metabolite levels. 5G, H).
that some metabolites were positively correlated with each other
DISCUSSION
while others were negatively correlated with each other (Figures Recent studies have demonstrated that metabolomics has become a
5A–H). useful tool for the identification of novel possible biomarkers and
Correlation analysis of the 1.5 h LPS challenge in Bl6 mice their ratios related to different pathological conditions and
revealed that all significantly altered levels of metabolites (C3, understanding the molecular mechanisms behind them. Bacterial
Ala, Gly, His, Phe, Pro, Ser, Tyr and Ac-Orn) were positively LPS challenge has been widely used in immunological studies as one
correlated with each other. Strong correlations were observed of the models of peripherally induced neuroinflammation as well as
among amino acids (r > 0.53, p < 0.05). No significant correlation for modeling depression-like behavior in rodents. However, so far
was established between the 1.5 h body temperature change and only few studies have examined mouse strain differences in
metabolites (Figures 5A, B). However the 24 h LPS challenge endotoxin-mediated inflammatory response. The purpose of this
revealed that temperature change was positively correlated with study was to explore the possible differences in coping with
hexoses (r = 0.51, p = 0.03), citrulline (r = 0.66, p = 0.001), Ac- inflammatory processes between Bl6 and 129Sv mouse strains 1.5
Orn (r = 0.47, p = 0.04), LysoPC a C20:3 (r = 0.56, p = 0.01), h and 24 h after LPS injection. For the association analysis of
LysoPC a C20:4 (r = 0.67, p = 0.002) PC ae C38:2 (r = 0.62, p = metabolites, body weight, and temperature change, we chose
0.005) and negatively correlated with putrescine (r = −0.57, p = multivariate GLM analysis that allows us to test the LPS
0.009). Body weight change was positively correlated with treatment effect on all variables with one test. This analysis takes
citrulline (r = 0.76, p = 0.0001), Ac-Orn (r = 0.82, p < 0.0001), into account the possible LPS effect on each measured variable and
LysoPC acyls (r > 0.78, p < 0.0001), PC ae C38:2 (r = 0.82, p < integrates them into one united biological system.
0.0001) and hexoses (r = 0.70, p = 0.0008), but negatively
correlated with KYN (r = −0.74, p = 0.0002), putrescine (r = LPS Depressed Locomotor Activity and
−0.86, p < 0.0001), PC diacyls (r < −0.83, p < 0.0001), and Body Weight Decrease
sphingolipids (r < −0.80, p < 0.0001). Negative correlation was Bl6 and 129Sv strains showed the same overall pattern of motor
established between LysoPC acyls and sphingolipids (r < −0.52, activity after infection with E. coli LPS (0.5 mg/kg, i.p.) as rapid
p < 0.05) and a very strong positive correlation was observed activity reducing effect was observed in both strains (Figures
between sphingolipids and PC diacyls (r > 0.91, p < 0.0001; 2A–C). Mice became lethargic after LPS administration and
Figures 5C, D). displayed depressed locomotor activity throughout 24-h
Frontiers in Pharmacology | www.frontiersin.org 9 March 2020 | Volume 11 | Article 371Piirsalu et al. LPS Induced Metabolomic Changes
A B I
C D
E F
G H
FIGURE 5 | Heat-map of Pearson correlation coefficients between body weight change (Dbody weight), temperature change (DT), and all significantly altered
metabolites (Log10) in (A) Bl6 1.5 h LPS challenge, (C) Bl6 24 h LPS challenge, (E) 129Sv 1.5 h LPS challenge, and (G) 129Sv 24 h LPS challenge. Significant
correlations (p < 0.05) are highlighted by correlation network diagram in (B) Bl6 1.5 h LPS challenge, (D) Bl6 24 h LPS challenge, (F) 129Sv 1.5 h LPS challenge,
and (H) 129Sv 24 h LPS challenge. Red lines represent positive and blue lines negative correlations: the strength of the correlation is indicated by line thickness. (I)
Biomarkers of inflammation 1.5 and 24 h after LPS administration in Bl6 and 129Sv. Data represented in the illustration is derived from the GLM model.
period. Although when splitting 24-h cycle into hourly values, BW loss in Bl6 strain (Ayala et al., 2006). Thus, the loss of BW
clearly different motor response between Bl6 and 129Sv emerged may be explained in some extent by reduced food intake.
within 2 h from the beginning of behavioral testing (Figure 2G). LPS induced slight reduction of body temperature, although it
This could reflect higher anxiety-like behavior of 129Sv at the did not reach statistical significance level. Interestingly, 1.5 h into
beginning of the experiment and passive adaptation in stressful inflammation, 129Sv display greater decline of body temperature
environment (Võikar et al., 2001; Abramov et al., 2008; Heinla than Bl6. However, as inflammation progressed, the body
et al., 2014). Inflammation increases energy demand, and temperature of 129Sv mice increased, while the body temperature
locomotor retardation helps animals conserve energy. Energy of Bl6 mice was persistently low in the 24 h period. Body
is redirected from growth and reproduction programs into temperature of 129Sv 1.5 h after LPS administration was
maintenance and survival programs (Wang et al., 2019). significantly lower compared to the 24 h temperature decline.
LPS induced a significant BW loss in both strains 24 hours Impaired thermoregulation could be disadvantageous in the
after treatment. However, BW loss was more pronounced in Bl6, context of immune activation, which could be one of the reasons
than in 129Sv mice, even though the starting weight of both 129Sv mice seem to be more vulnerable to infection. A recent study
strains did not differ. Administration of LPS has been reported to demonstrated inflammation-induced hypothermia as a strategy for
reduce significantly food intake in Bl6 mice (Kim et al., 2013). inducing hypometabolism, which is essential for host tolerance and
Furthermore, overnight (18 h) fasting results in about 16% of survival (Ganeshan et al., 2019).
Frontiers in Pharmacology | www.frontiersin.org 10 March 2020 | Volume 11 | Article 371Piirsalu et al. LPS Induced Metabolomic Changes
Basal Metabolic Profile Differences metabolite groups. In this case the number of altered metabolites
Between Bl6 and 129Sv was substantially larger in 129Sv compared to Bl6.
Saline-treated Bl6 and 129Sv mice differed in several metabolite
concentrations. In both 1.5 and 24 h time points, the levels of Acylcarnitines
biogenic amines (Ac-Orn, alpha-AAA and carnosine) were SCACs C3, C4- and C5- were decreased 1.5 h after LPS
significantly higher in Bl6 compared to 129Sv. Alpha-AAA is administration in both strains. Additionally, C2 (acetylcarnitine)
an intermediate in lysine (Lys) metabolic pathway, a marker for was decreased only in 129Sv, and multiple SCACs and MCACs
oxidative stress and an established biomarker for insulin were reduced solely in the Bl6 strain. Previous findings suggest that
resistance and diabetes risk (Yuan et al., 2011; Zeitoun- medium- and long-chain acylcarnitines participate in
Ghandour et al., 2011; Wang et al., 2013). Several studies in proinflammatory signaling pathways (Rutkowsky et al., 2014;
rodents have shown that alpha-AAA is an inhibitor of kynurenic Ganeshan et al., 2019). Furthermore, several studies have reported
acid (KYNA) synthesis. KYNA is a neuroactive metabolite and alterations of acylcarnitine profile in pathological conditions
antagonist of the glutamatergic N-methyl-D-aspartate (NMDA) including type 2 diabetes (Adams et al., 2009), cardiovascular
as well as AMPA/kainate and alpha 7 nicotinic receptors (Heyes diseases (Makrecka-Kuka et al., 2017), and first episode psychosis
et al., 1992; Wu et al., 1995; Tuboly et al., 2015). The increased (Kriisa et al., 2017). After applying the GLM analysis, only four
level of alpha-AAA in Bl6 mice has been reported to be caused by acylcarnitines remained statistically significant in the 1.5 h LPS
defect in Dhtkd1 gene. Dhtkd1 has been identified as a primary challenge group. Decrease of C3 (a metabolite of Val and Ile
regulator of alpha-AAA and defects in this gene result in the catabolism) was significant in both strains, while reduction of C2,
buildup of alpha-AAA (Wu et al., 2014; Leandro et al., 2019). C4- and C5- was only evident in 129Sv.
Carnosine is dipeptide (beta-alanyl-L-histidine) that is highly The only acylcarnitine, which remained changed throughout
concentrated in excitable tissues such as muscle and brain and is the 1.5 and 24 h inflammatory responses in both strains, was C3.
capable of scavenging free radicals (Klebanov et al., 1998). Additionally, 24 h after LPS administration several LCACs
Furthermore, experiments with primary neuronal cultures exhibited significant increase in both strains. Specifically in
show neuroprotective properties of carnosine (Bae and Majid, 129Sv, additional LCACs were significantly increased of which
2013). The higher blood concentrations of these metabolites in most were hydroxylated acylcarnitines. Furthermore, the sum of
Bl6 mice may contribute to their being more capable of coping hydroxylated LCACs was significantly increased in 129Sv,
with infection. whereas no alterations were observed in Bl6. Long-chain fatty
In contrast, one acylcarnitine (C5-) and sphingolipid SM acids are transported to the mitochondria in the form of
(OH) C22:2 were higher in 129Sv at both 1.5 and 24 h time acylcarnitines, where b-oxidation takes place to produce major
points. Additionally, the 24 h saline-treated 129Sv mice had portion of metabolic energy. Based on these findings, it seems
higher blood levels of C4- compared to the Bl6 mice, but this that LPS induces incomplete long-chain fatty acid b-oxidation in
difference was missing between the 1.5 h saline treatment groups. 129Sv, which induces accumulation of hydroxylated LCAC
This could indicate a possible acute stress-induced reduction of intermediates. Besides, due to a certain shift of oxidative
C4- in 129Sv. SCAC C4- is derived from ketone bodies and from catabolism of fatty acids, e.g. intensification of omega- and
ketogenic amino acid Leu, while C5- is the byproduct of alpha-oxidation pathways, some portion of hydroxylated
branched-chain amino acids (BCAA) Ile and Leu catabolism. acylcarnitines could be produced.
The finding that Bl6 mice have higher levels of Ac-Orn, alpha- The 24 h LPS challenge caused a reduction of SCAC C4- in
AAA, carnosine and 129Sv have higher blood levels of C4- and Bl6 as well as a reduction of free carnitine (C0) in 129Sv. The
C5- also supports the results of a previous research (Narvik et al., increase in plasma acylcarnitines and decrease in plasma
2018), indicating that these metabolites belong to the carnitine suggest increased utilization of carnitine for the
metabolomic signature of these strains. C5- acylcarnitine in production of acylcarnitines in 129Sv. GLM analysis for the 24
mouse blood plasma is a mixture of isovalerylcarnitine and 2- h LPS challenge revealed significant alterations in acylcarnitine
methybutyrylcarnitine. Recent evidence suggests that increased profile only in 129Sv, implying that changes in acylcarnitine
levels of C5- acylcarnitine in 129Sv mice are contributed by the levels after LPS administration are specific for 129Sv.
accumulation of isovalerylcarnitine, which is caused by a splice
site mutation in the lvd gene resulting in isovaleryl-CoA Amino Acids
dehydrogenase deficiency (Leandro et al., 2019). Citrulline decreased in both strains compared to the saline-
treated control groups 1.5 h after LPS administration. Aside
LPS-Induced Metabolite Differences from citrulline, no other amino acids were altered in 129Sv.
In addition to LPS-induced body weight differences between Contrary to this stability in 129Sv mice, Bl6 mice exhibited a
strains, metabolites in Bl6, and 129Sv strains were also differently reduction in various amino acids (Ala, Gly, His, Phe, Met, Pro,
affected by LPS challenge after 1.5 and 24 h. After 1.5 h, the Ser, Thr, Val). Combination of several factors (intensification of
number of affected metabolites was more extensive in Bl6 synthesis of protector proteins as well as inflammatory
compared to 129Sv. Nevertheless, inflammatory responses after mediators, illness-associated malnutrition, intensification of
24 h included a wide-range of alterations in several different production of ketone bodies, and glyconeogenesis) may cause
Frontiers in Pharmacology | www.frontiersin.org 11 March 2020 | Volume 11 | Article 371Piirsalu et al. LPS Induced Metabolomic Changes
the above-mentioned declines as Phe, Met, Thr, and Val are IDO (Moffett and Namboodiri, 2003). KYN can be further
essential amino acids, Ala, Gly, His, Met, Pro, Ser, Thr and Val converted into neuroprotective KYNA or neurotoxic quinolinic
are glucogenic amino acids, and Phe is a gluco-ketogenic amino acid, which is intermediate for nicotinamide adenine
acid. Therefore, one single factor, like short-term (1.5 h) fasting dinucleotide (NAD+) biosynthesis. Blood KYN is transported
should not cause a depletion of plasma amino acid levels (Felig extensively to brain. About 80% of blood KYN is transported to
et al., 1969). Furthermore, the sum of glucogenic amino acids brain in normal conditions and this is even further amplified
was significantly reduced in Bl6, whereas no significant changes reaching up to 98% in inflammatory conditions (Kita et al.,
were found in 129Sv 1.5 h after LPS administration. GLM 2002). Since KYN competes with Leu for the transport from the
analysis confirmed that amino acids were specifically reduced blood to the brain via large amino transporter LAT1, the fact that
in Bl6 1.5 h after LPS administration. Although this profile was the ratio Leu/KYN was in favor of KYN in inflammatory
somewhat different, including Ala, Gly, His, Phe, Met, Pro conditions 24 h after LPS administration, may indicate that
and Tyr. KYN is able to cross the blood-brain barrier (BBB) more
24 h post treatment, only the reduction of citrulline remained efficiently. This ratio was only significantly altered in Bl6 mice.
statistically significant. Citrulline is one of the key products of Whether the KYN pathway favors the shift towards KYNA or
Arg catabolism. Nitric oxide synthase (NOS) catalyzes Arg quinolinic acid in LPS-induced neuroinflammatory conditions in
hydrolysis into citrulline and NO. LPS and cytokines are these strains still needs further investigation. However, KYN and
known to induce NOS expression and thus the production of alpha-AAA are both substrates for kynurenine aminotransferase
NO (Förstermann and Sessa, 2012). However decreased II (KAT-II; also known as alpha-AAA aminotransferase II),
concentration of citrulline indicates decreased NOS activity which is responsible for the transamination of KYN into
and NO production. This was further supported by a decrease KYNA (Buchli et al., 1995; Hallen et al., 2013), and thus alpha-
of plasma ratio of citrulline/Arg in both strains, which reflects AAA levels indicate the availability of KAT-II for the
decreased activity of NOS. Furthermore, plasma levels of NOS transamination of KYN. The ratio KYN/alpha-AAA was again
inhibitors ADMA and SDMA were significantly elevated in the in favor of KYN in inflammatory conditions 24 h after LPS
LPS treated Bl6 mice after 24 h, but not in 129Sv. However, it is administration providing additional insight that KYN may be
worth to underline that the plasma concentrations of ADMA and transaminated to KYNA. Individual differences between strains
SDMA in 129Sv were already slightly higher in control included reduction of Ac-Orn and increase in putrescine, ADMA
conditions, resembling Bl6 blood concentrations in and SDMA in Bl6, whereas no strain-specific alterations were
inflammatory conditions, which has been also noted previously observed in 129Sv. After applying GLM, only the reduction of
in these strains in home cage conditions (Narvik et al., 2018). Ac-Orn and elevation of putrescine remained statistically
This reflects increased NOS inhibition and thus decreased NO significant in Bl6, and elevation of KYN remained significant
and citrulline production. Low plasma citrulline levels have been in both strains. Together with Arg, Ac-Orn is one of the
previously associated with acute respiratory distress syndrome in precursors for ornithine synthesis and from there on,
sepsis patients (Ware et al., 2013). putrescine is synthesized from ornithine. The decrease in Ac-
Orn was also accompanied by a slight reduction of plasma
Biogenic Amines ornithine in Bl6 mice. Increased values of putrescine and
Alpha-AAA, Ac-Orn, and putrescine are examples of significantly decreased values of ornithine and Ac-Orn suggest increased
reduced biogenic amines in Bl6 mice 1.5 h after LPS administration. putrescine biosynthesis in the later phases of inflammatory
In contrast, the ratio of spermidine/putrescine was elevated in Bl6, response in Bl6 mice. Additionally, the ratio between
indicating increased activity of spermidine synthase and conversion spermidine and putrescine was decreased in Bl6, indicating
of putrescine to spermidine. No alterations in the biogenic amine deteriorated activity of spermidine synthase and conversion of
profile were observed in 129Sv. As mentioned above alpha-AAA putrescine to spermidine. Alterations in putrescine synthesis
and Ac-Orn are metabolites found more abundant in the blood pathway were absent in 129Sv. Putrescine has been shown to
samples of Bl6 compared to 129Sv in baseline conditions. possess neuroprotective activity in the CNS (Jänne et al., 2005).
LPS-response-specific biogenic amines that were altered in Whether Bl6 mice are more capable in coping with LPS-induced
both strains 24 h after LPS administration included KYN and neuroinflammation still needs further investigation.
serotonin. While the concentration of serotonin was decreased,
the level of KYN in the blood plasma was significantly higher Glycerophospholipids and Sphingolipids
compared to saline-treated mice. Trp is metabolized in the KYN Glycerophospholipids (GPLs) and sphingolipids (sphingomyelines,
and serotonin pathway. Although no differences were observed SMs) are considered inflammatory mediators, and altered levels of
in plasma Trp levels of the LPS-treated mice, there was a shift lipids reflect interplay between inflammation and lipid metabolism.
favoring the ratio of KYN/Trp to the ratio of serotonin/Trp. This Prominent parts of the GPL family are phoshatidylcholines (PCs),
indicates that Trp metabolism through the KYN pathway is which are main precursors for LysoPCs. In the 1.5 h LPS challenge,
favored during inflammatory conditions. Trp conversion to KYN the only alteration observed was the elevation of PC aa C42:0 in
is catalyzed by the enzyme indoleamine 2,3-dioxygenase (IDO), 129Sv. After utilization of the GLM analysis, SM (OH) C16:1 was
which is activated by inflammatory cytokines and it has been included to the list of significantly elevated lipids in 129Sv. No
suggested that plasma levels of KYN directly reflect the activity of significant alterations in lipid metabolism were observed in Bl6.
Frontiers in Pharmacology | www.frontiersin.org 12 March 2020 | Volume 11 | Article 371You can also read