Triglav Group 2016 Results Presentation - April 2017 - Zavarovalnica Triglav
←
→
Page content transcription
If your browser does not render page correctly, please read the page content below

Triglav Group

2016 Results Presentation

April 2017
Triglav Group

Modern, innovative and dynamic
insurance-financial group,
firmly remaining the leader both
in Slovenia and Adria region.

 Triglav Group - 2016 Results Presentation 2

About Triglav Financial Strategy Appendix
Group Reporting 2017-2020
Financial
Highlights
 Outlook

 3
About Triglav
Group

Financial
Highlights

 Triglav is the highest mountain in Slovenia and the highest peak of the
 Julian Alps (2,864 meters/9,396 ft).

 Triglav Group - 2016 Results Presentation 4
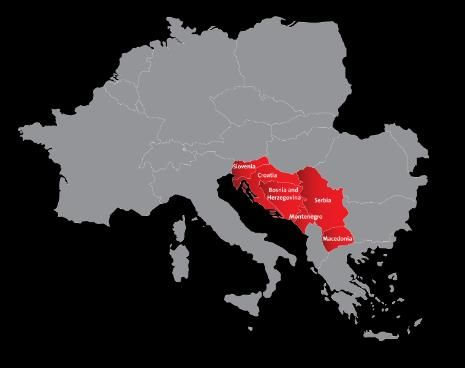
Triglav Group - 116 years of tradition and experience Triglav Group: Parent company Zavarovalnica Triglav, 31 subsidiaries and 4 associated companies Around 5.050 employees Core business: Insurance, Asset management Ratings (upgraded in 2016): A/stable outlook (S&P Global Ratings, AM Best) Market presence and position: Leading insurance - financial group in Adria region and in Slovenia In 6 countries in Adria region, global through inward reinsurance GWP of Triglav Group by markets (2016) Country GWP Index Market Market 2016/2015 share position 5,3% 17,3% Slovenia 102 36.2% 1 Croatia 108 4.2% 9 Serbia 122 4.8%* 5* Bosnia and Herz. 108 7.8% 4 77,4% Montenegro 102 38.9% 1 Slovenia Other markets Macedonia (NL) 102 17.9% 1 Reinsurance Global *9M 2016 Triglav Group - 2016 Results Presentation 5

Core Business of Triglav Group Insurance Structure of GWP in 2016 − Non-life 12% − Life − Supplementary pensions 23% Non-life − Health 65% Life − Reinsurance Health Asset Management Insurance portfolios and own funds − Insurance portfolios and own funds: o AUM € 2,617 million o Liability driven investing − Investment funds: o AUM € 674 million Debt and other fixed return securities o 17 mutual funds Shares and other floating rate securities Investment property o Investment fund in Bos. and Herz. Deposits with banks Loans given Other Triglav Group - 2016 Results Presentation 6

Management Board of Zavarovalnica Triglav

 Tadej Čoroli Andrej Slapar Uroš Ivanc, CFA Marica Makoter Benjamin Jošar

 Management Board President of the Management Board Management Board Management Board
 member Management Board member member and member
 Non-life insurance, sales CEO CFO Employee Risk management,
 and marketing, claims Representative controlling and the
 HRM, business Process subsidiary
 management, IT, fraud management
 prevention

 Triglav Group - 2016 Results Presentation 7
2016 Triglav Group at a glance

 Plan 2016 2016 Comment More details

 2% growth (up by 3% if
Gross written premium Around € 900m ✓ € 936m adjusted for the sale of the See page 21 -23
 Czech insurer)

 Successful performance in See page 19 - 20
Profit before tax € 80-90m ✓ € 95m
 the insurance business

Combined ratio non-life Around 95% ✓ 92.9% Overachieved See page 25

 In line with the strategic
Return on Equity Above 10% ✓ 11.4% See page 26
 value

Dividend for 2016 declared € 2.5 p.s. 69% of 2016 con. net profit See page 11 and 15

 Triglav Group - 2016 Results Presentation 8

Highlights for Triglav Group in 2017 New strategy 2017 – 2020 (see page 28 – 32) Our vision: The dynamic development of new ways of business as the foundation of the Group’s responsible long-term development, while at the same time operating profitably and safely Dividend declared (Dividend policy – see page 15) € 2.5 gross per share (69% of net profit of Triglav Group for 2016; Annual General Meeting on 30 May 2017) 2016 2015 2014 2013 Total dividends (in €) 56,837,870 declared 56,837,870 56,837,870 38,649,753 Dividends per share (in €) 2.5 declared 2.5 2.5 1.7 General Meetings of Shareholders 30 May 2017 31 May 2016 9 June 2015 10 June 2014 Earnings per share (in €)* 3.6 3.9 3.8 3.1 Establishment of a Regional Platform for Alternative Investments (Trigal) in cooperation with the German KGAL Group Purpose of the project: To obtain funds from institutional investors and invest them in various types of investments (real property, infrastructure projects and other alternative investments, primarily in the Adria region). *Net profit of Triglav Group/Number of shares Triglav Group - 2016 Results Presentation 9

Triglav Group under Solvency II Solvency ratio of Triglav Group (1 Jan 2016)* = = = 245% 30 Sept 2016** 31 Dec 2015 Solvency ratio of Triglav Group (in %) 276 245 EOF - Eligible own funds to cover SCR (High quality capital - more than 97% of EOF is Tier 1) SCR - Solvency Capital Requirement (Calculated on a risk estimation basis = the one-year value at risk of AFR at confidence level of 99.5%) Solvency and Financial Condition Report (SFCR) - first publication in May 2017 (for parent company) and July 2017 (for Triglav Group) *With 2016 dividend payment for 2015 already taken into account. No optional LTG measures considered (transitional rules, matching adjustment, volatility adjustment) ** Estimate, without the dividends for 2016 taken into account. Triglav Group - 2016 Results Presentation 10
Risk profile of Triglav Group

The own risk assessment reveals that in 2016 the level of risk exposure was acceptable and in line with the
defined risk appetite. During the development of the strategy for the 2017–2020 period, it was estimated that the
Group will meet the capital requirements in accordance with the defined risk appetite also in the future.

 2% 2%
 4% SCR Market risk
 6%
 40% SCR Credit risk
 SCR Life underwritting risk
 SCR Health underwritting risk
 SCR Non-life underwritting risk
 25% SCR Operational risk
 SCR Limited funds
 7% 6%
 8% SCR Skupna pokojninska družba
 SCR Triglav Skladi

 The most significant and extensive among the risk types faced by Triglav Group are market and underwriting
 risks, followed by credit and operational risks.

 Triglav Group - 2016 Results Presentation 11
Dividend Policy and Capital Management In 2016 revised dividend policy is based on the Triglav Group’s target capital adequacy and takes into account not only the planned volume of business and the related foreseen capital needs in the Slovene and strategic markets but also the guidelines and good practices of the insurance sector. The basis for the dividend payment is a sufficient amount of accumulated profit of Zavarovalnica Triglav for the year. The possibility of increased risk appetite Excess The possibility of more aggressive growth in the volume of operations and consideration of > 300% capital possible changes to the business strategy adequacy The possibility of increasing the share of dividend payments The possibility of excess capital payout (capital reduction) Target The payment of dividends within the target range of 30 – 50% of consolidated net profit of the Triglav (payout ratio of 30-50%) 250 – 300% capital Maintenance of the applicable risk appetite adequacy Room for growth in the volume of operations in line with the applicable business strategy Suboptimal Analysis of possible measures to prepare a capital adequacy improvement plan Assessment of possible selective reduction in the volume of operations 200 - 250% capital Changes to the plans for expanding operations adequacy The possibility of reducing the share of dividend payments (lower payout ratio) The preparation of the plan and the implementation of measures aimed at improving Warning capital adequacy 150 – 200% capital The implementation of measures for selective reduction in the volume of operations adequacy Strict limitation of the expansion of operations Reduction in the share of dividend payments Insufficient Assessment of the possibility of issuing subordinated capital instruments < 150% Implementation of the restructuring plan Capital Consideration of the possibility to increase capital adequacy No dividend payments Triglav Group - 2016 Results Presentation 12
Equity Story of Triglav Group

 2013 - 2016: Focus on
 profitability and
 selective expansion

 2000: Leading 2017 – 2020: Modern,
 position in Slovenia – innovative and dynamic
 expansion started insurance-financial group,
 2007: Fast growth in firmly remaining the
 the markets of former leader both in Slovenia
 Yugoslavia and Adria region

 1900

 Triglav Group - 2016 Results Presentation 13
Financial
Reporting

Outlook

 Triglav Group - 2016 Results Presentation 14
Triglav Group in 2016

 In € million
 Index
 2016 2015 2016/2015
Gross written premium 936,0 919,1 102
Net premium income 849,6 839,2 101
Gross claims paid 606,0 594,8 102
Net claims incurred 577,1 570,3 101
Gross operating costs* 237,0 231,6 102
Profit before tax 95,1 102,5 93
Net profit for the accounting period 82,3 88,9 93

Gross insurance technical provisions 2.660,8 2.600,4 102
Total equity 744,3 704,0 106
Number of employees 5.046 5.379 94

Expense ratio non-life 30,9% 30,3% 102
Net claims ratio non-life 62,0% 62,5% 99
Combined ratio non-life 92,9% 92,8% 100

*Insurance business gross operating costs

 Triglav Group - 2016 Results Presentation 15
Structure of Profit before Tax of Triglav Group
 In € million

 2016 2015
 Non-life Life Health Total Non-life Life Health Total
PBT from underwriting activities 38,8 13,3 2,4 54,6 33,0 13,2 3,6 49,7
PBT from investment activities 32,0 4,4 1,0 37,5 36,1 10,4 1,9 48,3
PBT from insurance operations 70,9 17,7 3,5 92,1 69,1 23,5 5,5 98,1
PBT from non-insurance operations 3,1 4,4

Total PBT 95,1 102,5

 4,4% 2,8% 3,8%
Structure of PBT in 2016 11,8%
 24,4% 19,2%

 85,4% 77,0% Health
 71,2%
 Life
 Non-life
 PBT from PBT from PBT
 insurance financial assets (insurance only)
 operations

 Triglav Group - 2016 Results Presentation 16
Structure of Profit before Tax of Triglav Group

Structure of PBT (2016 and 2015) PBT by business segments in € M

 +3% -25% -37% -30%
 40,7%
 49,3%

 69,1 70,9

 PBT from financial
 59,3% assets
 50,7% 23,5
 17,7
 PBT from insurance
 5,5 3,5 4,4 3,1
 operations

 Non-life Life Health Other
 2016 2015
 2015 2016

 Triglav Group - 2016 Results Presentation 17
Gross Written Premium
GWP Development in € million
 +2 %
 989 Around 936
 936 901 888 919 900

 919.1 +11.1 +0.0 +5.8 936.0

 2011 2012 2013 2014 2015 Plan 2016 2016 2015 Non-life Life Health 2016
 Non-life Life Health In € million

GPW by segments Index 2016/2015

Non-life insurance 102 Up by 4% if adjusted for the sale of the Czech insurer

Life insurance 100 Despite successful sales of new policies growth hampered by high rate of
 maturity of insurance policies
Health insurance 105 Result of successful marketing of supplemental health insurance
 products

 Triglav Group - 2016 Results Presentation 18
Gross Written Premium (GWP) of Triglav Group
Structure of GWP in 2016 Structure of GWP 2016 2015

 Non-life insurance 65.1% 65.1%
 12%
 Non-life Life insurance 22.7% 23.1%
23%
 Life
 65% Health insurance 12.2% 11.8%
 Health

Well balanced structure of consolidated GWP

 Motor vehicle insurance 28,1%
 Property insurance 25,1%
 Life insurance 22,7%
 Health insurance 12,4%
 Accident insurance 4,6%
 General liability insurance 4,4%
 Credit insurance 2,6%
 0% 5% 10% 15% 20% 25% 30%

 Triglav Group - 2016 Results Presentation 19
Markets of Triglav Group
See page 35 – 40 for details

 Country Triglav Group by markets % Consol. GWP Market development
 (2015)
 by markets
 GWP Market Market Insurance Insurance
 Growth share position penetration* density
 Index 16/15
 (EU 7.6%) (€ per capita)

 Slovenia 102 36.2% 1 82.7% 5.1% 958

 Croatia 108 4.2% 9 5.2% 2.6% 269

 Serbia 122 4.8%** 5** 3.7% 2.1% 95

 Bosnia and Herzegovina 108 7.8% 4 2.7% 2.1% 85

 Montenegro 102 38.9% 1 3.3% 2.1% 124

 Macedonia (NL) 102 17.9% 1 2.3% 1.5% 65

*Insurance penetration = Premium share in GDP
** 9M 2016

 Triglav Group - 2016 Results Presentation 20
Group’s Markets with Growth Potential GDP growth and low insurance density key growth drivers on target markets Strategy 2017 – 2020: − Focus on Adria region. Organic growth, potential takeovers not excluded − Higher share of total written premium on markets outside Slovenia − Developing digital models witch allow entering markets outside the existing region − Developing existing markets (primarily investing in life, health and pension insurance) 4.000 2002 GPW per capita 3.000 ( USD) 2.000 EU 1.000 POL ROM SLO 0 UKR MCD CRO CZR SER BUL 1.000 10.000 GDP per capita (USD) 100.000 4.000 2015 GPW per capita 3.000 EU (USD) 2.000 1.000 SLO CRO UKR SER MCD BUL ROM POL CZR 0 1.000 10.000 GDP per capita (USD) 100.000 Triglav Group - 2016 Results Presentation 21
Combined Ratio
Triglav Group non-life combined ratio

 92.0% 90.1% 89.6% 91.0% 96.3% 92.8% 92.9%

 92,8% 92,9%
 61,9% 61,0% 60,9% 61,7% 66,2% 62,5% 62,0%

 30,1% 29,2% 28,8% 29,3% 30,0% 30,3% 30,9%
 2015 2016
 2010 2011 2012 2013 2014 2015 2016
 Expense ratio Loss ratio

Non-life combined ratios by Triglav Group markets

 119,4% 111,8%
 107,4% 100,5%100,0% 107,3%102,2% 101,7% 99,1%
89,3% 90,9% 92,3%

 Slovenia Croatia Bosnia and Herzegovina Serbia Montenegro Macedonia

 2015 2016

 Triglav Group - 2016 Results Presentation 22
Strong Capital Base and ROE

Equity in € M Triglav Group‘s Return on Equity
 +5.7%

 744,3 13,8% 13,4% 12,8%
 704,0 12,0% 11,4%
 9,6%

 31 Dec. 2015 31 Dec. 2016 2011 2012 2013 2014 2015 2016

Gross Technical Provisions in € M Year-End Gross Technical Provisions in € M
 +2.3% 2.660,8
 2.600,4
 2.270,9 2.234,1 2.305,3 2.261,4 2.333,7

 2.600,4 2.660,8

 31 Dec. 2015 31 Dec. 2016 2010 2011 2012 2013 2014 2015 2016

 Triglav Group - 2016 Results Presentation 23
Triglav Group Plans for 2017

In 2017, the Group’s operations will continue to be financially sound and profitable, while maintaining the Group’s
strong financial stability and capital adequacy, which is the basis for the dividend payment for 2016 as set out in the
adopted dividend policy.

 In € million

 2011 2012 2013 2014 2015 2016 Plan 2017

Gross written premium 989 936 901 888 919 936 Around 930

Profit before tax 58 90 84 100 102 95 70 - 80

Combined ratio non-life 90.1% 89.6% 91.0% 96.3% 92.8% 92.9% Around 95%

 Triglav Group - 2016 Results Presentation 24
Triglav
Group
Strategy
2017 – 2020

 Triglav Group - 2016 Results Presentation 25
Strategy 2017 – 2020, answer to the new challenges

 »Disruptors« Customer-Friendly
 Evolution of
 Soft market primary players Security Flexibility
 Easy
 Value
 Technological New and enlarging Additional
 innovation risk pools Services Smart
 Simplicity Fast

 Economic
 Ultra-low
 turbulences
 interes rates
 Financial market Demographic
 volatility changes

 Long-dated Number and intensity
 life guarantees of natural disasters

 Triglav Group - 2016 Results Presentation 26
Mission, Vision and Values of Triglav Group

Triglav Group’s mission is BUILDING A SAFER FUTURE for all its stakeholders, while being committed to
responsible and sustainable development.

Triglav Group’s vision: To dynamically develop new ways of doing business as the foundation of the Group’s
responsible long-term development, while at the same time operating profitably and safely.

Triglav Group’s values: Safety, Responsibility, Professionalism, Simplicity, Modernity

 Triglav Group - 2016 Results Presentation 27
Strategic guidelines (topics) by 2020
1. Profitable operations and greater value of Triglav Group
 − Selected growth of operations
 − Profitable insurance business
 − Average target combined ratio in non-life insurance around 95%
 − ROE over 10% in 2020
 − Efective management of risks, cost-effectiveness, financial stability, appropriate capital adequacy
 − “A” credit ratings
 − Dividend paid in line with the dividend policy and the capital management guidelines

2. Effective asset management in Triglav Group

3. Comprehensive client relationships

4. Transformed operations of Triglav Group
 − Digital strategy
 − Innovative and comprehensive insurance-service products and asset management services
 − Developing sales channels and the omnichannel sale
 − Delivering empathetic client service down the whole stretch of the customer journey

5. Modern culture and dedicated staff
 − Upgraded organisational culture and flexible organisational structure (balance between the stability and
 dynamics of organisation) ,synergies, innovation system within the organisation
 − Corporate social responsibility and sustainable development

 Triglav Group - 2016 Results Presentation 28
Client focused Activities: Focusing on client life journey and providing omnichannel communication. Continuous improvement of customer satisfaction metrics Developing simple solutions and products and implementing digital business methods and new business models Transforming insurance products into insurance services and other connected services Omni-channel Individual availability handling Innovative Client focus products Accompanying a client throughout their lifecycles Increasingly digitised Simple processes products Triglav Group - 2016 Results Presentation 29
Appendix

Triglav Group - 2016 Results Presentation 30
Triglav Group’ Companies and Markets

Markets Insurance Asset Management Other
Slovenia Zavarovalnica Triglav d.d. Triglav Skladi d.o.o. Triglav INT d.d.
 Triglav, Upravljanje
 Pozavarovalnica Triglav Re d.d. Triglav Svetovanje d.o.o.
 nepremičnin d.d.
 Triglav, Zdravstvena zavarovalnica d.d. Triglav Avtoservis d.o.o.
 Skupna pokojninska družba d.d. TriglavKo d.o.o.

Croatia Triglav Osiguranje d.d., Zagreb TRI-LIFE d.o.o.

Bosnia and Herzegovina Triglav Osiguranje a.d., Banja Luka PROF-IN d.o.o. Triglav Auto d.o.o.
 Triglav Osiguranje d.d., Sarajevo Autocentar BH d.o.o.
 Triglav Savjetovanje d.o.o.
 Unis automobili i dijelovi
 d.o.o.

Serbia Triglav Osiguranje a.d.o., Belgrade Triglav Savetovanje d.o.o.

Montenegro Lovćen Osiguranje a.d., Podgorica Lovćen Auto a.d.
 Lovćen životna osiguranja a.d., Podgorica

Macedonia Triglav Osiguruvanje a.d., Skopje

 Triglav Group - 2016 Results Presentation 31
Key figures Slovenia Market share* +0.2 p.p. 36.2% Market position 1 Zavarovalnica Triglav Gross premium written +2% € 737.3 M Triglav, Zdravstvena Gross operating costs +3% € 180.8 M Zavarovalnica Gross claims paid +2% € 499.3 M Skupna pokojninska Combined ratio +1.6 p.p. 90.9% družba Market development Insurance penetration (2015) 5.1% GPW € 2.033 M (+1.5%) Insurance density (2015) € 958 per capita Major events High profitability, market leader GPW of Zav. Triglav increased by 1%, TZZ by 6%, SPD by 3% Aggressive price competition, upward pressure on the acquisition costs * in Slovenia a market share of 36.2% (44% in non-life insurance, 35% in life insurance and 23.5% in health insurance). Triglav Group - 2016 Results Presentation 32
Key figures Croatia Market share +0.3 p.p. 4.2% Market position 9 Triglav Osiguranje Zagreb Gross premium written +8% € 48.9 M Gross operating costs +2% € 19.5 M Gross claims paid +14% € 30.1 M Combined ratio -12.0 p.p. 107.4% Market development Insurance penetration (2015) 2.6% GPW € 1,163 M (+0.4%) Insurance density (2015) € 269 per capita Major events High premium growth and market stagnation causes for Company's increased market share Strong price competition due to motor vehicle liability market liberalization Triglav Group - 2016 Results Presentation 33
Key figures Serbia Market share (Q3 2016) +0.6 p.p. 4.8% Market position (Q3 2016) 5 Triglav Osiguranje Gross premium written +22% € 34.4 M Belgrade Gross operating costs +22% € 13.5 M Gross claims paid +25% € 12.0 M Combined ratio -5.1 p.p. 102.2% Market development Insurance penetration (2015) 2.1% GPW (Q3 2016) € 543 M (+10.0%) Insurance density (2015) € 95 per capita Major events High growth across all lines of business and increased market share Particular focus on the development of life insurance sales channels Various innovative mass products in the field of home insurance launched Triglav Group - 2016 Results Presentation 34
Key figures Bosnia and Market share 0.0 p.p. 7.8% Herzegovina Market position 4 Triglav Osiguranje Sarajevo Gross premium written +8% € 25.5 M Triglav Osiguranje Banja Gross operating costs +6% € 11.5 M Luka Gross claims paid -8% € 11.1 M Combined ratio -0.5 p.p. 100.0% Market development Insurance penetration (2015) 2.1% GPW € 324 M (+7.7%) Insurance density (2015) € 85 per capita Major events Solid growth across all lines of business, life insurance in particular Focus on profitability in a very challenging market environment Triglav Group - 2016 Results Presentation 35
Key figures Montenegro Market share -0.6 p.p. 38.9% Lovćen osiguranje Market position 1 Lovćen životna osiguranja Gross premium written +2% € 31.2 M Gross operating costs +1% € 11.0 M Gross claims paid +18% € 18.3 M Combined ratio -19.5 p.p. 92.3% Market development Insurance penetration (2015) 2.1% GPW € 80 M (+4.2%) Insurance density (2015) € 124 per capita Major events Maintained dominant market position Focus on improving core operating profitability and cost efficiency Triglav Group - 2016 Results Presentation 36
Key figures Macedonia Market share NL -0.1 p.p. 17.9% Market position NL 1 Triglav Osiguruvanje Skopje Gross premium written +2% € 21.6 M Gross operating costs +3% € 7.0 M Gross claims paid -5% € 9.2 M Combined ratio -2.6 p.p. 99.1% Market development Insurance penetration (2015) 1.5% GPW NL € 121 M (+3.5%) Insurance density (2015) € 65 per capita Major events Focus on profitability Introduction of health and other insurance products on the market Triglav Group - 2016 Results Presentation 37
Shareholder structure of Zavarovalnica Triglav Addiko SDH; 28,1% Shareholdings of international shareholders Bank; 6,5% 17% (2008: 4%) HPB; 1,4% Ownership concentration (share owned by Top Clearstream ZPIZ; 34,5% 10) 76% Banking; 1,3% Government predominant shareholder Balkan Fund; 1,3% Others; 27,0% Domestic Foreign Legal entities Individuals Total Number of shares 18.844.958 3.890.190 20.355.597 2.379.551 22.735.148 Number of shareholders 17.876 458 519 17.815 18.334 Number of shares - percentage 82,89% 17,11% 89,53% 10,47% 100,00% Number of shareholders - percentage 97,50% 2,50% 2,83% 97,17% 100,00% Structure of free float: 34,39% 33,78% 31% Foreign Individuals Domestic Legal entities €183 M (31 March 2017) 65,61% 66,22% Triglav Group - 2016 Results Presentation 38
Triglav Group Asset Allocation

 Non-life & Health1 Life & Pensions1 Total
 In € M In % In € M In % In € M In %
 Investment property 93,6 8% 2,3 0% 95,8 4%
 Investments in associates2 2,7 0% 4,1 0% 6,8 0%
 Shares and other floating rate securities 122,6 10% 115,8 8% 238,4 9%
 Debt and other fixed return securities 898,9 76% 1.236,0 87% 2.134,9 82%
 Loans given 6,8 1% 23,0 2% 29,8 1%
 Bank deposits 42,6 4% 38,6 3% 81,2 3%
 Other financial investments 17,5 1% 7,2 1% 24,7 1%
 Investments 1.184,7 100% 1.427,1 100% 2.611,8 100%

 Financial investments of reinsurance companies in
 reinsurance contracts with cedents 5,2 0,0 5,2
 Unit-linked insurance contract investments 0,0 460,0 460,0
 Group financial investments 1.189,9 1.887,1 3.077,0

1 Includes investments of own funds of the Group.
2 Investment in associates are mainly additional Real Estate exposure.

 Triglav Group - 2016 Results Presentation 39
Bond portfolios

 Bond Portfolio Structure by Type of Issuers* Exposure to Slovenian Bonds in Total Bonds

 1% 1%

 50% 36,1%
 57%
 29,0%
 26,3%
 25,2%
 23,4% 20,8%

 25%
 18% Structured
 Government

 23% 24% Financial
 Corporate
 31 Dec. 2015 31 Dec. 2016 2011 2012 2013 2014 2015 2016

• Reclassification from government to financial and corporate debt securities due to the new Solvency II methodology and/or consequently the
 requirements regarding the classification of securities by sector and analytical treatment of state guarantees.

 Triglav Group - 2016 Results Presentation 40
Triglav Group Investment portfolios: Non-Life and Health

Bonds by rating Bonds by Type of Issuer

 AAA 3% 1
 16% Corporate 20%
 20%
 AA Financial
 5%
 A Government
 51%
 BBB 25% Structured 28%
 Below BBB 32%

 Not rated

Top Bond Exposures by Country Equity Exposures by Region
 Slovenia
 Netherlands 18% Slovenia 7% 5%
 46% 35%
 Spain
 10% Developed
 Germany markets
 6%
 France Developing 53%
 10%
 5% 5% markets
 Italy
 Balkan
 Other

 Triglav Group - 2016 Results Presentation 41
Triglav Group Investment portfolios: Life* and Pensions

Bonds by rating Bonds by Type of Issuer
 AAA 1%
 5% 6% Corporate
 AA 6% 26%
 17% Financial
 A
 Government 49%
 BBB 29%
 Below BBB Structured
 23%
 Not rated 37%

 Top Bond Exposures by Country Equity Exposures by Region
 Slovenia Slovenia 3%
 Netherlands 23% 6% 13%
 Developed
 Spain 42% markets
 Germany 7% Developing
 France markets
 9%
 Italy Balkan
 Other 6% 7% 5% 78%

 *Unit-linked investments excluded.

 Triglav Group - 2016 Results Presentation 42
Share Price Performance in 2016 Triglav shares (ZVTG) one of the best dividend 120% 115% yielding stocks on the Ljubljana Stock Exchange. 110% 105% In 2016 ZVTG share price decreased by 1% 100% Vrednost v % 95% 90% The third largest listed company and the third most traded share on the LJSE. ZVTG SBI TOP indeks 31 Dec 2016 31 Dec 2015 31 Dec 2014 31 Dec 2013 Book value per share (in €) * 32.3 30.5 30.0 25.7 Earnings per share (in €)** 3.6 3.9 3.8 3.1 Share market price (in €) 23.2 23.5 23.6 19.0 Market capitalization (in € million) 527 534 537 432 Dividend per share (in €) 2.5 2.5 1.7 Stock Exchange Ljubljana Stock Exchange (LJSE), Prime Market, Trading Symbol ZVTG ISIN code SI0021111651 Bloomberg: ZVTG.SV Reuters: ZVTG.LJ *Equity attributable to the controlling company from consolidated financial statements/ Number of shares excluding treasury shares ** Net profit of Triglav Group/Number of shares Triglav Group - 2016 Results Presentation 43
Financial Calendar 2017 of Triglav Group

 Planned* Type of announcement Silent period**

 Monday, 6 March 2017 Preliminary Figures 2016 From Monday, 13 February 2017
 Audited Annual Report 2016
 Wednesday, 5 April 2017 Proposed dividend From Wednesday, 22 March 2017
 Corporate Governance Code Statement
 Friday, 21 April 2017 Notice convening the General Meeting

 Friday, 19 May 2017 1st Quarter Report 2017 From Friday, 5 May 2017

 Resolutions of the General Meeting
 Tuesday, 30 May 2017
 Ex-Div Date and Dividend Payment Date info

 Friday, 18 August 2017 Half-Year Report 2017 From Friday, 4 August 2017

 Friday, 17 November 2017 9M Report 2017 From Friday, 3 November 2017

* The actual dates may differ from the above stated planned dates.
** The silent period denotes a period preceding the announcement of the Company/Group report, during which Zavarovalnica Triglav does not disclose
information on current operations to the public.
The financial calendar, as well as any amendments to the provisional dates of publication will be published on the Ljubljana Stock Exchange's website via
the SEOnet system at http://seonet.ljse.si and on the Company's website at www.triglav.eu.

 Triglav Group - 2016 Results Presentation 44
Disclaimer

The information, statements or data contained herein has been prepared by Triglav Corporate
officers. Zavarovalnica Triglav, d.d., or any member of Triglav Group, or any Zavarovalnica Triglav
employee or representative accepts no responsibility for the information, statements or
data contained herein or omitted here from, and will not be liable to any third party for any reason
whatsoever relating to the information, statements or data contained herein or omitted here
from. Such information, statements or data may not be prepared according to the same standards and
requirements than the information, statements or data included in Triglav’s own reports and press
releases are prepared to, and accordingly the level of information and materiality and nature of the
disclosures may be different. Undue reliance should not be placed on the information, statements or data
contained herein because they are subject to known and unknown risks and uncertainties and can be
affected by other factors that could cause actual results to differ materially from those expressed or
implied in such information, statements or data. Moreover, the information, statements and
data contained herein have not been, and will not be, updated or supplemented with new or additional
information, statements or data.

 Triglav Group - 2016 Results Presentation 45
Konkretni strateški cilji Stebra poslovanja (zavarovalniška dejavnost in upravljanje premoženja) Dobičkonosno poslovanje vseh odvisnih družb Preudarna rast Skupine s poudarkom na dobičkonosnosti Na slovenskem trgu: osredotočenost na donosnosti in ohranitvi največjega tržnega deleža (poudarek področju zdravstvenih in pokojninskih zavarovanj) Regija: nadaljnja rast in razvoj na ciljnih trgih JV Evrope (organska rast, partnerska sodelovanja, prevzemne aktivnosti) Dividendna politika Izhaja iz ciljne kapitalske ustreznosti Skupine Omogoča bonitetno oceno A Dividenda se giblje v višini približno tretjine konsolidiranega čistega dobička 46
You can also read