Tropical Cyclone Seroja-Damage to buildings in the - Tropical Cyclone Seroja Damage to ...
←
→
Page content transcription
If your browser does not render page correctly, please read the page content below
CYCLONE
                                      TESTING
                                      STATION

Tropical Cyclone Seroja –
  Damage to buildings in the
Mid-West Coastal Region of WA
     CTS Technical Report No 66

                  Cyclone Testing Station
                  College of Science and Engineering
                  James Cook University
                  Queensland, 4811, Australia

                  www.jcu.edu.au/cyclone-testing-station
CYCLONE TESTING STATION

                               College of Science and Engineering
                                    JAMES COOK UNIVERSITY

                                    TECHNICAL REPORT NO. 66

                       Tropical Cyclone Seroja
                      Damage to buildings in the
             Mid-West Coastal Region of Western Australia
                                            By
     Dr G. Boughton, D. Falck, Dr K. Parackal, Dr D. Henderson and Dr G. Bodhinayake

                  Cyclone Testing Station, James Cook University, Townsville

                                   Initial Release 28 May 2021
                                  Revision released 3 June 2021

© Cyclone Testing Station, James Cook University

Bibliography.
ISBN     978-0-6489220-6-3
ISSN     1058-8338
Series: Technical Report (James Cook University, Cyclone Testing Station); 66
Notes: Bibliography

Investigation Tropical Cyclone Seroja – Damage to buildings in the Mid-West Coastal Region of Western
Australia
1. Cyclone Seroja 2021 2. Buildings – Natural disaster effects 3. Wind damage 4. Rainwater ingress.

LIMITATIONS OF THE REPORT
The Cyclone Testing Station (CTS) has taken all reasonable steps and due care to ensure that
the information contained herein is correct at the time of publication. CTS expressly exclude
all liability for loss, damage or other consequences that may result from the application of this
report.

This report may not be published except in full unless publication of an abstract includes a
statement directing the reader to the full report.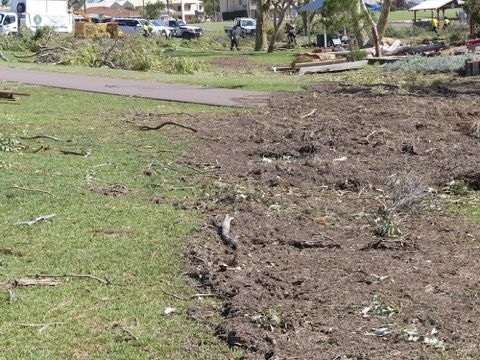
Cyclone Testing Station                                                                  TR66

Executive Summary
Severe Tropical Cyclone Seroja (TC Seroja) was classified by the Bureau of Meteorology (BoM)
as a Category 3 severe tropical cyclone and crossed the Mid-West coast of Western Australia
near Port Gregory (between Kalbarri and Geraldton) around 8:15 pm on Sunday 11 April 2021.
TC Seroja caused extensive wind damage to buildings in coastal and inland towns. The storm
tide generated during TC Seroja was higher than the Highest Astronomical Tide but did not
damage any buildings.

This report presents the findings from the joint Cyclone Testing Station (CTS); Department of
Mines, Industry, Regulation and Safety, Building and Energy Division (Building and Energy);
and the Department of Fire and Emergency Services (DFES) investigation of damage to
buildings caused by TC Seroja. The study focused on the performance of houses built since the
late 1990s in Kalbarri, Northampton, and Port Gregory but included other buildings such as
apartments, strata properties and commercial buildings. The report describes the impact of a
tropical cyclone on communities in Wind Region B and highlights the need to review
Australian codes, standards and building practices for this region.

Analysis of Bureau of Meteorology (BoM) and other data indicated that the maximum 0.2-sec
gust wind speed over land was between 46 and 51 m/second (166 to 184 km/h) at Kalbarri,
around 80 to 90% of the design wind speed for Importance Level 2 buildings in Wind Region B.
The 0.2-sec gust wind speed over Morawa, the town along TC Seroja’s track in Wind Region A
that experienced the highest wind speed, was estimated to have been 37 m/s (134 km/h)
which is also between 80% and 90% of the Wind Region A design wind speed for houses.

Data from DFES Rapid Damage Assessments and information obtained during the CTS and
Building and Energy damage investigation were combined to determine the extent and causes
of damage to buildings in the affected areas. Around 10 % of buildings in Kalbarri and
Northampton had damage classified as ‘severe’ or ‘total’. The performance of roofs
significantly influenced the level of overall damage to buildings. Many newer houses in
Kalbarri had structural damage.

The main cause of severe structural damage to houses in Kalbarri was the combination of
large suction forces on the roof and a rapid increase in internal pressure created by an opening
in the building envelope (usually from wind-borne debris breaking a door or window in a
windward wall). Designers that use AS/NZS 1170.2 can choose between using low internal
pressures from a table applicable to sealed buildings, or higher internal pressures from a table
for buildings with openings. Houses in Wind Regions A and B that are designed using AS 4055
have N wind classifications that are based on low internal pressures. Because the tie-down
connections in the roofs of many of the buildings were designed assuming low internal
pressure, they were not strong enough to cope with the higher loads that were applied when
a door or window broke.

The CTS recommends that Wind Region B is classified as cyclonic in the wind loading
standards, AS/NZS 1170.2 and AS 4055. The design wind speeds would remain the same, but
designers would use higher internal pressures applicable for buildings with openings. These
changes will enable buildings to comply with the robustness requirements in the National
Construction Code – breaking a window or door should not lead to major damage to structural
systems. If this is successful, some parts of other Australian Standards, including those for
wind ratings for garage doors, roof tile fastenings, tests on sheet metal roof cladding, and tie-
down straps into brickwork, may also need to be reviewed.

                                               3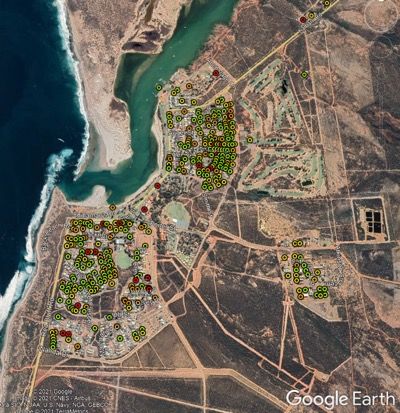
Cyclone Testing Station                                                                   TR66

A significant number of buildings in the affected areas will need to be extensively repaired or
rebuilt. If the tie-downs in the new roofs are not designed and installed correctly, they will
likely fail in future cyclones. CTS suggests that guidelines for homeowners, builders and trades
are developed and distributed as soon as possible.

Some buildings were damaged because structural elements had deteriorated. Regular
maintenance on buildings of all ages is recommended, and components and systems
upgraded as necessary.

TC Seroja also highlighted the need to research the feasibility of providing a ‘strong room’ in
new and existing houses in cyclone-prone areas, including those in Wind Region B. The
development of appropriate design criteria and construction methods to strengthen the walls
and ceiling of a small room or hallway will offer protection to occupants if the rest of the house
is significantly damaged during a cyclone.

TC Seroja has reminded the community that severe tropical cyclones affect towns and cities
in Wind Region B. To protect these communities, buildings must be designed and built to resist
all of the characteristics and impacts of tropical cyclones including, high winds, wind-borne
debris, wind-driven rain and storm surge.

                                                4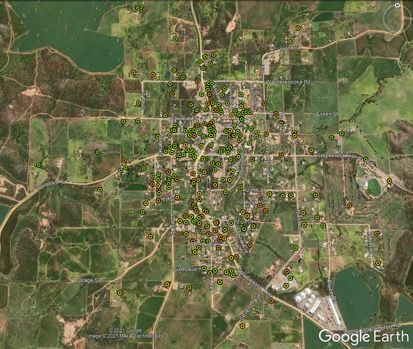
Cyclone Testing Station                                                              TR66

Acknowledgements
The authors thank the residents of the Kalbarri, Northampton, Port Gregory and Geraldton
communities who generously assisted with this study by volunteering information and inviting
the authors into their homes to inspect and photograph the damage.

During this investigation, the CTS team worked closely with DFES WA and Building and Energy.
The collaboration between the three organisations enabled a coordinated, efficient, and
effective approach to the investigation that increased the amount of data and information
gathered in a short period of time. The outcomes of the study will ultimately contribute to
improved community resilience to future tropical cyclones in all parts of Australia.

The authors particularly acknowledge the support given by
    •  Sean de Prazer, senior engineer and Justin McAullay, building inspector – representing
       Building and Energy;
    •  DFES – arranged accommodation and provided information and data on the location
       of damaged properties. The team particularly appreciated the assistance of Damien
       Pumphrey, Stephen Gray, Catherine Timms, Brett McGregor, and Sarah Morrison.
    •  DFES Urban Search and Rescue, Geraldton SES and support volunteers;
    •  IAG – Dr Joanna Aldridge and Dr Bruce Buckley for assistance with estimating the wind
       field.
    •  Dr Bruce Harper of SEA for assistance with storm-tide evaluation, Dr Matt Mason from
       the University of Queensland for help with correction of anemometer data used to
       estimate the wind field, and Joe Courtney of the Bureau of Meteorology for assistance
       in interpreting meteorological data.

The CTS appreciates the financial support provided by DFES, Building and Energy, and the CTS
Sponsors and Benefactors.

CTS would also like to thank our supporters.

                                               5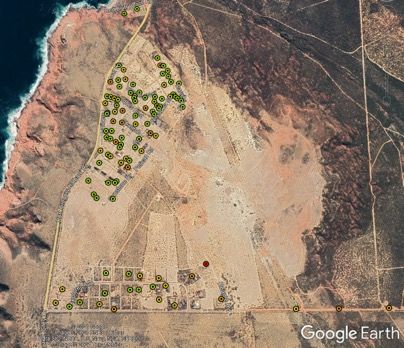
Cyclone Testing Station                                                                                                                                   TR66

Table of contents
1. Introduction .............................................................................................................. 8
1.1.  Severe Tropical Cyclone Seroja Overview .............................................................................. 8
1.2.  Damage investigation....................................................................................................................... 8
1.3.  Purpose of the report ....................................................................................................................... 8
1.4.  Wind Region B ................................................................................................................................... 10
2. Severe Tropical Cyclone Seroja ................................................................................ 11
2.1.     BoM Information .............................................................................................................................. 11
2.2.     TC Seroja – a severe tropical cyclone in Wind Region B of WA ................................... 13
2.3.     BoM Anemometer data.................................................................................................................. 13
   2.3.1.     Wind speeds as a percentage of design wind speed ................................................... 15
2.4.     Wind field study area ..................................................................................................................... 16
2.5.     Buildings of other Importance Levels ..................................................................................... 17
3. Estimates of Damage from Rapid Damage Assessment ............................................ 18
3.1.  Rapid Damage Assessment data ................................................................................................ 18
3.2.  Distribution of damage .................................................................................................................. 18
4. Wind damage to contemporary buildings ................................................................ 22
4.1.     Wind-borne debris .......................................................................................................................... 23
   4.1.1.      Internal pressure ....................................................................................................................... 25
4.2.     Roof to wall connections............................................................................................................... 26
4.3.     Batten to truss or rafter connections ...................................................................................... 30
4.4.     Roof cladding ..................................................................................................................................... 32
   4.4.1.      Metal sheet roofs ........................................................................................................................ 32
   4.4.2.      Tile roofs ........................................................................................................................................ 33
4.5.     Walls ...................................................................................................................................................... 35
4.6.     Verandas .............................................................................................................................................. 37
4.7.     Windows and doors ........................................................................................................................ 37
   4.7.1.      Windows ........................................................................................................................................ 37
   4.7.2.      Doors ............................................................................................................................................... 38
   4.7.3.      Garage doors ............................................................................................................................... 39
4.8.     Flashings and gutters ..................................................................................................................... 40
4.9.     Soffits (eaves linings) ..................................................................................................................... 41
5. Wind damage to older buildings .............................................................................. 42
5.1.     Debris damage .................................................................................................................................. 42
5.2.     Damage due to deterioration ...................................................................................................... 43
   5.2.1.     Corrosion ....................................................................................................................................... 43
5.3.     Damage due to detailing that doesn’t comply with current standards .................... 44
5.4.     Asbestos ............................................................................................................................................... 45
5.5.     Heritage Buildings ........................................................................................................................... 45
6. Damage from wind-driven rain ................................................................................ 46
6.1. Flashings, valley and box gutters .............................................................................................. 46
6.2. Windows and doors ........................................................................................................................ 47
7. Damage to ancillary items ....................................................................................... 48
7.1. Large sheds ......................................................................................................................................... 48
7.2. Fences ................................................................................................................................................... 49
7.3. Outdoor ceiling fans ........................................................................................................................ 50
7.4. Roof-mounted items ....................................................................................................................... 51
7.5. Swimming pools ............................................................................................................................... 52
8.       Storm tide in TC Seroja ............................................................................................ 53

                                                                                  6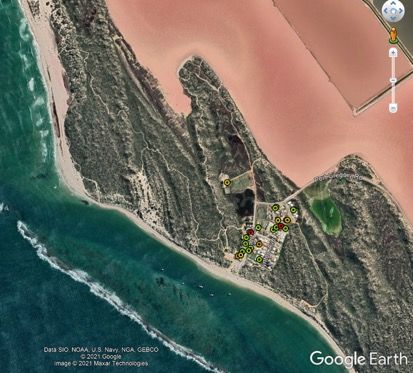
Cyclone Testing Station                                                                                                                                      TR66

9.       Benefits of strong rooms in houses .......................................................................... 55
10.           Summary of Findings ........................................................................................... 57
11.    Recommendations............................................................................................... 58
  Resources ............................................................................................................................................................ 60
  References ........................................................................................................................................................... 61
Appendix 1 – Windicators ............................................................................................................................ 63
Appendix 2 – Internal pressures for design in Wind Region B .................................................... 66
Appendix 3 – Wind classification .............................................................................................................. 72

                                                                                    7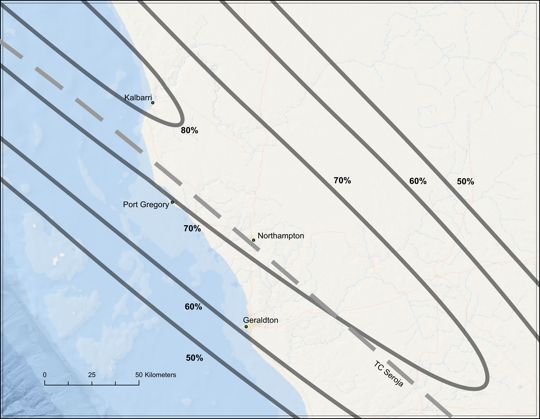
Cyclone Testing Station                                                                TR66

1. INTRODUCTION
1.1.     Severe Tropical Cyclone Seroja Overview
Severe Tropical Cyclone Seroja (TC Seroja) crossed the coast at Port Gregory, Western
Australia, a small town between Kalbarri and Geraldton, around 8:15 pm on Sunday 11 April
2021. TC Seroja caused wind damage to buildings in Kalbarri, Northampton, Port Gregory,
Morawa, Mingenew, Perenjori, Carnamah, Geraldton and other towns in the area. No
buildings in the area surveyed were damaged by the storm tide.

1.2.     Damage investigation
The field study commenced on Monday, 12 April 2021 and concluded on Wednesday, 14 April
2021. The investigation team included two representatives from the Cyclone Testing Station
(CTS) and two from Department of Mines, Industry, Regulation and Safety, Building and
Energy Division (Building and Energy). The WA Department of Fire and Emergency Services
(DFES) provided data on damaged buildings and invaluable logistical support.

Figure 1-1 shows the study area. The affected towns are near the coast of a region of WA
called the Mid-West. The investigation team focused on structural damage to houses
(residential buildings) in Kalbarri but also assessed some houses in the Greater Geraldton area
and visited Northampton and Port Gregory to check the extent of damage in those towns.
Section 3 includes DFES Rapid Damage Assessment data that illustrates the extent of damage
in the affected areas.

The field study:
    • Examined contemporary buildings constructed using the Building Code of Australia
         (BCA) to determine whether their performance was appropriate for the estimated
         wind speeds during the event. The team documented structural failures in enough
         detail to determine recommendations to improve future construction.
    • Examined patterns of damage to determine whether any structural elements had
         systematic weaknesses.
    • Checked simple structures such as signs to use as ‘windicators’ and identified
         features used to adjust anemometer readings for terrain and topography.

1.3.     Purpose of the report
The purpose of this report is to present the outcomes of the joint CTS, Building and Energy,
and DFES field investigation into the damage to buildings caused by TC Seroja. The report
identifies problems in building performance and highlights issues that need to be considered
for changes to Codes and Standards, building practices, and ongoing maintenance.

This investigation focused on structural damage to residential buildings built after the late
1990s so the results could be used to comment on current building practices and, if necessary,
recommend changes to Codes and Standards. The performance of some older residential
buildings and commercial buildings was also assessed.

                                              8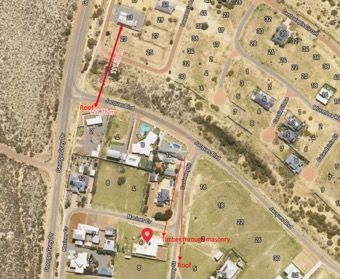
Cyclone Testing Station                                                      TR66

                          Port Gregory

                     Figure 1-1 Area of damage investigation (Google maps)
                      Inset – Map of WA indicating region investigated

                                              9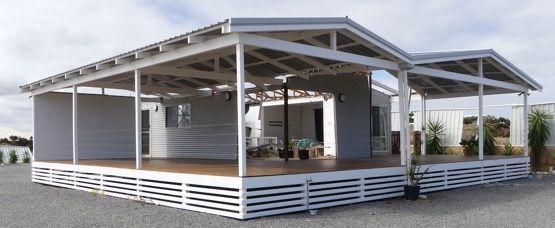
Cyclone Testing Station                                                                        TR66

1.4.    Wind Region B
The wind loading Standards, AS/NZS 1170.2 (Standards Australia, 2011) and AS 4055
(Standards Australia, 2012), divide Australia into Wind Regions, as shown in Figure 1-2.

          Figure 1-2 Wind Regions in Australia (from AS/NZS 1170.2:2011, Standards Australia)

Kalbarri, Northampton, Port Gregory and Geraldton, which were the focus of this report, are
in Wind Region B and are located within the red rectangle shown in Figure 1-2. Some other
towns that experienced damage, such as Mingenew, Three Springs, Carnamah and Mullewa
were also in Wind Region B. Other towns in which damage was also reported, Morawa, and
Perenjori, Dalwallinu and Mukinbudin, are in Wind Region A. (These towns are shown in Figure
2-1.)

                                                  10
Cyclone Testing Station TR66
2. SEVERE TROPICAL CYCLONE SEROJA
2.1. BoM Information
A slow-moving tropical low developed near the southwestern end of the island of Timor on 3
April. Due to the low-pressure system remaining slow moving for several days, sustained and
heavy rainfall caused extensive flooding and landslides on Timor and neighbouring islands.
Widespread and devastating damage was reported including more than 150 fatalities.
The low-pressure system intensified and on 5 April it was named Seroja by Jakarta TCWC. It
started moving initially west and then southwest, quickly intensifying into a category 2 tropical
cyclone. As it continued moving southwest during 6 and 7 April the system weakened back to
a category 1 system. During 8 and 9 April it began to interact with another tropical low, that
briefly intensified into Tropical Cyclone Odette. Over a period of approximately 36-48 hours
the two systems interacted via the Fujiwara effect, a phenomenon rarely observed in the
Australian region.
The interaction with Odette is likely to have been a factor in maintaining Seroja's track towards
the southwest, rather than recurving into the west Pilbara coast. As Odette circled around to
the north and then the east of Seroja, it also made conditions more favourable for
intensification by replacing the dry air that had been limiting Seroja's intensity with moist air
that could fuel its intensification. The increased moisture combined with lower vertical wind
shear resulted in Seroja re-intensifying into a category 2 while Odette weakened and
eventually dissipated.
During 10 April, Seroja took a sharp turn towards the southeast and began to accelerate
towards the Western Australian coast. The system further intensified into a severe (category
3) tropical cyclone on 11 April and maintained this intensity through to its coastal crossing just
south of Kalbarri around 8pm AWST. It is very unusual for severe tropical cyclones to maintain
their intensity this far south. Impacts at Kalbarri and the nearby town of Northampton were
severe with around 70% of buildings sustaining significant damage, mostly consisting of lost
roofs but with many structures destroyed. Many locations recorded maximum wind gusts more
than 125km/h with the highest being 170km/h from Meanarra Tower near Kalbarri. Seroja
weakened as it moved further inland, though due to its rapid motion destructive winds
extended a long way inland before it eventually weakened below tropical cyclone intensity
early in the morning of 12 April near the town of Merredin.
Widespread power outages were experienced through Western Australia’s Mid-West region
due to fallen trees and power lines.
Tropical Cyclone Seroja was the eighth tropical cyclone and the second severe tropical cyclone
in the Australian region for the 2020/21 season.
**All information relating to intensity and track is preliminary information based on operational
estimates and subject to change following post analysis.**
Extreme values during cyclone event (estimated)
Note that these values may be changed on the receipt of later information
Maximum Category: 3
Maximum sustained wind speed: 120 km/h
Maximum wind gust: 170 km/h
Lowest central pressure: 971 hPa
Source: http://www.bom.gov.au/cyclone/tropical-cyclone-knowledge-centre/history/past-
tropical-cyclones/
Figure 2-1 shows the path of TC Seroja.
11Cyclone Testing Station TR66
Mullewa
Port Gregory Perenjori
North Island Mukinbudin
Mingenew Southern Cross
Three Springs
Carnamah
All times shown are in Australian Western Standard Time (AWST), that is UTC +8 hours.
Figure 2-1 Track of TC Seroja (Bureau of Meteorology)
TC Seroja crossed the coast near Port Gregory at 8:15 pm WST on 11 April 2021, as indicated
in Figure 2-1. The radar image in Figure 2-2 shows that the eye was just north of Port Gregory.
When TC Seroja moved further inland, it weakened until it was classified as a tropical low on
12 April 2021. The remnants of TC Seroja continued tracking south-east causing rainfall and
high winds. The strongest winds were mainly to the north east of its path.
Figure 2-2 Rain radar scans during the landfall of TC Seroja
(Provided by Bureau of Meteorology)
Note: Times are in UTC (add 8 hours to convert to WST).
12Cyclone Testing Station TR66
2.2. TC Seroja – a severe tropical cyclone in Wind Region B of WA
It is not unusual for tropical cyclones to travel into and even south of Wind Region B. Figure
2-3 shows tracks of tropical cyclones that have passed south of Kalbarri over the past 50 years.
The BoM classified at least three of those shown in Figure 2-3 as severe cyclones, so they may
have had similar intensities to TC Seroja. The last time the SES was deployed to address
tropical cyclone damage to buildings in the area was after TC Wally in 1976.
Although the wind speed estimated on land for TC Seroja was the highest for a tropical cyclone
in 50 years in this region, wind speeds in some other cyclones at around the same latitude
while they were over the ocean were similar to TC Seroja. The design wind event for
Importance Level 2 buildings has a probability of 1/500. The estimated annual probability of
the peak gust over land in TC Seroja was between 1/70 and 1/180 based on Table 3.1A in
AS/NZS 1170.2:2011. The wind speeds in all towns in Wind Region B within the affected area
were less than the design wind speed.
Tropical cyclones are expected in Wind Region B and are part of the design criteria. Wind
Region B wraps around the tropical cyclone Wind Regions C and D and is a transition to Wind
Region A, where the design wind events are often associated with severe thunderstorms.
TC Elaine (1999)
TC Bruno (1982)
TC Iggy (2012) TC Billy-Lila (1986)
TC Wally (1976)
TC Bianca (2011)
TC Alby (1978) TC Ned (1989)
Figure 2-3 Cyclone tracks in the south of WA 1971 to 2018
(available Bureau of Meteorology website)
2.3. BoM Anemometer data
Several BoM Automated Weather Stations (AWS) recorded wind data during the passage of
TC Seroja. Figure 2-4(a) shows the raw 3-second data from the BoM anemometers at
Carnarvon, Shark Bay, North Island (Abrolhos Islands), Geraldton, Morawa, Dalwallinu, and
Southern Cross. Figure 2-4(a) shows the data in real-time, and Figure 2-4(b) shows the mean
sea level (MSL) pressure.
13Cyclone Testing Station TR66
Gust speed
Carnarvon Shark Bay North Island Geraldton Morawa Dalwallinu Southern Cross Esperance
140 TC Seroja
TC Odette
120
100
80
60
40
20
0
8/4/21 0:00 9/4/21 0:00 10/4/21 0:00 11/4/21 0:00 12/4/21 0:00 13/4/21 0:00 14/4/21 0:00 15/4/21 0:00 16/4/21 0:00
(a) Anemographs showing 3-second gusts
Pressure
Carnarvon Shark Bay North Island Geraldton Morawa Dalwallinu Southern Cross Esperance
1030 TC Seroja
TC Odette
1020
1010
1000
990
980
970
8/4/21 0:00 9/4/21 0:00 10/4/21 0:00 11/4/21 0:00 12/4/21 0:00 13/4/21 0:00 14/4/21 0:00 15/4/21 0:00 16/4/21 0:00
(b) Barograph showing MSL pressure
Figure 2-4 BoM AWS time histories of 3-second gust wind speed and MSL pressure
The BoM’s AWS recorded a peak wind gust of 120 km/h at Geraldton Airport, which is located
on flat land with winds approaching over Terrain Category 2, as defined in AS/NZS 1170.2
(Standards Australia, 2011). Table 2-1 presents the data for the AWS in the vicinity of TC
Seroja’s path.
Table 2-1 BoM AWS data
Site Max 3s Position
Lowest MSL
Gust Direction Time/Date relative to the
pressure [hPa]
[km/h] path
Carnarvon 107 N 12:47 1002 230 km NE of
11/4/21 path
Shark Bay 91 NNE 13:47 998 150 km NE of
11/4/21 path
North 78 ESE 19:10 987 70 km SW of
Island 11/4/21 path
Geraldton 120 E 21:00 976 20 km SW of
11/4/21 path
Morawa 119 NNW 23:26 987 35 km NE of
11/4/21 path
Dalwallinu 107 NNE 00:50 981 15 km SW of
12/4/21 path
Southern 93 N 04:30 992 80 km NE of
Cross 12/4/21 path
14Cyclone Testing Station TR66
2.3.1. Wind speeds as a percentage of design wind speed
The BoM anemometers reported 3-second peak gusts. However, the design gusts (VR)
presented in AS/NZS 1170-2 are 0.2-second gusts. To compare the observed wind speeds with
the design wind speeds, the data was converted to the same basis as VR in AS/NZS 1170.2, i.e.:
• 0.2-second gust;
• flat land;
• open terrain; and
• no shielding.
Conversions removed topographic influence from measured mean and gust wind speeds. Gust
factors for each instrument were calculated from the mean and gust wind data and the
instrument's characteristics. Terrain corrections to the gusts were made based on estimations
of the terrain roughness of each site in the direction of the measured wind speed using the
factors in AS/NZS 1170.2. Finally, the gusts were converted from 3-sec gusts to 0.2-sec
equivalents.
The converted data is summarised in Table 2-2. They were compared with the design wind
velocity (VR) for Importance Level 2, i.e., appropriate for housing and smaller commercial and
public buildings – an annual probability of exceedance of 1:500 or V500.
Table 2-2 BoM Anemometer data as a percentage of V500
Location Wind VR (1:500) 3 s gust @ 10m 0.2 s gust @ % V500
Region [m/s] [m/s] 10m [m/s]
design
Carnarvon D 88 29.7 33.3 38%
Shark Bay C 69 25.3 28.3 41%
North Island B 57 21.7 24.2 42%
Geraldton B 57 33.3 37.5 66%
Morawa A 45 33.1 37.1 83%
Dalwallinu A 45 29.7 33.3 74%
Southern Cross A 45 25.8 28.9 64%
Table 2-2 shows that all BoM anemometer locations near the track of TC Seroja experienced
winds less than the design wind speed. Two of these, Morawa and Southern Cross, were quite
close to the band of maximum wind speeds associated with TC Seroja. Morawa was quite
close to the point at which the band of maximum winds passed from Wind Region B into Wind
Region A and recorded a peak gust (corrected to 0.2 s) of around 83% of the design wind speed
for Wind Region A. No towns in Wind Region A would have experienced wind speeds above
the design wind speeds.
In addition to the data from the BoM AWS, information was also available from a sonic
anemometer on Meanarra Hill. Correcting the data from this station to the same basis as VR
presented in AS/NZS 1170.2 gave an estimation of the peak gust of between 46 and 51 m/s
(166 and 184 km/h). This wind speed is between 80% and 90% of the design wind speed for
Importance Level two buildings (e.g., houses) in Kalbarri.
15Cyclone Testing Station TR66
2.4. Wind field study area
The wind field models discussed in Section 2.4 were calibrated using the anemometer data
from Geraldton and Morawa (presented in Table 2-2), the sonic anemometer on Meanarra
Hill near Kalbarri, and the ‘windicator’ (damage to road signs) data. (‘Windicator’ data are
presented in Appendix 1.)
A Holland model was used to generate the wind field in the study area using the
meteorological attributes of TC Seroja, taking into account its high forward speed and the
asymmetry of the convection in the system. The wind field showed that the weakening of the
cyclone as it progressed over land was less pronounced than expected.
The output of the model was converted to 0.2-second gust wind speeds and combined with
the anemometer data from the BoM automatic weather stations shown in Table 2-2 to derive
contours of the wind speed across the study area. These contours were compatible with the
‘windicator’ analyses (refer to Appendix 1) and were used to generate the contours of the
percentage of design wind speed shown in Figure 2-5.
The peak gust wind speed at Kalbarri was estimated by analysis of sonic anemometer data at
nearby Meanarra Hill. It was around 80% to 90% of the design wind speed for Importance
Level 2 buildings in Wind Region B. The peak gust wind speed would have produced 65% to
80% of the design wind pressure for those buildings.
Figure 2-5 TC Seroja Wind speeds in the investigation area as a percentage of the design wind speed for
Importance Level 2 buildings in Wind Region B
The wind field is compatible with the data in Table 2-1. It shows that Kalbarri experienced the
highest gust wind speeds over land in the region, which accounts for the higher levels of
damage in Kalbarri and Northampton compared with Geraldton and Port Gregory.
16Cyclone Testing Station TR66
The band of maximum wind speeds shown in Figure 2-5 indicate that the maximum wind gusts
passed over Kalbarri and then within 20 km of Northampton. The band of maximum wind
gusts entered Wind Region A over Morawa (just off the lower-left corner of the map). It then
continued over Perenjori, Mukinbudin and Westonia. DFES reported damage at all of these
locations. The wind field and anemometer data over the cyclone's track over the Wheatbelt
areas of WA showed that the peak wind gusts decreased by around 4 m/s for each 100 km of
travel.
2.5. Buildings of other Importance Levels
The National Construction Code (NCC) links different Annual Exceedance Probabilities (AEPs)
to buildings with different Importance Levels. The Importance Levels relate to the number of
people that could be expected in the building, or its function during and immediately after a
severe loading event.
Figure 2-6 shows that Importance Level 4 buildings can include hospitals, police stations,
ambulance depots and buildings used by emergency services such as DFES. Several
Importance Level 4 buildings were damaged during TC Seroja. It is important that design briefs
for these buildings make it clear that their function requires a higher design level
corresponding to a 1:2000 AEP.
Figure 2-6 Design criteria for buildings with different Importance Levels (NCC)
17Cyclone Testing Station TR66
3. ESTIMATES OF DAMAGE FROM RAPID DAMAGE ASSESSMENT
3.1. Rapid Damage Assessment data
The WA Department of Fire and Emergency Services (DFES) provided Rapid Damage
Assessment (RDA) data. Trained personnel collected the data using hand-held electronic
devices. The RDA data are collected to complement the data from Requests for Assistance
(RFA) received by DFES to form a more focused and coordinated response and recovery in the
immediate aftermath of severe weather events. The RDA assigns a level of damage to each
building. RDAs are conducted from the street and may miss internal damage and wall, roof or
structural damage not visible from the road. Therefore, reported information on damage
intensity, mode and frequency underestimates the actual damage.
The damage levels assigned in the RDAs were compared with the damage to buildings
observed by the CTS team and with photos taken during the RDAs. These comparisons led to
the following interpretations of the RDA damage levels:
• Slight damage – largely non-structural damage, e.g. dented roofing, damage to
gutters and finishes, fences;
• Moderate damage – damage to small areas of the building, e.g. broken windows or
doors, loss of or a relatively small part of the roof;
• Severe damage – damage to large areas of the building and houses are probably
uninhabitable, e.g. most of the roof missing, many windows broken
• Total damage – building destroyed and uninhabitable, e.g. loss of all of the roof,
missing walls
3.2. Distribution of damage
RDAs for Kalbarri are shown in Figure 3-1 and Figure 3-2. For this investigation, Kalbarri was
divided into three areas based on the estimated year of construction of most houses in each
area:
• Kalbarri A – town centre; some commercial buildings and generally older houses
constructed before 2000; few vacant blocks.
• Kalbarri B – the area adjacent to and just south of the main town centre; no
commercial buildings; generally, houses built since around 1990; more developed
blocks than vacant blocks.
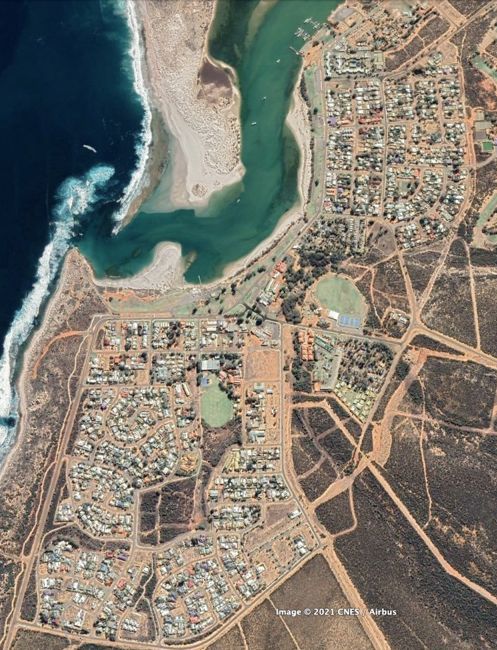
• Kalbarri C – new subdivisions around 5 km south of the Kalbarri town centre and
east of George Grey Road; no commercial buildings; houses constructed since 2000;
more vacant blocks than developed blocks.
Figure 3-3 and Figure 3-4 shows RDAs for Northampton and Port Gregory.
18Cyclone Testing Station TR66
Kalbarri A
Kalbarri B
Figure 3-1 RDA damage points for buildings in north Kalbarri
(undamaged buildings are not shown)
Kalbarri C
Figure 3-2 RDA damage points for contemporary houses in south Kalbarri
(undamaged buildings are not shown)
19Cyclone Testing Station TR66
Figure 3-3 RDA damage points for buildings in Northampton
(undamaged buildings are not shown)
Figure 3-4 RDA damage points for buildings in Port Gregory
(undamaged buildings are not shown)
20Cyclone Testing Station TR66
CTS extracted data relating to damage to the building envelope or structure. Table 3-1
summarises the information on damage to houses from the RDAs for Kalbarri, Northampton
and Port Gregory. (The areas defined by Kalbarri A, Kalbarri B and Kalbarri C are shown in
Figure 3-1 and Figure 3-2.) RDAs were not performed in Geraldton as the level of damage was
significantly less than in the other areas.
Table 3-1 Summary of RDA – Percentage of damage to buildings observed from the street
Levels of damage
Locality Total No. Undamaged Slight Moderate Severe Total
buildings damage damage damage damage
Kalbarri A 520 54% 21% 13% 9% 3%
Kalbarri B 177 84% 7% 5% 3% 1%
Kalbarri C 127 24% 43% 21% 10% 2%
Northampton 575 53% 26% 11% 10% 1%
Port Gregory 61 64% 21% 7% 5% 3%
Note: The percentages represent the number of buildings categorised with wind damage divided by the
total number of buildings in each locality.
Table 3-1 and Figure 3-5 show that:
• More than 10% of buildings in Kalbarri A (61 buildings), Kalbarri C (14 buildings), and
Northampton (58 buildings) sustained damage evaluated as ‘severe’ or ‘total’.
• Although the buildings in Kalbarri C are newer, the percentage of ‘slight’, ‘moderate’
and ‘severe’ damage were highest, and the percentage of ‘undamaged’ buildings
was lowest.
• Kalbarri B had significantly lower ‘severe’ or ‘total’ damage and a higher percentage
of undamaged buildings than other areas. This may be because the houses in that
area were a little more protected by the surrounding topography.
Level of damage to buildings (RDA)
Undamaged Slight Moderate Severe Total
100%
90%
80%
70%
60%
50%
40%
30%
20%
10%
0%
Kalbarri A Kalbarri B Kalbarri C Northampton Port Gregory
Figure 3-5 RDA damage levels
21Cyclone Testing Station TR66
4. WIND DAMAGE TO CONTEMPORARY BUILDINGS
In this report, contemporary buildings are those constructed since the late 1990s. The most
significant number of damaged contemporary houses in the study area was in Kalbarri, so this
section focuses on damage to homes in Kalbarri – particularly Kalbarri B and Kalbarri C, where
all the buildings were houses.
The maximum wind gusts in the worst affected areas of the study were around 80% to 90% of
the design ultimate wind speed for houses (producing 65% to 80% of the design wind load).
Under these loads, there were structural failures in many contemporary homes in Kalbarri.
Section 2.4 indicated that the peak wind gust speeds in Geraldton were significantly lower
than the design wind speed for their locations.
The RDAs evaluated the damage level for the whole building, then indicated whether the
damage was mainly to the roof or the walls. Figure 4-1 shows significantly more damage to
roofs than walls, and the contemporary houses in Kalbarri C were damaged more than
buildings in other areas. The performance of roofs significantly influenced the level of overall
damage to buildings. (Figure 3-5 is almost identical to Figure 4-1(a).) Wind actions apply uplift
forces to the roof cladding. A secure chain of structural elements and connections is required
to transmit the forces from the roof cladding to the ground. This is illustrated in Figure 4-2.
Level of damage to roofs Level of damage to walls
Undamaged Slight Moderate Severe Total Undamaged Slight Moderate Severe Total
100% 100%
90% 90%
80% 80%
70% 70%
60% 60%
50% 50%
40% 40%
30% 30%
20% 20%
10% 10%
0% 0%
Kalbarri A Kalbarri B Kalbarri C Northampton Port Gregory Kalbarri A Kalbarri B Kalbarri C Northampton Port Gregory
(a) % buildings with predominant damage to roofs (b) % buildings with predominant damage to walls
Figure 4-1 Level of damage to roofs and walls
Roof sheeting and roof
sheeting fasteners
Battens and batten to
truss fasteners
Truss to wall fasteners
Uplift load transfer
through the wall
Uplift load transfer
through the floor
Figure 4-2 Tie-down chain
(excerpt from Weather the Storm https://weatherthestorm.com.au/
22Cyclone Testing Station TR66
The elements that form part of this chain include:
• roof cladding (tiles or sheeting)
• roofing fasteners – carry loads from the sheeting to the battens/purlins;
• battens/purlins
• battens/purlins to rafters/trusses connections – carry loads from battens/purlins to the
rafters/trusses;
• rafters or trusses
• tie-downs from rafters/trusses to the top of walls – carry loads from the rafter/trusses
fasteners to the tops of the walls;
• uplift load transfer within the wall (from the top plate to the base of the wall for framed
walls or within bricks for brick walls;
• uplift load transfer from the bottom of the wall to the floor system or concrete slab; and
• uplift load transfer through the floor and sub-floor systems to the ground.
The main cause of severe structural damage to houses in Kalbarri was an increase in internal
pressure created by an opening in the building envelope (usually from debris breaking a door
or window). The following sub-sections present observations of damage to components in the
tie-down chain and other parts of the house that provide integrity of the building envelope to
resist internal pressurisation and water ingress, such as windows and doors gutters and
flashing.
4.1. Wind-borne debris
Figure 4-3 shows examples of debris from contemporary houses in the airstream during TC
Seroja.
Figure 4-3 Examples of wind-borne debris
23Cyclone Testing Station TR66
The wind-borne debris in this event included whole roofs, portions of roofs, verandas, and
tree branches, similar to debris generated during cyclones in Wind Regions C and D. Parts of
roof structures with sheeting attached were blown hundreds of metres. Some timber roofing
elements speared into the ground or other houses. Figure 4-4 shows some of the damage
caused to homes by wind-borne debris during TC Seroja. Many people were at risk of serious
injury during this event.
(Photos from ABC News website supplied by Ella Curic)
Figure 4-4 Examples of wind-borne debris damage to houses
Many of the debris items that had penetrated buildings and are shown in Figure 4-4, were
assemblies of building parts, such as large portions of a roof. In these cases, a screen that had
resisted the debris impact loading test specified in AS/NZS 1170.2 may not have prevented
penetration. Figure 4-4 shows some walls and a roof that were penetrated by debris; screens
cannot protect walls and roofs.
The trajectories of some of the larger items of debris were tracked (see Figure 4-5). Some
debris was blown over two hundred metres, similar to observations during damage
investigations in Wind Regions C and D.
24Cyclone Testing Station TR66
Figure 4-5 Debris trajectories
4.1.1. Internal pressure
Wind pressure and wind-borne debris that broke windward windows or doors of some houses
created significant positive internal pressure that led to the loss of part or all the roof.
Although there were security screens or wind-rated roller shutters on some homes, no
screens that were likely to have been rated for debris impact were observed in the study.
Wind pressure or wind-borne debris broke windows or doors on the windward side of all the
houses that the investigation team inspected where the whole roof was lost – Figure 4-6
shows an example. Also see Figure 4-7, Figure 4-22, Figure 4-25, Figure 4-28, Figure 4-31.
Figure 4-6 Broken window
Many people said that their home was undamaged until a window or door broke, and the roof
detached at about the same time. This description of the failure is consistent with a house
designed and built to resist the appropriate wind forces using a low design internal pressure.
However, once the broken window or door created a dominant opening, the high internal
pressure caused the net pressure on the roof tie-downs to nearly double, which led to the
failure of critical tie-downs in the roof structure, usually those between the roof and wall.
The investigation team estimates that more than 10% of contemporary houses in Kalbarri had
significant damage to the roof due to internal pressure following damage to doors or
windows. Refer to Appendix 2 for more detail on internal pressure and implications for
designing houses in Wind Region B.
25Cyclone Testing Station TR66
4.2. Roof to wall connections
Failure of connections between roof structures and walls contributed to significant damage
or loss of sections of the roof structure in houses with sheet roofs. The detachment of the
roof structure also generated large items of wind-borne debris. In some cases, the debris
damaged other buildings (refer to Section 4.1).
Figure 4-7 shows a house where the entire roof was lost, and brickwork on the windward wall
collapsed into the lounge room after a door failed and increased the internal pressure inside
the house.
Figure 4-7 Loss of timber-framed roof due to failure of tie-down straps in brickwork
The tie-down straps on the windward wall of the house shown in Figure 4-8 were pulled out
of the brickwork and cracked the wall at the level of embedment. The weight of the brickwork
above the level of embedment was not enough to resist the net uplift load on the roof. There
would have been sufficient weight if the tie-down straps had been embedded in the brickwork
at the base of the wall. The tie-down straps in the wall under the gable end of the roof of this
house hadn’t been secured over the rafters. Although it is not required that tie-downs are
installed in brickwork under the gable ends of roofs, it is recommended, as the highest uplift
forces on the roof are at the gable if the gable wall is the windward wall.
Figure 4-8 Loss of roof structure due to the withdrawal of tie-down straps
Failure of garage doors and the front door of the house shown in Figure 4-9 created high
internal pressure under the roof. The roof over the garage was only around one-fifth of the
floor area of the house, but the roof over more than 80% of the house was lost. The only parts
of the roof that remained were over regions with bedrooms that stayed sealed from the rest
of the house by closed internal doors.
26Cyclone Testing Station TR66
Figure 4-9 Roof loss following the failure of garage doors
Figure 4-10 shows the loss of a skillion roof where the wind was perpendicular to the high
edge of the skillion. The part of the roof with the large overhang failed at the roof to wall
connection. The tie-downs did not have sufficient capacity to resist the high uplift forces (uplift
forces are higher on the overhang region of skillion roofs than the uplift forces on other roof
shapes). The roof from this house was found more than 200 metres away.
Figure 4-10 Failure of a skillion roof at the roof to wall connection
The houses illustrated in Figure 4-7, Figure 4-8, Figure 4-9 and Figure 4-10 each had a timber-
framed roof anchored to the double brick wall with tie-down straps.
The weight of brickwork in the internal leaf above the embedment point of the straps was not
enough to anchor the uplift forces for region B wind forces combined with the internal
pressure. None of the straps had broken but had withdrawn from the brickwork. The limit of
performance of tie-downs between framed roofs and cavity brick walls was the weight of
bricks engaged by the straps.
Figure 4-11(a) shows a transportable house that had been positioned on site, refurbished, and
surrounded by a veranda. The house lost its roof, but the verandas remained intact. The
verandas (Figure 4-11(b)) had been specifically designed for the site, but the wind design of
the original transportable house was unknown. Although the building had been refurbished
and the quality of the finishes was high, it appeared that the structural details in the roof were
the original ones and may not have been appropriate for the wind classification for the site.
27Cyclone Testing Station TR66
(a) Rear view of the transportable house
(b) Front view of transportable house showing verandas
Figure 4-11 Loss of house roof though large verandas remained
There were signs that the roofs of several houses had partially lifted off walls. An example is
shown in Figure 4-12(a)and (b). These cases indicate that although the ultimate strength of
the connections was sufficient, there was excessive deformation in the connections. In the
house shown in Figure 4-12, the tiedown straps were angled to the outside of the building
(highlighted by the red ellipse in Figure 4-12(c)), and they had cracked the outside upper
courses of the external leaf when they straightened under uplift loads.
28Cyclone Testing Station TR66
(a) Roof partially lifted off external walls
(b) Roof partially lifted off internal walls (c) Tie-down straps
Figure 4-12 Signs that the roof had lifted from the wall though not completely detached
Failures of the roof to wall connections discussed in this section were often associated with
window failures, as shown in Figure 4-13. The link between this type of failure and internal
pressure was demonstrated in many new and refurbished residential buildings in Kalbarri.
Figure 4-13 Refurbished buildings with broken windows and substantial roof loss
29Cyclone Testing Station TR66
4.3. Batten to truss or rafter connections
Figure 4-10 shows a skillion roof that lost the whole roof structure. The skillion roof in Figure
4-14 (a) and (b) also failed, but in this case, it was the batten to rafter connections that failed
due to tear out around the tek screws shown in Figure 4-14(c). The loss of a large windward
window increased the net uplift forces in this part of the house, and the overall uplift forces
on the room were enough to lift the room at floor level, as shown in Figure 4-14(d).
(a) Loss of roof (b) Batten to rafter failure
(c) Tear-out of battens around tek screws (d) Lifting of walls at floor level
Figure 4-14 Failure of a skillion roof at batten to rafter connections
Damage to a steel-framed house shown in Figure 4-15 was caused by the failure of batten to
rafter connections after a double front door blew in. In this case, the small tek screws used to
fasten the top hat battens pulled out of the truss top chords. Several screws were still in the
batten flanges. Use of batten and rafter systems with recommended tek screws justified by
test results can avoid the type of damage illustrated in Figure 4-13 and Figure 4-14.
Figure 4-15 Failure of batten to rafter connection by the withdrawal of tek screws
30Cyclone Testing Station TR66
An upper storey of the house shown in Figure 4-16(a) sustained significant damage to the roof
following full internal pressurisation of the roof space. Damage to the roof started with
tension perpendicular to the grain in the rafters in the raked ceiling. Battens were fastened
with screws, (c) Failure of rafters
Figure 4-16(b), and effectively gripped the upper surface of the deep rafters. As the rafters
were anchored to the wall frames at the base of the rafters, the uplift from the batten screws
caused tension in the rafters perpendicular to the grain. Several connections at the windward
end of the roof failed in tension perpendicular to the grain, as highlighted in Figure 4-16(c).
Failure of timber in tension perpendicular to grain can be avoided by ensuring that the
anchorage at each end of deep rafters (> 170 mm deep) attaches to the full height of the
rafter.
(a) Damage to roof (b) Screws at base of rafter
(c) Failure of rafters
Figure 4-16 Tension perpendicular to the grain in rafters
31Cyclone Testing Station TR66
4.4. Roof cladding
The RDA data was used to investigate whether there is a difference in performance between
different roof materials. Roofs in Kalbarri were categorised into tile, metal sheet and fibre
cement roofs. Fibre cement roofs include products that may contain asbestos, and were only
used on some buildings in Kalbarri A. There was a total of 55 clay or concrete tile roofs and
714 metal sheet roofs, and 55 fibre cement roofs (including those with asbestos) on houses in
the RDA assessment of Kalbarri. Figure 4-17 presents a direct comparison of the damage to
tile, fibre cement and metal sheet roofs aggregated for all areas in Kalbarri.
• No tile roofs had ‘total damage’, but many had ‘slight’ and ‘moderate’ levels of
damage (44%).
• More metal sheet roofs were classified as ‘undamaged’ (66%) than tile roofs (53%).
• More metal sheet roofs were evaluated as ‘severe’ and ‘total damage’ (10%) than
tile roofs (4%).
• Nearly all of the fibre cement roofs in Kalbarri suffered some damage, with around
30% ‘moderate’ or ‘severe’ (also refer to Section 5.4).
Level of roof damage
Undamaged Slight Moderate Severe Total
100%
90%
80%
70%
60%
50%
40%
30%
20%
10%
0%
Til es (55) Metal sheet (714) Fibre cement (55)
Figure 4-17 Comparison of damage to tile and sheet roofs
The damage to tile roofs was mainly the loss of individual tiles with the level of damage related
to the area of tiles that were missing from the roof. There were no cases where all the tiles
were blown off the roof. However, several entire metal sheet roofs failed at the wall
connections. In most cases, the ‘Total damage’ and ‘Severe damage’ classifications
represented the loss of the entire roof structure above the walls, as illustrated in Figure 4-7
and Figure 4-8. In other cases, the damage was the complete loss of the roofing with battens
attached, as shown in Figure 5-2. There were many cases of metal sheet roofs with no damage
or relatively minor damage. The ‘Slight’ damage to metal sheet roofs represented debris
impact to the roof or damage at the edge of roofs.
4.4.1. Metal sheet roofs
The loss of many metal sheet roofs was caused by failures deeper in the structure, such as the
roof to wall connections or batten-to-rafter connections. There were few cases where the
sheeting had separated from the roof without battens.
However, the investigation team noted signs of cracking in roof sheeting like that seen in
damage caused by cyclones in Wind Region C. TC Seroja was a short duration cyclone. The
damage shown in Figure 4-18(a) was probably caused by local plastic deformation (LPD) over
a small number of cycles due to the large spacing between fixings. A low-high-low test of the
roofing system would have identified this failure mode if the fixing pattern contributed to LPD.
Figure 4-18 shows some examples of failures in roof sheeting where fasteners had pulled
through the sheeting.
32Cyclone Testing Station TR66
Figure 4-18 Failures in roof sheeting by fastener pull-through
Roof sheeting systems need to be tested with cyclic loading regimes when used where the
design wind speed is associated with tropical cyclones.
4.4.2. Tile roofs
No tile roofs were lost entirely, but many tile roofs had damage to ridge and hip capping or
had lost individual tiles. Some examples of ridge tile damage are shown in Figure 4-19. Capping
is always located in zones of high local pressure factors. AS 2050 requires mechanical fixing of
capping, but there was little evidence of mechanical fixing in the separated ridge tiles.
Figure 4-19 Examples of damage to ridges and hips on tile roofs
Figure 4-20 shows extensive damage to a home built in 2003. The wind started lifting the tiles
along the edges of the roof. Many tiles and some tile battens were lost, and large volumes of
rain entered the house. Tiles were lost from both the single and two-storey roofs. The tiles
became wind-borne debris that damaged eaves linings, glass balustrades and other elements
on the house.
The adjacent garage had the same tiles fixed in the same way as the house, but the roof tiles
were not damaged. The roller doors on the garage failed so that the roof would have
experienced full internal pressure. The only noticeable difference between the garage and the
house was that the garage had eaves gutters, and the house didn’t.
33You can also read