TROPOMI/S5P ATBD of tropospheric ozone data products - Sentinel
←
→
Page content transcription
If your browser does not render page correctly, please read the page content below
TROPOMI/S5P ATBD of tropospheric
ozone data products

document number : S5P-L2-IUP-ATBD-400C
authors : Klaus-Peter Heue, Kai-Uwe Eichmann, Pieter Valks
issue : 2.2
date : 2020-06-15
status : Released
S5P/TROPOMI Tropospheric Ozone ATBD S5P-L2-IUP-ATBD-400C
issue2.2, 2020-06-15 Page 2 of 40

Document approval record

 digital signature
 Digitally signed by

 Klaus- Klaus-Peter Heue
 DN: C=DE, S=Bavaria,
 O=DLR, OU=IMF-ATP,
 Digital
 Kai-Uwe unterschrieben von
 CN=Klaus-Peter Heue,
prepared: Peter E=Klaus-Peter.Heue@DL
 R.de
 Location: Oberpfaffenhofen
 Kai-Uwe Eichmann
 Eichmann Datum: 2020.06.22
 18:07:34 +02'00'
 Heue
 Date: 2020-06-22 15:15:52
 Foxit PhantomPDF
 Version: 9.3.0

checked:

 Digitally signed by
 Diego Loyola

approved Pi:
 Diego DN: C=DE, O=DLR,
 CN=Diego Loyola,
 E=Diego.Loyola@dlr.de

 Loyola Reason: I am approving
 this document
 Date: 2020-07-08 09:
 52:09

approved PM:

approved CM:
S5P/TROPOMI Tropospheric Ozone ATBD S5P-L2-IUP-ATBD-400C
issue2.2, 2020-06-15 Page 3 of 40

Document change record
issue date item Comments
0.0.5 2013-04-09 All Initial draft version
0.1.0 2013-06-26 Internal review comments worked in
0.9.0 2013-12-02 Updated version
0.10.0 2014-03-14 Updated version for CDR
 Chapter 4 removed
 Chapter 8 rewritten
 Added Chapters 9 and 10
 Many updates/changes in other Chapters
0.11.0 2014-09-30 I/O tables introduced,
 Corrections due to L2-CDR RIDs from June 2014
 Harmonization of symbols across ATBDs.
0.11.1 2015-06-29 Algorithm implementation guideline added
0.13 2015-09-04 Update for limited release to S5p Validation Team
 Implementation of verification chapter for cloud slicing
1.0 2015-11-16 Error analyses for CSA updated, Minor corrections
1.5 2018-04-30 All Updates following the commissioning phase
1.6 2018-09-30 All corrections and clarifications
2.1 2020-02-28 All removed NRTI algorithm, general updates
 8 validation replaced by reference to MPC ROCVR
2.2 2020-06-15 All general update, CSA update to TROMPOMI results from
 Phase E2
S5P/TROPOMI Tropospheric Ozone ATBD S5P-L2-IUP-ATBD-400C
issue2.2, 2020-06-15 Page 4 of 40

Contents
Document approval record ..................................................................................................... 2
Document change record ........................................................................................................ 3
Contents .................................................................................................................................... 4
1 Introduction ................................................................................................................ 5
1.1 Identification ................................................................................................................. 5
1.2 Purpose and objective ................................................................................................. 5
1.3 Document overview ..................................................................................................... 5
2 Applicable and reference documents...................................................................... 6
2.1 Applicable documents .................................................................................................. 6
2.2 Standard documents .................................................................................................... 6
2.3 Reference documents .................................................................................................. 6
2.4 Electronic references ................................................................................................... 6
3 Terms, definitions and abbreviated terms .............................................................. 7
3.1 Acronyms and abbreviations ....................................................................................... 7
4 Introduction to the TROPOMI/S5P tropospheric ozone data products ............... 9
4.1 Ozone in the troposphere ............................................................................................ 9
4.2 Tropospheric ozone retrieval heritage ....................................................................... 10
4.3 Tropospheric ozone data product requirements ....................................................... 11
4.4 Tropospheric ozone data retrieval for TROPOMI/S5P .............................................. 12
5 Algorithm description .............................................................................................. 13
5.1 S5P_TROPOZ_CCD, Convective-Cloud-Differential method (CCD) ....................... 13
5.1.1 Tropospheric ozone column product .......................................................................................15
5.1.2 Data quality values ..................................................................................................................16
5.1.3 Algorithm input ........................................................................................................................16
5.1.4 Algorithm output ......................................................................................................................17
5.2 S5P_TROPOZ_CSA, Cloud Slicing Algorithm (CSA) ............................................... 19
5.2.1 Product description and heritage ............................................................................................19
5.2.2 Product requirements ..............................................................................................................19
5.2.3 Overview of the retrieval method ............................................................................................19
5.2.4 Algorithm input ........................................................................................................................24
5.2.5 Algorithm output ......................................................................................................................25
6 Feasibility .................................................................................................................. 27
6.1 S5P tropospheric ozone product description and size .............................................. 27
6.2 TROPOMI and auxiliary information needed by the processing system .................. 27
7 Error analyses .......................................................................................................... 29
Total ozone .............................................................................................................................................29
Cloud parameter .....................................................................................................................................29
7.1 CCD method .............................................................................................................. 30
7.1.1 Uncertainties in cloud properties .............................................................................................30
7.1.2 Stratospheric ozone column uncertainties ..............................................................................31
7.2 Cloud slicing method .................................................................................................. 33
8 Validation .................................................................................................................. 34
9 Conclusions .............................................................................................................. 35
References .............................................................................................................................. 36
S5P/TROPOMI Tropospheric Ozone ATBD S5P-L2-IUP-ATBD-400C
issue2.2, 2020-06-15 Page 5 of 40

1 Introduction
1.1 Identification
This document, identified as S5P-L2-IUP-ATBD-400C, is the Algorithm Theoretical Basis
Document (ATBD) for the TROPOMI/S5P tropospheric ozone data products. It is part of a
series of ATBDs describing the TROPOMI/S5P Level-2 products.
The document describes the algorithms for the retrieval tropical tropospheric ozone from
TROPOMI/S5P measurements using data from the TROPOMI/S5P Level 2 OFFL total ozone
and cloud products.

1.2 Purpose and objective
The purpose of this document is to describe the theoretical basis and the implementation of
the tropospheric ozone algorithms for TROPOMI/S5P. The document is maintained during
the development phase and the lifetime of the data products. Updates and new versions will
be issued in case of changes in the algorithms.
The algorithms for tropospheric ozone retrievals are reported here. The convective-cloud-
differential algorithm (CCD) derives tropospheric ozone columns (TCO) by taking differences
between total columns under clear-sky conditions and above-cloud ozone columns. The
cloud slicing algorithm (CSA) retrieves mean upper tropospheric ozone volume mixing ratios
above clouds from TROPOMI/S5P measurements. We call the algorithms
S5P_TROPOZ_CCD and S5P_TROPOZ_CSA, respectively.
Input data, auxiliary data, and the generated output are explained. In addition, information
about the size of the product, calculation times, and the accuracy are provided.

1.3 Document overview
Section 4 provides an introduction on tropospheric ozone, followed by a description of the
CCD and CSA algorithms in Section 5. In Section 6, the feasibility is discussed with special
attention to efficiency of the calculations. An error analysis of CCD and CSA algorithms is
given in Section 7.

S5P/TROPOMI Tropospheric Ozone ATBD S5P-L2-IUP-ATBD-400C
issue2.2, 2020-06-15 Page 6 of 40

2 Applicable and reference documents
2.1 Applicable documents
[AD01] GMES Sentinel-5 Precursor – S5P System Requirement Document (SRD);
 source: ESA/ESTEC; ref: S5P-RS-ESA-SY-0002; issue: 4.1; date: 2011-04-29
[AD02] Sentinel-5P Level 2 Processor Development – Statement of Work -;
 source: ESA; ref: S5P-SW-ESA-GS-053; issue: 1; date: 2012-03-02

2.2 Standard documents
[SD01] Space Engineering – Software;
 source: ESA / ECSS; ref: ECSS-E-ST-40C; date: 6 March 2009
[SD02] Space Product Assurance – Software Product Assurance;
 source: ESA / ECSS; ref: ECSS-Q-ST-80C; date: 6 March 2009

2.3 Reference documents
[RD01] Terms, definitions and abbreviations for TROPOMI L01b data processor;
 source: KNMI; ref: S5P-KNMI-L01B-0004-LI; issue: 1.0.0; date: 2011-09-15
[RD02] Terms and symbols in the TROPOMI Algorithm Team;
 source: KNMI; issue: 0.0.3, ref: SN-TROPOMI-KNMI-049; date: 2012-09-20.
[RD03] GMES Sentinels 4 and 5 Mission Requirements Document;
 source: ESA/ESTEC; ref: EOP-SMA/1507/JL-dr; issue: 3; date: 2011-09-21.
[RD04] Science Requirements Document for TROPOMI. Volume 1;
 source: KNMI & SRON; ref: RS-TROPOMI-KNMI-017; issue: 2.0; date: 2008-10-
 30.
[RD05] CAPACITY: Operational Atmospheric Chemistry Monitoring Missions – Final report;
 source: KNMI; ref: CAPACITY; date: Oct. 2005.
[RD06] CAMELOT: Observation Techniques and Mission Concepts for Atmospheric
 Chemistry;
 source: KNMI; ref: RP-CAM-KNMI-050; date: Nov. 2009.
[RD07] TRAQ: Performance Analysis and Requirements Consolidation - Final Report;
 source: KNMI; ref: RP-ONTRAQ-KNMI-051; date: Jan. 2010.
[RD08] S5P/TROPOMI ATBD cloud products;
 source: DLR; ref: S5P-DLR-L2-400I; issue: 2.2; date: 2020-06-15.
[RD09] S5P/TROPOMI ATBD total ozone;
 source: DLR; ref: S5P-DLR-L2-400A; issue: 2.21; date: 2020-06-15.
[RD10] Sentinel-5 precursor/TROPOMI Level 2 Product User Manual O3 Total Column
 source: DLR; ref: S5P-L2-DLR-PUM-400A; issue: 1.0 date: 2018-04-30
[RD11] Sentinel-5 precursor/TROPOMI Level 2 Product User Manual O3 Tropospheric
 Column source: DLR; ref: S5P-L2-DLR-PUM-400C; issue: 1.0 date: 2018-04-30
[RD12] Quarterly Validation Report on the Copernicus Sentinel-5 Precursor Operational
 Data Products; ref: S5P-MPC-IASB-ROCVR; issue: 6.0.1 date: 2020-03-30

2.4 Electronic references
[URL01] http://www.unidata.ucar.edu/software/netcdf/docs/
S5P/TROPOMI Tropospheric Ozone ATBD S5P-L2-IUP-ATBD-400C
issue2.2, 2020-06-15 Page 7 of 40

3 Terms, definitions and abbreviated terms
Terms, definitions and abbreviations that are used in the development programs of the
TROPOMI/S5P L0-1b and L2 data processors are described in [RD01] and [RD02],
respectively. Terms, definitions and abbreviations that are specific for this document can be
found below.

3.1 Acronyms and abbreviations
AAI Absorbing aerosol index
ACCO Above-Cloud Column of Ozone
AMF Air mass factor
CAL Cloud As Layer
CCD Convective-cloud-differential method
CRB Cloud as Reflecting Boundary
CSA Cloud slicing algorithm
DISAMAR Determining Instrument Specifications and Analyzing Methods
 for Atmospheric Retrieval
DISMAS Differential and Smooth Absorption Separated
DOAS Differential Optical Absorption Spectroscopy
ECMWF European Centre for Medium-Range Weather Forecast
EOS-Aura Earth Observing System (Chemistry & Climate Mission)
ERS European Remote Sensing satellite
GOME Global Ozone Monitoring Experiment
HALOE Halogen Occultation Experiment
MetOp Meteorological Operational Satellite
MLS Microwave Limb Sounder
NRT near-real time (i.e. processing within 3 hours of measurement)
OCRA Optical Cloud Recognition Algorithm
OE Optimal Estimation
OMI Ozone Monitoring Instrument
O3M SAF Ozone and atmospheric chemistry Monitoring Satellite
 Application Facility
PDGS Sentinel-5 Precursor Payload Data Ground Segment (at DLR)
PV Potential Vorticity
ROCINN Retrieval of Cloud Information using Neural Networks
SAGE Stratospheric Aerosol and Gas Experiment
SBUV Solar Backscattered Ultraviolet
SCIAMACHY Scanning Imaging Absorption spectroMeter for Atmospheric
 Cartography
SCO Total stratospheric column ozone
S5P/TROPOMI Tropospheric Ozone ATBD S5P-L2-IUP-ATBD-400C
issue2.2, 2020-06-15 Page 8 of 40

SHADOZ Southern Hemisphere Additional Ozone sondes
TOC Total Ozone Column
TOMS Total Ozone Mapping Spectrometer
TOR Tropospheric Ozone Residual
TROPOMI Tropospheric Monitoring Instrument
TCO total tropospheric column ozone
TTOC Tropical Total Ozone Column
UARS Upper Atmosphere Research Satellite
VMR Volume mixing ratio

S5P/TROPOMI Tropospheric Ozone ATBD S5P-L2-IUP-ATBD-400C
issue2.2, 2020-06-15 Page 9 of 40

4 Introduction to the TROPOMI/S5P tropospheric ozone data
 products
4.1 Ozone in the troposphere
The composition of the atmosphere has undergone dramatic changes in the last decades
due to human activities. The quasi-exponential growth in the world population and the
industrialization have led to a strong growth in fossil fuel and biomass burning emissions of
trace gases such as carbon dioxide (CO2), carbon monoxide (CO), nitrogen oxides (NOx),
methane (CH4), and other hydrocarbons. The emissions of nitrogen oxides and hydrocarbons
have resulted in an increase of ozone (O3) near the surface and a degradation of air quality
on a global scale.
Although ozone is a trace gas and constitutes less than 0.001% of the air by volume, it is one
of the most important constituents of the atmosphere. The ozone layer in the stratosphere
protects the biosphere by absorbing harmful solar ultraviolet (UV) radiation. Downward
transport of ozone from the stratosphere contributes to the ozone abundance in the
troposphere, but ozone is also produced in the troposphere by sunlight driven chemical
reaction cycles, involving NOx, CO, CH4 and other hydrocarbons. This can lead to excessive
amounts of ozone near the surface (‘summer smog’), which are toxic to ecosystem, animals
and humans.

Ozone in the tropical troposphere

Ozone in the tropical troposphere plays various important roles. The intense UV radiation
and high humidity in the tropics stimulate the formation of the hydroxyl radical (OH) by the
photolysis of ozone. OH is the most important oxidant in the troposphere because it reacts
with virtually all trace gases, such as CO, CH4 and other hydrocarbons.
The tropopause, which separates the troposphere from the stratosphere, is higher (~17 km)
and colder in the tropics, than at mid- and high latitudes. Since the radiative forcing by ozone
is directly proportional to the temperature contrast between the radiation absorbed and the
radiation emitted, ozone is most efficient as a greenhouse gas in the cold tropical upper
troposphere [Lacis et al., 1990; Foster and Shine, 1997].
The tropics are also characterized by large emissions of nitrogen oxides (NOx), carbon
monoxide (CO) and hydrocarbons, both from natural and anthropogenic sources. Ozone that
is formed over regions where large amounts of these ozone precursors are emitted, can be
transported over great distances and affects areas far from the source [e.g. Thompson et al.,
2001].
Natural emissions of non-methane hydrocarbons (NMHC) from tropical forest and savannahs
are very large, but rather uncertain. Estimates of the magnitude of the biogenic NMHC
emissions indicate that over half of the total NMHC emissions are from natural sources
[Guenther et al., 1995, 2006]. Large amounts of NOx are produced by lightning: between 1
and 20 Tg N yr-1 globally, of which more than 70% in the tropics [e.g. Schumann and
Huntrieser, 2007]. NOx is also released by natural savannah burning and by the tropical soil.
S5P/TROPOMI Tropospheric Ozone ATBD S5P-L2-IUP-ATBD-400C
issue2.2, 2020-06-15 Page 10 of 40

An important source of ozone precursors is the anthropogenic emission by biomass burnings
[e.g. Crutzen and Andreae, 1990; Thompson et al., 1996; Ziemke et al., 2009b]. Large
amounts of ozone precursors, such as CO, NOx, CH4 and other hydrocarbons are released
over Africa and South America during the so-called biomass burnings seasons. The biomass
burning seasons are usually well defined, with large-scale fires over southern Africa and
South America in September and October and over northern Africa in December and
January. However, there is also considerable inter-annual variability in the magnitude and
location of the fires. For example, in 1997 and 2006, compared to other years larger parts of
the tropical rainforests were burned in Indonesia and Brazil due to the extreme El Niño-
Southern Oscillation (ENSO) conditions [Siegert et al., 2001; Chandra et al., 2009]. This
resulted in ozone plumes that extended as far as India [Thompson et al., 2001].

4.2 Tropospheric ozone retrieval heritage
Ground-based observations of tropical tropospheric ozone are carried out by several ozone
sonde sites, mainly in Southern Tropics [Thompson et al., 2003a] and provide valuable
information about the variability in tropical tropospheric ozone [Thompson et al., 2003b].
However, the spatial coverage of the tropical ozone sonde sites is still limited, especially on
the Northern Hemisphere. Satellite observations offer the possibility to measure the
distribution of tropospheric ozone over large areas and to study its large-scale temporal and
spatial variability. This is of great importance, since ozone that is formed over regions where
large amounts of ozone precursors are emitted, can be transported over great distances and
affects areas far from the source.
Tropospheric O3 shows large spatio-temporal variability and is hard to measure from space
due to the ozone layer in the stratosphere above, which shields the view into the
troposphere. To calculate tropospheric ozone from satellite measurements, a few methods
can be found in literature. Direct measurements of the tropospheric column ozone would be
the straightforward and most elegant way. Due to the shielding of the troposphere, retrievals
can have large errors in the determination of the column. Nadir ozone profiles for instance,,
have been used to determine tropospheric ozone from GOME [Munro et al., 1998, Liu et al.,
2005]. Similar techniques have been used for other instruments like OMI [Liu et al., 2010],
SAGE and SCIAMACHY [Fishman et al., 2008]. Indirect measurements methods are:
1. Residual method
 o Taking the difference of the total column from nadir measurements and the
 stratospheric column either from nadir or limb measurements. This is a reliable
 technique when the stratospheric column is rather invariable in space and time,
 which is adequate for the tropics and extratropics [Fishman & Larson, 1987;
 Fishman et al.,1990; Schoeberl et al., 2007].
 o Limb-Nadir matching [Sierk et al., 2006]: Collocated stratospheric columns (limb)
 are subtracted from total columns (nadir) using SCIAMACHY data [Ebojie et al.,
 2013].
2. Convective Cloud Differential (CCD) approach [Ziemke et al., 1998; Valks et al., 2003,
 2014]: Calculating the stratospheric column ozone from measurements above the highest
 clouds in the Pacific and assuming zonal invariance of tropical stratospheric ozone. Then
 the tropospheric column can be calculated in cloud free areas.
3. Cloud slicing method [Ziemke et al., 2001, 2005 2009]: Using an ensemble of upper
 cloud column ozone as an indicator for the intra–cloud ozone volume mixing ratio. Upper
 tropospheric ozone volume mixing ratios are then calculated for the layer between lowest
 and highest clouds.
4. Tropospheric excess method [Burrows et al., 1999; Ladstätter et al., 2004]: Subtracting
 the pacific cloud free ozone columns from total columns elsewhere.
S5P/TROPOMI Tropospheric Ozone ATBD S5P-L2-IUP-ATBD-400C
issue2.2, 2020-06-15 Page 11 of 40

Fishman and co-workers [Fishman et al., 1990] developed the concept of deriving a
tropospheric ozone column with a residual method, by using total ozone measurements from
TOMS and subtracting a stratospheric ozone column derived from SAGE measurements.
One of the main findings of this tropospheric ozone residual (TOR) technique was the
occurrence of enhanced ozone concentrations over the South Atlantic near the coast of
Africa during the biomass burning season. Later studies used total ozone measurements
from OMI and stratospheric ozone data from SBUV [Fishman et al., 1996], UARS, HALOE
[Ziemke et al., 1998] and MLS measurements [Ziemke et al., 2006]. A limitation of the
residual technique is that stratospheric ozone measurements from the independent sensor
may be uncertain in the lower stratosphere, giving large uncertainties in the tropospheric
column amounts [Fishman and Balok, 1999].
The algorithm for the retrieval of the tropical tropospheric ozone column from TROPOMI
measurements is based on the convective-cloud-differential (CCD) method.
The original CCD method developed by Ziemke et al. [1998] uses TOMS (for the period
1979–2005) and OMI (for 2004 onwards) total ozone measurements over bright, high-altitude
clouds in the tropical western Pacific to obtain an above-cloud stratospheric ozone amount.
In this region, bright clouds are often associated with strong convective outflows and cloud
tops in the upper troposphere. The tropical TOC is derived at cloud-free pixels by subtracting
the stratospheric ozone amount from TOMS and OMI total ozone, assuming a zonally
invariant stratospheric column.
An improved CCD method for the tropics has been developed by Valks et al. [2003, 2014,
2015] that is based on total ozone and cloud measurements from the GOME/ERS-2 and
GOME-2/MetOp instruments. In contrast to TOMS, GOME is able to determine cloud
fractions, cloud albedos and cloud pressures by using measurements in the near-infrared
wavelength (oxygen A-band) region combined with PMD measurements in UV-VIS-NIR. By
combining the cloud information with GOME and GOME-2 ozone column measurements,
monthly-mean values of the tropical tropospheric ozone columns have been determined.
The CSA retrieval algorithm is based on the method used for TOMS ozone and THIR cloud
data by Ziemke et al. [2001]. There are basically two assumptions made: 1) the invariance of
stratospheric ozone profiles (approximately valid in the tropics) and2) existence of
homogeneous ozone volume mixing ratiosin the upper troposphere (between the lowest and
highest clouds). The CSA algorithm has been adapted for GOME and SCIAMACHY using
the cloud and ozone information from the same instrument [Patel, 2009].

4.3 Tropospheric ozone data product requirements
The GMES Sentinels-4, -5, and -5 Precursor Mission Requirements Traceability Document
[RD03] and the Science Requirements Document for TROPOMI [RD04] provide the
requirements for TROPOMI, aboard the Sentinel-5 Precursor (S5P) mission. For the
tropospheric ozone column data products, the requirements mentioned in these documents
are listed in Table 1. The requirements are based on the findings of the CAPACITY [RD05],
CAMELOT [RD06] and TRAQ [RD07] studies. The uncertainties include retrieval errors as
well as instrument errors.
S5P/TROPOMI Tropospheric Ozone ATBD S5P-L2-IUP-ATBD-400C
issue2.2, 2020-06-15 Page 12 of 40

Table 4.1: Tropospheric ozone data product requirements for TROPOMI, as given in [RD03] and in
[RD04]. Where numbers are given as "a / b", the first is the targeted requirement and the second is the
threshold requirement. Note that the horizontal resolution and the revisit time have by now been fixed
with the choice of the instrument characteristics and the satellite orbit.

 Requirement From [RD03] From [RD04]
 Horizontal resolution 5/20 km 5/20 km
 Vertical resolution - -
 Revisit time 0.5 / 2 hours Multiple observations per day /
 daily
 Uncertainty 25% Altitude-dependent

The tropospheric ozone column from the CCD method and the upper tropospheric ozone
from the CSA method will be derived from a larger sampling of ozone and cloud observations
so that the final time and spatial resolution will depend on the optimum sampling found. For
GOME and SCIAMACHY, a monthly and 10° latitude x 10° longitude sampling was a
minimum requirement for a sufficient sampling statistics for the cloud slicing method, while
for the CCD method, a monthly and 1.25° latitude x 2.5° longitude sampling is used for
GOME-2. Due to the higher spatial sampling and better cloud statistics (clear-sky and full
cloudiness) for TROPOMI, sufficient sampling is achieved for smaller grids and/or shorter
periods (~3-5days). Currently, the CCD retrieval is performed using grid cells of 0.5°/1°
resolution with ozone data averaged over 3 days. The horizontal resolution is thus in the
order of ~50-100 km.

4.4 Tropospheric ozone data retrieval for TROPOMI/S5P
The TROPOMI/S5P CCD data processing of the tropospheric ozone column products is
based on the operational systems used for GOME/ERS-2 and GOME-2/MetOp-A and -B,
thus extending the long-term record of tropospheric ozone data, produced using a reliable,
well-established and well-described processing system. For the operational GOME-2 system,
as developed within the AC SAF, a number of improvements have been implemented [Valks
et al., 2014, 2015] and the TROPOMI data product can benefit from these activities. In
addition, we investigate possible improvements during the lifetime of TROPOMI (see Chapter
5).
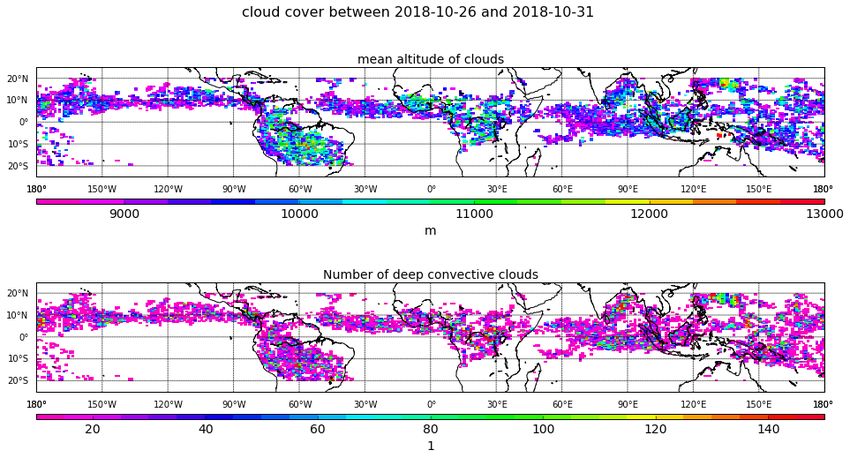
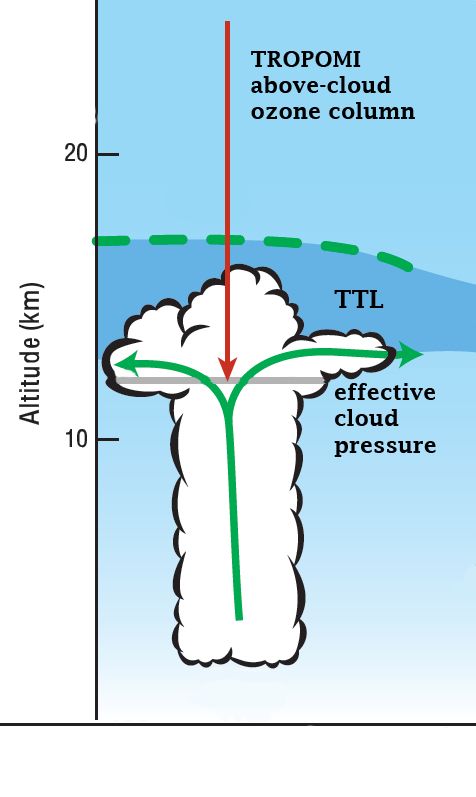
S5P/TROPOMI Tropospheric Ozone ATBD S5P-L2-IUP-ATBD-400C issue2.2, 2020-06-15 Page 13 of 40 5 Algorithm description 5.1 S5P_TROPOZ_CCD, Convective-Cloud-Differential method (CCD) The tropical tropospheric ozone column is retrieved with the convective-cloud-differential method (CCD) using both ozone column and cloud measurements from TROPOMI. Level-2 ozone column data are provided by the TROPOMI total ozone algorithms S5P_TO3_DOAS and S5P_TO3_GODFIT [RD09], and the cloud parameters are provided by the TROPOMI cloud algorithms S5P_CLOUD_OCRA and S5P_CLOUD_ROCINN [RD08]. The first algorithm (OCRA Heritage) provides cloud fraction data, and the second algorithm (ROCINN Heritage) provides cloud height (pressure), and optical thickness (albedo). By combining the cloud information with TROPOMI ozone column measurements, 3 day average values of the tropospheric ozone columns (pressure altitudes below 270 hPa) can be determined. Figure 5.1: Schematic illustration of above-cloud ozone column measurements from TROPOMI for the tropics as used in the CCD technique. For tropical deep convective clouds, the effective cloud pressures as determined with TROPOMI are usually between 8 and 12 km. TTL denotes the tropical transition layer below the tropopause (dashed green line). TROPOMI measurements with cloud fraction fc 0.8, cloud albedo act 0.8 and cloud pressure pct 300 hPa are used to determine the above-cloud ozone column Figure 5.1 shows a schematic illustration of the TROPOMI/CCD technique. In the first step, TROPOMI measurements with cloud fraction fc 0.8, cloud albedo act 0.8, and cloud optical centroid pressure pct 300 hPa are used to determine the above-cloud ozone column (above the ~27.000 Pa pressure altitude, including the ozone column in the stratosphere and the tropical transition layer). The cloudy TROPOMI measurements are selected from tropical measurements over the highly convective eastern Indian Ocean and the western Pacific (70E – 170W), where the greatest frequency of high level and high albedo clouds is found. The above-cloud ozone column is determined using TROPOMI Level-2 total ozone data [RD09]. Therefore, the
S5P/TROPOMI Tropospheric Ozone ATBD S5P-L2-IUP-ATBD-400C issue2.2, 2020-06-15 Page 14 of 40 fraction in and below the cloud has to be subtracted from the total columns, currently only the OFFL data are used. A correction term (ghost column) is applied by the GODFIT algorithm to account for the ozone column inside and below the cloud: , = , − ℎ , (5.1) where Nv,ac is the retrieved above-cloud vertical ozone column, Nv,tot is the reported total vertical column and Nghost the ghost column introduced to correct for the ozone column inside and below the cloud. The CCD algorithm uses the total vertical column and ghost column values reported in the S5P_OFFL_L2__O3____ data files. The cloud parameters determined with the OCRA/ROCINN algorithms using GOME/ERS-2 and GOME-2/MetOp measurements indicate that the tropical convective clouds over the eastern Indian Ocean and the western Pacific have cloud pressures between 200 and 400 hPa and high cloud optical depth. To be able to calculate an accurate tropospheric ozone column with the CCD method, the above-cloud ozone column is calculated for a fixed pressure level of 270 hPa. To that end, a small correction is made for the difference between the retrieved cloud-top level and the 270 hPa level (typically 0-2 DU). We use the ozone sonde based vertical ozone profile climatology by McPeters et al. (2007) for the local concentrations around the cloud altitude level. After this correction, the stratospheric ozone columns are averaged for 0.5° latitude bands between 20N and 20S over a five-day period. Hereby, it is assumed that the stratospheric ozone column is independent of longitude in a given latitude band. Because of the seasonal shift of the ITCZ, the region of tropical air shows a seasonal displacement as well. Periodically, sub-tropical air is present in the outer latitude bands (15- 20N or 15-20S), resulting in a small number of deep-convective cloud tops and an increased zonal variation in the derived stratospheric ozone column. In those cases, the northern (or southern) boundary for the TROPOMI/CCD analysis are flagged and have to be considered as having lower quality. The short time used of the TROPOMI tropospheric ozone column allows studying changes of tropospheric ozone on very short time scale. However, for the stratospheric ozone it might cause under sampling effects, besides the fact that several hundreds of data points are used per latitude bands. Sometimes the variation in the cloud altitude within the latitude bands is low or clouds only occurred on one day out of five. To reduce the observed under sampling effect we introduced a running mean smoothing on the stratospheric reference. In a second step, cloud-free TROPOMI measurements (fc 0.1) are used to determine the total ozone column. In the case of cloud-free pixels, TROPOMI is able to detect ozone in both the stratosphere and troposphere. About half of the total number of TROPOMI measurements in the tropics are cloud-free (fc 0.1). The total ozone columns are averaged over a three-day period on a 0.5° by 1 latitude-longitude grid between 20N and 20S. In a last step, the zonal mean stratospheric ozone column is subtracted from the gridded total ozone values, resulting in the three day averaged tropospheric ozone column. Figure 5.2 presents the flow diagram for the TROPOMI CCD algorithm. Tropospheric ozone columns are provided as averages over three days. The product filename contains the time period of the stratospheric reference, with timestamps defined by the start of the first orbit and the end of the last orbit. The period for the tropospheric observation is defined by the central time between start and end of the first and the last orbits plus and minus a period of 1.5 days. For periods shorter than 3 days, both troposphere and stratosphere are based on the same orbits.
S5P/TROPOMI Tropospheric Ozone ATBD S5P-L2-IUP-ATBD-400C
issue2.2, 2020-06-15 Page 15 of 40

 Start
 Total ozone columns
 and cloud data
 Read Level 2 data
 20°S to 20°N 5 days

 Calculate above cloud
 Ozone climatology
 ozone column for fc >0.8

 Generate and smooth stratospheric zonal
 means (e.g. 0.5°) for the reference region

 Subtract startospheric mean
 from total colmun

 Generate mean tropospheric columns for grid
 (e.g. 0.5 x1°) for fc
S5P/TROPOMI Tropospheric Ozone ATBD S5P-L2-IUP-ATBD-400C
issue2.2, 2020-06-15 Page 16 of 40

5.1.2 Data quality values
The data quality value is an indicator for the quality of the tropospheric ozone data, as for the
other TROPOMI level 2 data sets. It ranges between 0 (bad, do not use) and 1 or 100% (very
good data).At the start the data is assumed to be good and for certain criteria a respective
weight is subtracted.
The data quality values for tropospheric ozone depends on three major inputs: the mean
quality of the total ozone input data, a stratospheric contribution and a tropospheric
contribution for the grid cells.
The TROPOMI tropospheric ozone column data are averages of several individual
observations in one grid cell. Within three days, the number of observations per grid cell
reaches up to ~700. During the readout, all total ozone columns with a QA-value less than
0.5 are ignored (according to our test this is ~10% of the total ozone columns in the tropics).
The total ozone data have a large influence on the tropospospheric column. Therefore, we
weight the mean total column QA-value with 50% for the final tropospheric column QA-value.
The second largest influence on the data quality for the CCD tropospheric column is given by
the stratospheric background, which is subtracted. To underline the importance of the
stratospheric reference a stratospheric_reference_quality_flag was introduced. This flag is
set if certain thresholds for the number of stratospheric observations, the standard deviation
within a latitude band, or the difference between two neighbouring bands are reached. If the
stratospheric flag is set for either of the above criteria the data quality value of the
tropospheric ozone columns will be reduced by 30%.
Finally, also the sampling of tropospheric data in the grid cell indicates the quality of the final
product. The number of data per grid cell reaches up to 700, however for other places of the
world only very few cloud free TROPOMI observations are found per grid cell. Therefore, we
introduced a threshold for the minimum number per grid cell. If this is not met, the quality is
reduced by up to 5%. If the standard deviation within a grid cell is is higher than expected,
then the QA_value is reduced by another 10%. If the stratospheric ozone column is
subtracted from the total column negative values might occur. A certain percentage of
negative values can be tolerated without affecting the data quality, for larger fraction of
negative values the QA-value is reduced by up to 5%. If the final tropospheric column is
negative, the QA-value is set to 0 and the respective columns are replaced by fillvalues.

5.1.3 Algorithm input
The TROPOMI tropospheric ozone product is a level-2c product and the CCD algorithm uses
the S5P level-2 data listed in Table 5.1. Detailed description of the respective variables is
given in [RD10].
Table 5.1: Overview of the input data for the CCD algorithm.
Name/Data Symbol Unit Source Pre- Backup Comments
 process if not
 needs available
Latitude δgeo degree S5P Level 1
 No S5P ATBD [RD09]
 north 2 product retrieval
Longitude υgeo degree S5P Level 1
 No S5P ATBD [RD09]
 east 2 product retrieval
 1
Total ozone Nv,o3 molmo S5P Level No S5P ATBD [RD09]
and error l/m² 2 product retrieval
 1
Ozone - S5P Level No S5P ATBD [RD09]
retrieval
S5P/TROPOMI Tropospheric Ozone ATBD S5P-L2-IUP-ATBD-400C
issue2.2, 2020-06-15 Page 17 of 40

quality values 2 product retrieval
 1
Ozone Nghostghost mol/m S5P Level No S5P ATBD [RD09]
ghostghost m² 2 product retrieval
column
 1
Ozone column Al,o3 - S5P Level No S5P ATBD [RD09]
Averaging 2 product retrieval
Kernel
 1
Ozone a priori N mol/m² S5P Level No S5P ATBD [RD09]
profile 2 product retrieval
 1
Clear-sky air Mclear - S5P Level No S5P ATBD [RD09].
mass factor 2 product retrieval
 1
Cloudy air Mc - S5P Level No S5P ATBD [RD09].
mass factor 2 product retrieval
 1
Cloud pct hPa S5P Level No S5P ATBD [RD08]
centroid 2 product retrieval
pressure
 1
Cloud albedo ac - S5P Level No S5P ATBD [RD08]
 2 product retrieval
 1
Cloud fraction fc % S5P Level No S5P ATBD [RD08]
 2 product retrieval
1
All S5P measurements within the tropical latitude range (20°S - 20°N) are used.

The S5P total ozone algorithm is explained in the S5P ATBD [RD09]. S5P cloud properties
will be taken from the operational OCRA/ROCINN algorithms, which are described in the
ATBD [RD08].

5.1.4 Algorithm output
The output data of the CCD algorithm is listed in table 5.2. Additional output parameters such
as geolocation, quality control, input data, et cetera are also included in the L2 product and
specified in the corresponding PUM [RD11].
Table 5.2: Overview of the output data for the CCD algorithm.
Name/Data Symb Unit Description Data Number Comments
 ol type of
 per values
 pixel
Start time - Start time of Integer Depends on the
 averaging period chosen averaging
 time interval
 (baseline: 5 days)
End time - End time of Integer Depends on the
 averaging period chosen averaging
 time interval
 (baseline: 5 days)
Start time Start time of Integer Depends on the
troposphere averaging period chosen averaging
 for tropospheric time interval
S5P/TROPOMI Tropospheric Ozone ATBD S5P-L2-IUP-ATBD-400C
issue2.2, 2020-06-15 Page 18 of 40

 column (baseline: 3 days)
End time End time of Integer Depends on the
troposphere averaging period chosen averaging
 for tropospheric time interval
 column (baseline: 3 days)
Latitude δgrid degree Centre latitudes of Float 80 Latitude range:
 north grid cells 20ºS-20ºN
Longitude υgrid degree Centre longitudes Float 360 Longitude range:
 east of grid cells -180° - 180°E
 2
Tropospheric Nv,trop mol/m Averaged Float 80 x 360 The output data are
ozone column tropospheric ozone gridded on a 0.5º x
 column 1º grid
 2
Tropospheric σNv,trop mol/m Std. dev. of Float 80 x 360 The output data are
ozone column tropospheric ozone gridded on a 0.5º x
error column 1º grid
Tropospheric ζo3 ppb Averaged Float 80 x 360 The output data are
ozone mixing tropospheric mixing gridded on a 0.5º x
ratio ratio in the column 1º grid
Tropospheric σζo3 ppb Std. dev. of of Float 80 x 360 The output data are
ozone mixing tropospheric ozone gridded on a 0.5º x
ratio error mixing ratio 1º grid
QA Value - quality assurance integer 80 x 360
 value 0-100
Tropospheric n - Number of Integer 80 x 360 The output data are
ozone column, individual gridded on a 0.5º x
Number of measurements 1º grid
measurements inside the grid used
 for the averaging
 2
Stratospheric Nv,sto3 mol/m Average Float 80 x 360 The output data are
Ozone stratospheric ozone gridded on a 0.5º x
 column (for cloudy 1º grid
 conditions)
 2
Strat. ozone σNv,sto3 mol/m Std. dev of Float 80 x 360 The output data are
error stratospheric ozone gridded on a 0.5º x
 column (for cloudy 1º grid
 conditions)
 2
Strat. ozone Nv,sto3_re mol/m Average Float 80 The output data are
reference f stratospheric ozone gridded per 0.5º
 column in the latitude bin
 reference area (for
 each latitude band)
 2
Error in strat. σNv,sto3_r mol/m Std. dev. of Float 80 The output data are
ozone reference ef stratospheric ozone gridded per 0.5º
 column in the latitude binbin
 reference area (for
 each latitude band)
 2
Total ozone Nv,o3 mol/m Average total Float 80 x 360 The output data are
 ozone column (for gridded on a 0.5º x
 clear sky 1º grid
 conditions)
S5P/TROPOMI Tropospheric Ozone ATBD S5P-L2-IUP-ATBD-400C
issue2.2, 2020-06-15 Page 19 of 40
 2
Total ozone σNv,o3 mol/m Std. dev. of total Float 80 x 360 The output data are
error ozone column (for gridded on a 0.5º x
 clear sky 1º grid
 conditions)

5.2 S5P_TROPOZ_CSA, Cloud Slicing Algorithm (CSA)
We describe the algorithm which provides ozone volume mixing ratios in the tropical
troposphere above clouds. For satellite measurements with a coarse horizontal resolution,
the CSA ozone mixing ratios were calculated using averaged data from large grid boxes (5°-
30°) and weeks to month of measurements. With S5P, the use daily measurements is
feasible which will largely reduce uncertainties caused by short-term changes in the
stratospheric ozone columns.
The main retrieval input parameters for the product are the above-cloud ozone column
(section 5.1), cloud fractions, and cloud heights. As the algorithm uses the level 2 TROPOMI
products and calculation is straightforward, computing time and storage place is not an issue
for the retrieval.
The S5P_TROPOZ_CSA algorithm was improved after first validation to deal with the vast
amount of measurements. It is currently not activated.

5.2.1 Product description and heritage
The calculation of mean upper tropospheric volume mixing ratios for layers that are defined
between a defined lower cloud optical centroid height and a maximum cloud top height is
rather simple. The retrieval algorithm is based on the cloud slicing method used for
TOMS/THIR data by Ziemke et al. [2001]. It uses the correlation between cloud pressure pct
[Pa] and the ozone column above those clouds (Nv,ac). The number of measurements within a
grid cell of a few degree are defined by satellite pixels that are fully cloudy with a cloud height
above the treshold, and the spread of the cloud heights cover the upper troposphere.
Up to now, a few days of measurements were needed to get enough cloud covered pixels
that exhibit different cloud pressures in the specific area. The algorithm is not applicable
globally. It is restricted to certain areas in the tropics (roughly +/-20° latitude) that have a
sufficiently large spread of cloud top heights.

5.2.2 Product requirements
The input data are the TROPOMI OFFL Level 2 total ozone [mol/m2] and the ghost column
Nghost [mol/m2] to infer the above-cloud column of ozone (ACCO) Nv,ac [mol/m2]. A different way
to calculate ACCO would be the use of ozone slant column Ns,o3 [mol/m²] and air mass factor
[-] of a cloudy scene ac, as proposed by Valks et al. [2014].
To calculate the mean upper tropospheric ozone mixing ratio < ζo3>, the TROPOMI cloud
pressure pct [Pa] and the cloud fraction fc [-] are needed for the same geolocation. Calculated
errors of these products are furthermore necessary to perform an error analysis
Two different cloud models are available for TROPOMI/S5P. One model treats clouds as
Lambertian reflecting surfaces (ROCINN version 2.0 CRB), which is the current baseline for
the GOME-2 retrievals [Loyola et al., 2007]. The other model treats clouds as scattering
layers (ROCINN version 3.0 CAL) [Schuessler et al., 2013]. The algorithms that are available
depend on the operational data stream. The cloud slicing algorithm is applied to OFFL
TROPOMI total ozone columns. The above-cloud column is the same as used for the CCD
algorithm, Eq. 5.1.

5.2.3 Overview of the retrieval method
Ziemke [2001] used collocated pairs of above-cloud column ozone (Nimbus 7 TOMS version
7) and cloud top height pressures (Nimbus 7 THIR) in the original cloud slicing algorithm to
S5P/TROPOMI Tropospheric Ozone ATBD S5P-L2-IUP-ATBD-400C issue2.2, 2020-06-15 Page 20 of 40 determine tropospheric ozone information at heights between the lowest and highest cloud tops. All data within one grid cell are sampled that fulfils the boundary conditions. The volume mixing ratio can be determined from the slope of the above-cloud column ozone against the cloud top pressure. An important assumption is that the stratospheric ozone column does not change over time within one grid cell. This is approximately fulfilled in tropical regions, especially for small grid cells and daily retrievals. Furthermore, clouds should be opaque and the VMR in the upper troposphere (between the lowest and highest clouds) is assumed to be constant. We currently use all measurements with cloud top altitudes above 5 km and a cloud cover of more than 95%. Data from one day are binned to a resolution of e.g. 3° x 3°. The main advantage of this method is the possibility to get height resolved tropospheric ozone above clouds. Large ensemble statistics and the geographical limitation to cloudy and convective regions are disadvantages. But the more satellite pixels are available per day, the better are the statistics. The calculations are performed as follows. The partial column density of ozone Np,o3 [DU] between two pressure levels pL and pH [Pa] can be calculated by integrating the ozone volume mixing ratio ζo3 [ppbv] in this pressure layer: pH N p ,o 3 k o3 ( p ) dp (5.2) pL The constant k = ~0.79 [DU hPa-1 ppmv-1] can be determined using the horizontal surface density and the ideal gas law. The full derivation of this equation can be found in Ziemke et al. [2001]. As we get the ozone column from measurements, the mean volume mixing ratio for a pressure interval can then be calculated from eq. (5.2) as N p ,o 3 o3 1 . 27 (5.3) p
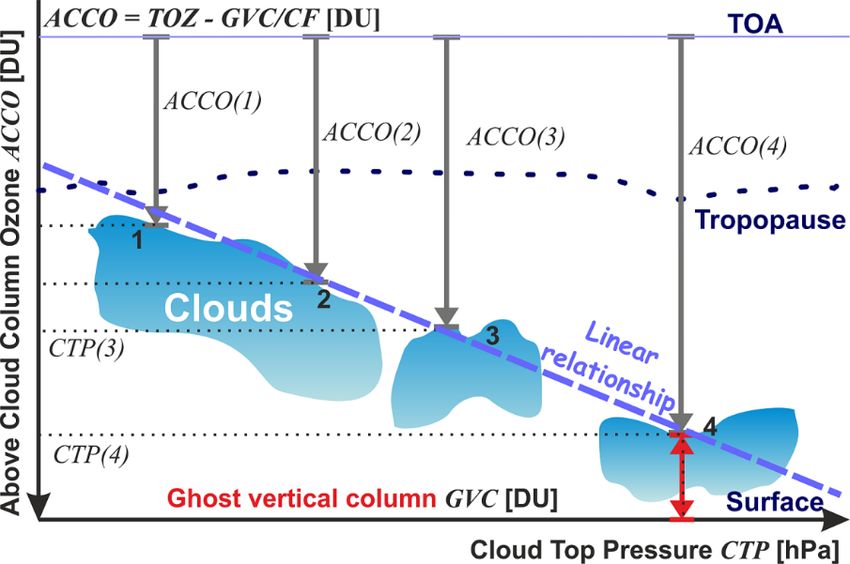
S5P/TROPOMI Tropospheric Ozone ATBD S5P-L2-IUP-ATBD-400C
issue2.2, 2020-06-15 Page 21 of 40

We use the above-cloud column of ozone (ACCO) Nv,ac [DU] to calculate the partial column
ΔNp,o3 and the cloud top pressure pct for Δp. The ACCO is calculated as explained in equation
(5.1). Outliers due to instrumental problems (saturation above high and bright clouds) can
affect the fitted slope and hence the retrieved mixing ratio. Therefore, outliers are removed
that appear in the total ozone field. Outliers in the ACCO dataset can also be omitted by
using the fitted slope. Data that deviate by more than the standard deviation multiplied by a
certain factor are ignored and the fit is repeated. The weighting factor for the standard
deviation is reduced for the next iteration. The iteration ends the data are no longer reduced
or a maximum number of iterations is reached.
The iterative approach is not used anymore in the updated algorithm. Instead, a robust linear
fitting routine (Theil-Sen) has been introduced that is not susceptible to outliers.
Nevertheless, the outliers in the TOZ fields are rejected before the retrieval.

Figure 5.3: Scheme of the cloud slicing technique. Clouds with different cloud top pressures CTP [km]
are correlated with the corresponding above-cloud columns of ozone ACCO [DU]. This value has to be
calculated using total ozone, cloud fraction, cloud top height/pressure and other parameters (e.g.,
ghost column).

Figure 5.3 shows a schematic diagram of the method. Measurements of the total ozone
above clouds at different heights are sampled within a defined area.
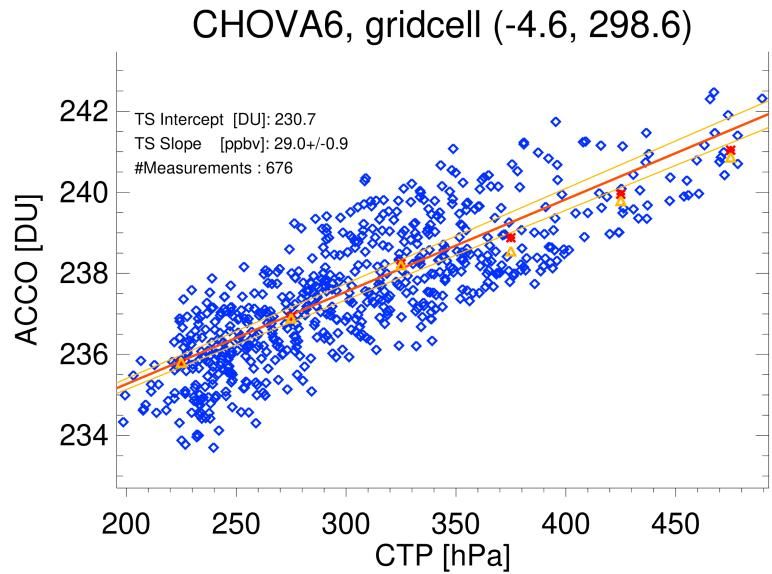
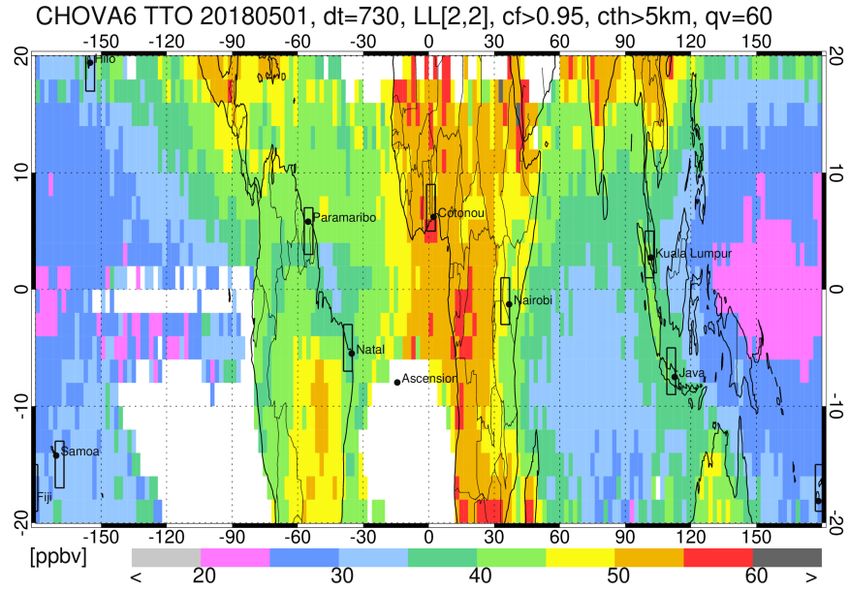
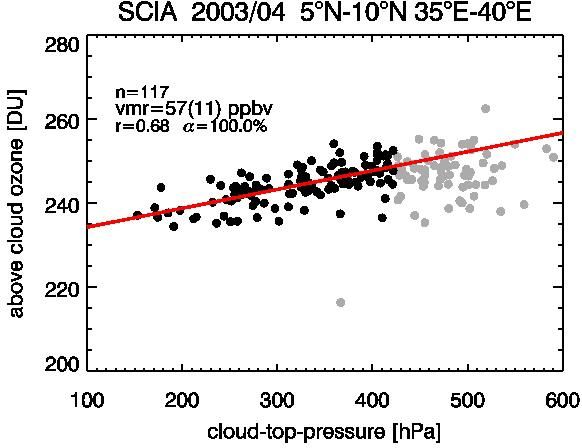
S5P/TROPOMI Tropospheric Ozone ATBD S5P-L2-IUP-ATBD-400C
issue2.2, 2020-06-15 Page 22 of 40

Figure 5.4: TROPOMI tropical tropospheric ozone volume mixing ratios [ppbv] calculated from the
slope of the Theil-Sen regression between above-cloud ozone and cloud-top-pressure. The regression
here is limited to ACCOs for cloud top pressures less than 500 hPa. The grid box size is 3° and the
time span for collection is one day.
The measurement pairs of ACCO and cloud top pressure are then fitted to get the volume
mixing ratio within a pressure range defined by the cloud heights. This is shown in Figure 5.5
for a test case of TROPOMI. The measurements are taken from an area at 4°S and 298°E
on the 2020-05.02. The regression (red line) is performed using the Theil-Sen method [Sen
et al., 1968]. The confidence interval is superimposed (orange line).
The CSA method was first applied to GOME/SCIAMACHY-like instruments. Here, the total
ozone is retrieved using the weighting function DOAS [Coldewey-Egbers et al., 2005, Weber
et al., 2005]. Information about the cloud characteristics (cloud fraction and cloud top height)
are retrieved using the oxygen A-band [Koelemeijer et al., 2001; Kokhanovsky et al., 2005].
Figure 5.5 shows an example of the correlation between ACCO and cloud top pressure pct for
SCIAMACHY measurements from April 2003 and for a grid box size [5°-10°N / 35°-40°E].
Monthly]. Cloud pressures less than 425 hPa and cloud fractions above 0.8 are limits for
these retrievals.The red line gives the linear fit of the points.

Figure 5.5: Upper tropospheric ozone volume mixing ratios [ppbv] calculated from the slope of the
linear regression between above-cloud ozone and cloud-top-pressure. The linear regression here is
limited to ACCOs for cloud top pressures less than 425 hPa (black solid symbols). The grid box size is
5° and the time span for collection is one month.
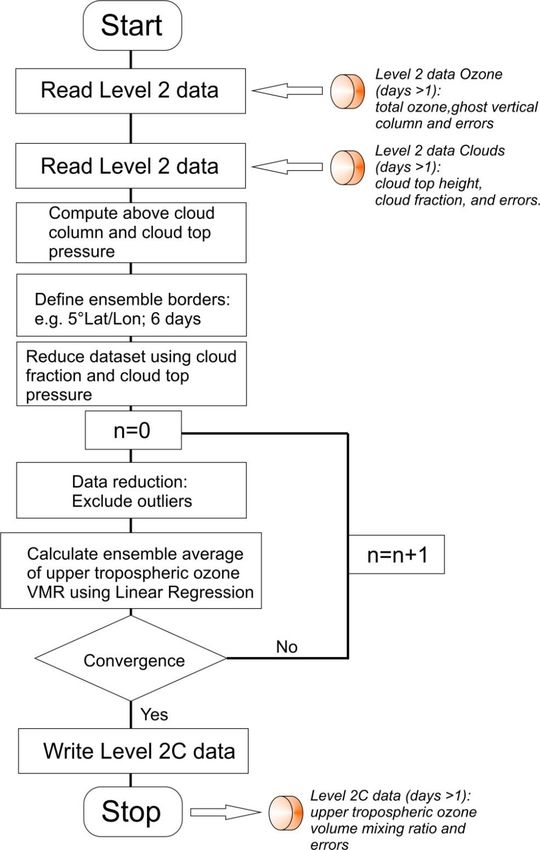
S5P/TROPOMI Tropospheric Ozone ATBD S5P-L2-IUP-ATBD-400C
issue2.2, 2020-06-15 Page 23 of 40

Figure 5.6: TROPOMI tropical tropospheric mean ozone for phase E from May 2018 until April 2020.
The values are retrieved daily on a 2° lat/lon grid with 3° box size. GODFIT OFFL ozone columns are
chosen for OCRA/ROCINN CRB cloud fractions >0.95 and cloud heights >5.0km. The data is flagged
for quality better than 0.6. The ozone sonde sites from SHADOZ are superimposed.
Figure 5.6 shows a 2-year VMR average from TROPOMI data. As expected, we find low
tropospheric ozone in the Indonesian area (below 25 ppbv) and high values west of Africa
(~55 ppbv). Regions marked as white rectangles are not suitable for the method because
cloud top heights are predominant in these areas that never exceed 5 km. Due to the much
larger data volume of TROPOMI, seasonal or monthly averages are feasible. The best
composition of grid box size and time span is analysed in phase E2 with data from 2018 to
2020. The improvement of both the cloud and total ozone algorithms with respect to tropical
regions and scenes with high, opaque clouds is essential to improve the quality of the CSA.
Figure 5.7 presents a flow diagram for the TROPOMI CSA algorithm. The convergence of the
method is reached when all outliers in the ACCO values are excluded.
S5P/TROPOMI Tropospheric Ozone ATBD S5P-L2-IUP-ATBD-400C
issue2.2, 2020-06-15 Page 24 of 40

Figure 5.7: Flow diagram for the S5P_TROPOZ_CSA retrieval algorithm.

5.2.4 Algorithm input
The parameters needed as input to the CSA are listed in Table 5.3 and 5.4. Detailed
description of the respective variables is given in [RD10].

Table 5.3: Overview of the dynamic input information.
Name/Data Symbol Unit Source Pre- Backup Comments
 process if not
 needs available
S5P/TROPOMI Tropospheric Ozone ATBD S5P-L2-IUP-ATBD-400C
issue2.2, 2020-06-15 Page 25 of 40
 1
Latitude δgeo Deg S Per grid box
 1
Longitude υgeo Deg Per grid box
 1
Total ozone or Nv,o3 mol/m² S5P Level Per grid box No S5P ATBD [RD09]
vertical 2 product retrieval
column
density and
corresponding
error
 1
Ozone - S5P Level Per grid box No S5P ATBD [RD09]
retrieval 2 product retrieval
quality values
 1
Ghost column Nghostt mol/m² S5P Level Per grid box No S5P ATBD [RD09],
and error 2 product retrieval need depends on
 chosen method for
 CSA
 1
Ozone slant Ns,o3 mol/m² S5P Level Per grid box No S5P ATBD [RD09]
column 2 product retrieval
densitiy
 1
Cloud air Mc - S5P Level Per grid box No S5P ATBD [RD09].
mass factor 2 product retrieval
 1
Cloud top pct Pa S5P Level Per grid box No S5P ATBD [RD08]
pressure 2 product retrieval
 1
Cloud fraction fc % S5P Level Per grid box No S5P ATBD [RD08]
and error 2 product retrieval
1
 All measurements within a grid box (e.g. 5° latitude and 5° longitude) for a specified time (e.g. 5 days)
are used. The grid box needs to be optimized.

5.2.5 Algorithm output
Table 5.5 lists the output fields that are required in the tropospheric ozone level-2C files
based on the S5P_TROPOZ_CSA algorithms. Additional output parameters such as
geolocation, quality control, input data etc are also included in the L2 product and specified in
the corresponding PUM [RD11]
Table 5.5: Overview of the output data
Name/Data Symb Unit Description Data Number Comments
 ol type of
 per values
 pixel
Grid box Deg Center coordinate, Float e.g Depending on the
(Lat/Lon) needs to be defined 14/120 chosen grid for the
 (e.g. 5°x5°) tropics
Time step Δt Days Number of days used Integer 1 Depending on the
 for data collecting chosen time
 interval
Upper ζo3 ppbv Fit result, S5P Level Float e.g per grid box and
 1
tropospheric 2C product 14/120 time step
ozone mixing
ratio
Standard σζo3 ppbv Fit result e.g per grid box and
deviation of ζo3 14/120 time step
S5P/TROPOMI Tropospheric Ozone ATBD S5P-L2-IUP-ATBD-400C
issue2.2, 2020-06-15 Page 26 of 40

Above-cloud Nv,ac mol/m² Float e.g per measurement
ozone column 14/120
Number of nf - Integer e.g per grid box and
used data for 14/120 time step
the fit
Correlation R - Parameter for the Float e.g per grid box and
coefficient quality of the fit 14/120 time step
Confidence A % Parameter for the Float e.g per grid box and
level quality of the fit 14/120 time step
Cloud mean ˂pc˃ Pa Ensemble mean of all Float e.g per grid box and
pressure cloud pressures used 14/120 time step
 for fitting
Standard σp Pa Float e.g per grid box and
deviation of pc 14/120 time step

1
 When the retrieval grid box for TROPOMI is 5°x 5° for a 5 days fitting, then 8*72 output data
values are expected.
S5P/TROPOMI Tropospheric Ozone ATBD S5P-L2-IUP-ATBD-400C issue2.2, 2020-06-15 Page 27 of 40 6 Input-Output file description 6.1 S5P tropospheric ozone product description and size The Level-2c tropospheric ozone product will be provided in the netCDF-CF data format once per day. The following information will be included in each product file: • Measurement time period for stratospheric and tropospheric columns • Definition of the latitude-longitude grid cells • Tropospheric ozone column and corresponding errors (CCD algorithm) • Upper tropospheric ozone and corresponding errors (CSA algorithm) • Stratospheric ozone column and corresponding errors • Number of measurements statistics • Statistics on cloud- and ozone parameters • Other relevant parameters used in the retrieval (surface properties etc.) • Retrieval Quality flags The product size is ~1 MB (one product per day). The algorithm was implemented into the operational system and needs to be fine tuned in phase E2. As it is a Level 2C algorithm, it is dependent on the output of the level 2 algorithms. 6.2 TROPOMI and auxiliary information needed by the processing system The TROPOMI tropospheric ozone columns product based on the CCD and CSA methods requires Level-2 TROPOMI total ozone data (from S5P_TO3_GODFIT) and cloud data (from S5P_CLOUD_OCRA and S5P_CLOUD_ROCINN). The following parameters from the TROPOMI Level-2 files are needed for the processing: TROPOMI Level-2 total ozone product (S5P_TO3_GODFIT) o Geolocation and viewing geometry o Ozone vertical column o Ghost vertical column o Climatology parameters (ozone and temperature profile) TROPOMI cloud product (S5P_CLOUD_OCRA and S5P_CLOUD_ROCINN) o Geolocation and viewing geometry o Fractional cloud cover o Cloud height/pressure o Cloud albedo A description of the total ozone algorithm is given in a separate S5P ATBD [RD09]. Cloud properties will be taken from the operational OCRA/ROCINN, which are described in the ATBD [RD08]. The tropopause height ztp might be used as a diagnostic tool to check how large the difference between the uppermost cloud top height and the tropopause is. The most commonly used definition for the tropopause height are the 2 K/km lapse rate within the
S5P/TROPOMI Tropospheric Ozone ATBD S5P-L2-IUP-ATBD-400C issue2.2, 2020-06-15 Page 28 of 40 tropics and the use of the Potential Vorticity (PV) unit outside of the tropics. The PV definition can be used pole ward of 40°, equator ward of 20° the temperature-lapse rate definition was used, and between these latitudes both definitions were linearly combined to ensure a smooth transition between both [de Laat, 2009]. The static auxiliary data needed for the Level-2c TROPOMI tropospheric ozone column processor are listed below. These data-sets are also required for the Level-2 total ozone processor (S5P_TO3_DOAS and S5P_TO3_GODFIT) [RD09]. Terrain height o Spatial resolution: 0.1°As a baseline: GMTED: spatial resolution of 30 arc-seconds Ozone profile information Stratospheric profile climatology o Profile database classified by total column of ozone o Latitude (10° bins) and monthly dependent o As a baseline: The climatology [McPeters and Labow, 2012] Tropospheric ozone climatology o Database classified by latitude, longitude and monthly o Spatial resolution: 0.1 o As a baseline: OMI/MLS tropospheric O3 column climatology [Ziemke et al., 2011], 1°x1°, monthly averages. The tropospheric profile shape from the climatology is scaled so that the integrated tropospheric profile will match the tropospheric column from this OMI/MLS climatology. Surface albedo o Wavelength: 335 nm o Spatial resolution: 0.1° o Monthly climatology o Time of observation: early afternoon o As a baseline: Using fitted effective albedo from L2 data..
You can also read