Tunable Liquid Gradient Refractive Index (L-GRIN) lens with two degrees of freedom
←
→
Page content transcription
If your browser does not render page correctly, please read the page content below
View Online
PAPER www.rsc.org/loc | Lab on a Chip
Tunable Liquid Gradient Refractive Index (L-GRIN) lens with two degrees of
freedom†
Xiaole Mao,ab Sz-Chin Steven Lin,a Michael Ian Lapsley,a Jinjie Shi,a Bala Krishna Juluria
and Tony Jun Huang*ab
Received 19th December 2008, Accepted 25th March 2009
First published as an Advance Article on the web 15th April 2009
DOI: 10.1039/b822982a
We report a tunable optofluidic microlens configuration named the Liquid Gradient Refractive Index
(L-GRIN) lens for focusing light within a microfluidic device. The focusing of light was achieved
through the gradient refractive index (GRIN) within the liquid medium, rather than via curved
Published on 15 April 2009 on http://pubs.rsc.org | doi:10.1039/B822982A
refractive lens surfaces. The diffusion of solute (CaCl2) between side-by-side co-injected microfluidic
laminar flows was utilized to establish a hyperbolic secant (HS) refractive index profile to focus light.
Downloaded by Pennsylvania State University on 11 April 2011
Tailoring the refractive index profile by adjusting the flow conditions enables not only tuning of the
focal distance (translation mode), but also shifting of the output light direction (swing mode), a second
degree of freedom that to our knowledge has yet to be accomplished for in-plane tunable microlenses.
Advantages of the L-GRIN lens also include a low fluid consumption rate, competitive focusing
performance, and high compatibility with existing microfluidic devices. This work provides a new
strategy for developing integrative tunable microlenses for a variety of lab-on-a-chip applications.
Introduction and waveguides,15,16 thus avoiding the complications in optical
alignment and device integration often occurring in out-of-plane
Tunable microlenses have proven to be crucial components for microlenses. On the other hand, due to the limitation of planar
incorporating advanced functionalities into microfluidic or lab- device structures, it is difficult to readily adapt the lens tuning
on-a-chip systems.1 A tunable microlens adaptively reshapes the mechanism of out-of-plane microlens to in-plane ones. As a result,
input light, adjusting its focal position, intensity, beam profile, the majority of in-plane microlenses demonstrated thus far were
and even propagation direction. Such fine tuning of the light is built with the non-tunable solid (e.g., PDMS) curved refractive
critical for realizing a broad spectrum of lab-on-a-chip applica- surfaces with fixed focal length.2,3,17,18
tions such as flow cytometry,2,3 single molecule detection,4 and The challenges of implementing adjustable refractive micro-
on-chip optical tweezers.5–7 lens surfaces within the microfluidic device plane were recently
Nearly all tunable microlenses developed so far are classic addressed with a group of tunable in-plane optofluidic micro-
refractive lenses and their working mechanism is straightfor- lenses. Optofluidic technology19,20 exploits the unique properties
ward: light beams bend when impinging upon the curved of microfluidic flows to manipulate the light in microscale. The
refractive lens surfaces and are subsequently brought to focus; refraction of light at curved, optically-smooth, liquid–liquid
the change of curvatures of refractive surfaces results in the interfaces between co-injected microfluidic laminar flows with
change of focal distances. Many out-of-plane tunable micro- different refractive indices were utilized to realize the tunable
lenses, which focus light in the direction perpendicular to the microlenses within the microfluidic device plane. Previously, we
microfluidic device plane, have been successfully developed from reported a tunable optofluidic cylindrical microlens21 by
this concept. These tunable microlenses provide adaptive ‘‘bending’’ a CaCl2/H2O liquid–liquid interface using the Dean
focusing with adjustable curved refractive surfaces, such as micro Flow effect.22–24 More recently, the Whitesides group introduced
meniscus surface actuated by electrowetting8 and stimuli-respon- a dynamically reconfigurable liquid–liquid lens25 which exploited
sive hydrogels,9 and hydraulically actuated polydimethylsiloxane the convex shape of liquid–liquid interfaces in a microfluidic
(PDMS) membranes.10,11 From device integration perspective, expansion chamber. In both cases, curvatures of the liquid–liquid
however, in-plane tunable microlenses which focus light parallel interfaces were hydrodynamically modulated by simply adjusting
to the device plane are more preferable as they can be simulta- the flow conditions, and excellent flexibilities for lens tuning have
neously fabricated and seamlessly integrated with other on-chip been achieved. The drawback of such methods, however, lies in
fluidic and optical components such as on-chip lasers12–14 the fact that in order to avoid the smearing of the lens surfaces
a
(liquid–liquid interfaces) caused by diffusive mixing, a relatively
Department of Engineering Science and Mechanics, The Pennsylvania
State University, University Park, PA, 16802, USA. E-mail: junhuang@ high flow velocity is needed to minimize the residence time of the
psu.edu; Fax: +1 814-865-9974; Tel: +1 814-863-4209 fluids in focusing region. Therefore, the fluid consumption rates
b
Department of Bioengineering, The Pennsylvania State University, of such lenses are relatively high (hundreds of ml m1). Such high
University Park, PA, 16802, USA flow rates have created difficulties in sustaining the lens over
† Electronic supplementary information (ESI) available: Fabrication
a prolonged period. They also impose unrealistic requirement for
details and additional experimental results; Video S1 for Fig. 3 and
Video S2 for Fig. 6. See DOI: 10.1039/b822982a developing integrative on-chip pumps26 for lens control.
2050 | Lab Chip, 2009, 9, 2050–2058 This journal is ª The Royal Society of Chemistry 2009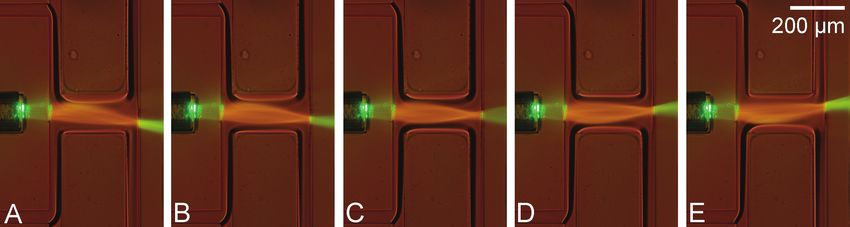
View Online

                                                                              The above-mentioned difficulties in creating and sustaining an               refractive index gradient, and hence the focusing pattern, by
                                                                           in-plane tunable classic refractive microlens challenge us to                   manipulating the progress of diffusion. In the proposed L-GRIN
                                                                           search for alternative solutions. In this work, we report an in-                lenses, diffusion favors, rather than hinders, the working mech-
                                                                           plane tunable microlens configuration that does not require                     anism of the tunable microlens. Therefore, the L-GRIN lens can
                                                                           a curved lens surface. The method was named the Liquid                          operate at much-reduced flow rates, and the fluid consumption
                                                                           Gradient Refractive Index (L-GRIN) lens, as its focusing                        can be dramatically lowered from the existing in-plane tunable
                                                                           mechanism resembles that of the solid-based Gradient Refractive                 liquid–liquid microlenses.21,25 More importantly, with precise
                                                                           Index (GRIN) lens which is widely used in the optical fiber                     microfluidic manipulation, one can change not only the focal
                                                                           industry for coupling and collimation.27 A GRIN lens often has                  distance of the L-GRIN lens (Fig. 1A2 to 1A3) by adjusting the
                                                                           a transversely (perpendicular to the optical axis) variable                     refractive index contrast (difference between the maximum and
                                                                           refractive index and a flat lens structure, in contrast to the curved           minimum in the gradient), but also the direction of output light
                                                                           lens surface of a classic refractive lens. Rather than abruptly                 (Fig. 1A3 to 1A4) by shifting the optical axis. Such a tunable
                                                                           changing its direction at the surfaces of classic refractive lenses             microlens with two degrees of freedom enables an unprecedented
                                                                           (Fig. 1A1), light travelling along the optical axis within such                 flexibility for on-chip manipulation of light.
Published on 15 April 2009 on http://pubs.rsc.org | doi:10.1039/B822982A

                                                                           a GRIN lens is gradually bent toward the optical axis and
                                                                           brought to a focusing point (Fig. 1A2). The key to realizing
  Downloaded by Pennsylvania State University on 11 April 2011

                                                                           a GRIN lens is to establish light-focusing refractive index
                                                                                                                                                           Materials and methods
                                                                           gradient profiles within the lens material. Establishment of such
                                                                           refractive index gradient profiles in solid materials (e.g., glass) is          A variety of refractive index gradient profiles, such as para-
                                                                           difficult and often involves complex fabrication processes such as              bolic27,31 and hyperbolic secant (HS) profiles,28,32,33 have been
                                                                           microcontrolled dipcoating, field-assisted ion-exchange, or vapor               studied for their light-focusing properties. In the proposed L-
                                                                           deposition,28 and the focusing cannot be tuned due to the fixed                 GRIN lens, the establishment of light-focusing refractive index
                                                                           refractive index gradient.                                                      gradient solely relies on the diffusion of the solute within the
                                                                              We have recognized that in microfluidic systems, refractive                  fluidic flows. Therefore in this study we chose the HS profile
                                                                           index gradients can be readily obtained through controlled                      because its mathematical resemblance to the error function
                                                                           diffusion of solutes29 or heat.30 From this observation we propose              (analytical solution to linear diffusion problem)34 suggests that
                                                                           a liquid-based GRIN lens that can conveniently adjust its                       one may establish such a gradient through the diffusion in

                                                                           Fig. 1 Principle and design of the L-GRIN lens. (A) A schematic diagram showing the comparison between the classic refractive lens (A1) and GRIN
                                                                           lens (A2). Change of the refractive index contrast in GRIN lens can result in change of focal distance (A2–A3), and shift of optical axis can result in
                                                                           change of output light direction (A4). (B) Schematic of the L-GRIN lens design (B1), microscopic image of the L-GRIN lens in operation (B2, left), and
                                                                           the expected refractive index distribution at two locations (I and II) inside the lens (B2, right). High optical contrast areas (dark streaks) were observed
                                                                           near the fluidic boundaries (B2, left), suggesting significant variation of refractive index due to the CaCl2 diffusion. (C) Schematic drawing showing two
                                                                           operation modes of the L-GRIN lens: the translation mode with variable focal length including no-focusing (C1), a large focal distance (C2), and a small
                                                                           focal distance (C3); and the swing mode with variable output light direction (C3–C5).

                                                                           This journal is ª The Royal Society of Chemistry 2009                                                             Lab Chip, 2009, 9, 2050–2058 | 2051
View Online
a side-by-side laminar flow configuration. The refractive index focal length (Fig. 1C2), and a short focal length (Fig. 1C3). In the
distribution of the HS profile is given by28 swing mode, the direction of the output light can be adjusted in
device plane by shifting the optical axis of the L-GRIN lens with
n2(x) ¼ ns2 + (n02 ns2)sech2(ax) (1) asymmetrical adjustment of H2O flow rates from each side
(Fig. 1C3 to 1C5). One can operate two modes independently or
where n(x) is the refractive index of the GRIN material at any in combination.
given transverse position x, n0 is the highest refractive index at To simulate and thus optimize the refractive index distribution
the center axis of the material, ns is the background (lowest) and light propagation in the L-GRIN lens at different flow
refractive index of the material, and a is the gradient parameter. conditions, we adapted a combined approach of computational
With the HS refractive index profile, the input light beams can be fluid dynamics (CFD) and optical ray-tracing simulation. The
bent smoothly toward the optical axis of the GRIN material and CFD simulation was conducted using a finite-volume based
brought to a focusing point. The trajectory of light within the commercial package, CFD-ACE + (ESI-CFD, U.S.A). A user-
material is determined by the refractive index distribution and routine code was developed to couple the viscosity and density of
can be analytically solved. the solution with variable CaCl2 concentrations in the CFD
Published on 15 April 2009 on http://pubs.rsc.org | doi:10.1039/B822982A
The schematic of the L-GRIN lens design is shown in Fig. 1B1. simulation.21 Grid density-independence tests were performed to
The device included four inlets and two outlet branches (two ensure that the grid density was sufficient. Refractive index
Downloaded by Pennsylvania State University on 11 April 2011
branches share a common outlet in order to maintain the equal distribution obtained from CFD simulations was used for the
back-pressure at both sides). CaCl2 solution (3.5 M, nD 1.41) optical ray-tracing to study the trajectories of light during the
and H2O (nD 1.33) were injected into the device as shown in focusing process. The ABCD law based ray-tracing algorithm for
Fig. 1B1. The refractive index of the mixture is linearly depen- HS refractive index gradient29 was written in MATLAB. More
dent on the CaCl2 concentration. Fig. 1B2 depicts a typical flow details of device fabrication and experiment setup can be found
pattern in the L-GRIN device with CaCl2 flow rates and H2O in the ESI (Figs. S1 and S2).†
flow rates at both sides being 3.0 ml m1 and 1.8 ml m1, respec-
tively. On each side, two fluids of different refractive indices
merged to form co-injected laminar flows and establish a CaCl2 Result and discussions
concentration distribution that resembles the error function or
Translation mode
half of the HS profile (cross-section I, Fig. 1B2). The convergence
of co-injected streams from both sides eventually results in In the translation mode, the fluidic injection rates were
a complete HS-like refractive index distribution (cross-section II, symmetric about the axis of the device. The CaCl2 solution flow
Fig. 1B2) in the main channel. The refractive index profile within rates were kept constant and H2O flow rates were adjusted to
the main channel can be readily adjusted by changing the flow change the refractive index contrast within the main channel. The
rate from different inlets. translation mode was studied using a long-version L-GRIN lens
The input light from a semiconductor laser diode (wavelength (main channel length ¼ 400 mm) in order to cover a larger focal
¼ 532 nm) or a halogen white-light source (Ocean Optics) was length range. We first performed CFD studies on the distribution
coupled into the L-GRIN lens using a multi-mode optical fiber of the CaCl2 concentration21 in the L-GRIN lens at different flow
(Ocean Optics, outer diameter ¼ 155 mm, core diameter ¼ 50 mm, conditions. The CaCl2 concentration distribution for a repre-
and nominal numerical aperture NA ¼ 0.22). The optical fiber sentative flow condition (CaCl2 flow rates ¼ 3.0 ml m1, H2O flow
was aligned with the L-GRIN lens through a guide channel. The rates ¼ 1.8 ml m1) is shown in Fig. 2A, which matches well with
thickness of PDMS between the aperture of the optical fiber and the experimental result shown in Fig. 1B2. Fig. 2B shows cross-
the microfluidic channel was 100 mm. The height of channels was sectional refractive index profiles at five different locations
155 mm throughout the device. The L-GRIN main channel has (cross-sections 1–5, as indicated in Fig. 2A). The results indicate
a width of 160 mm. Two designs were used for different experi- that the CaCl2 concentration/refractive index profile were stable
mental characterizations. They only differ in the length of the along the length of the L-GRIN lens (cross-sections 2–4). At the
main channel, including a ‘‘long version’’ (main channel length ¼ two ends of the L-GRIN lens (cross-sections 1 and 5), however,
400 mm, shown in Fig. 1B) and a ‘‘short version’’ (main channel the refractive index was almost uniform across the channel
length ¼ 250 mm). All fluidic inlet and outlet channels were 50 mm width, with a value close to that of the PDMS (1.41). The
wide. The L-GRIN device was fabricated using standard soft matched refractive indices between the fluids and PDMS reduced
lithography. The injection of fluids was carried out using preci- the light scattering lost caused by the rough surfaces of PDMS
sion syringe pumps (KD Scientific 210). The image acquisition channels.25 Changing the flow conditions (CaCl2 flow rates ¼ 3.0
was performed using an inverted optical microscope (Nikon TE ml m1, H2O flow rates ¼ 0.6, 1.2, 1.8, 2.4, and 3.0 ml m1,
2000U), a 16-bit monochromatic CCD camera (CoolSNAP respectively) yielded different refractive index profiles in the L-
HQ2), and a color digital camera (Nikon). GRIN lens (cross-section 3), as shown in Fig. 2C. The figure
Fig. 1C depicts the two operation modes of the L-GRIN lens, shows that with the fixed CaCl2 flow rate, higher H2O flow rates
namely the ‘‘translation mode’’ and the ‘‘swing mode.’’ In both result in larger refractive index contrast. We also noticed that the
modes, the flow rates of CaCl2 solutions remained unchanged. In simulated refractive index distributions in the L-GRIN lens can
the translation mode, the refractive index contrast (difference be well fitted with the HS curves described in Eq. 1.
between n0 and ns in Eq. 1) can be adjusted by symmetrically The parameters extracted from the CFD simulation were used
changing the flow rates of H2O from both sides to realize to conduct ray-tracing simulations for predicting the trajectories
different focal lengths, such as no focusing (Fig. 1C1), a large of the input light during the focusing process (Fig. 2D). The
2052 | Lab Chip, 2009, 9, 2050–2058 This journal is ª The Royal Society of Chemistry 2009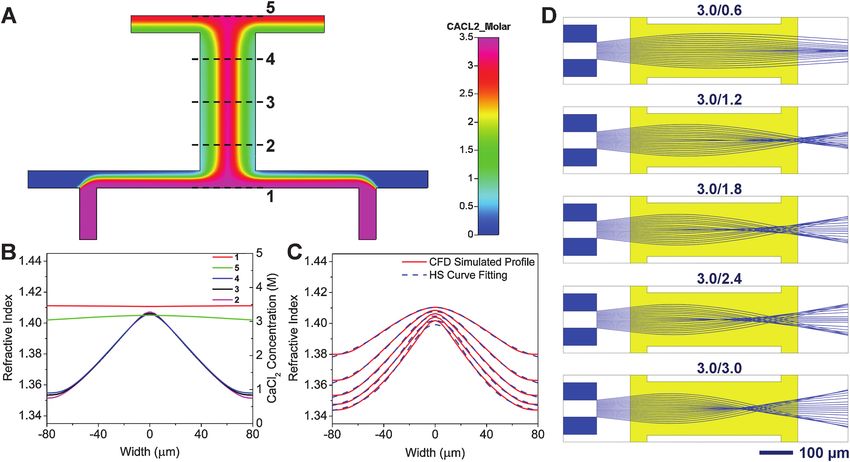
View Online
Published on 15 April 2009 on http://pubs.rsc.org | doi:10.1039/B822982A
  Downloaded by Pennsylvania State University on 11 April 2011

                                                                           Fig. 2 CFD and ray tracing simulation for the translation mode. (A) Simulated CaCl2 concentration distribution in a long-version L-GRIN lens (CaCl2
                                                                           flow rate ¼ 3.0 ml m1 and H2O flow rate ¼ 1.8 ml m1). The color bar represents the molar concentration of CaCl2. (B) Cross-sectional CaCl2
                                                                           concentration/refractive index profiles at different locations (top to bottom: cross-sections 1, 5, 4, 3, and 2, respectively, as defined in Fig. 2A). (C)
                                                                           Refractive index profile at the middle of the L-GRIN lens (cross-section 3 defined in Fig. 2A) for different flow conditions (top to bottom, the CaCl2 flow
                                                                           rates were fixed at 3.0 ml m1, and the H2O flow rates were 0.6, 1.2, 1.8, 2.4, and 3.0 ml m1, respectively). Dotted lines are HS curve fitting. (D) Ray-
                                                                           tracing simulation in a long-version L-GRIN lens using the parameters obtained from the CFD simulation. The flow conditions are indicated in the
                                                                           graph (e.g., 3.0/3.0 represents CaCl2 flow rates ¼ 3.0 ml m1, and H2O flow rates ¼ 3.0 ml m1, respectively).

                                                                           trajectories of the light beams were analytically solved using the              due to the complete mixing of the two fluids, and light travelled
                                                                           ABCD law29 between cross-sections 2 and 4. In the transition                    through the lens without any significant distortion, resulting in
                                                                           regions where the ABCD law was not applicable due to the                        a cone-shaped divergent output light path.
                                                                           variable refractive index along the channel length, the refractive                 To characterize the change of focal length during the variable
                                                                           index domain was discretized and the beam was traced grid-to-                   light focusing process, the L-GRIN lens was subsequently tested
                                                                           grid using the Snell’s law.21 The ray-tracing simulations clearly               at each of the flow conditions used in the ray-tracing simulation
                                                                           show that the focal length can be adjusted by changing flow                     (Fig. 2D). Figs. 3B to 3F depict the focusing pattern in the L-
                                                                           conditions. Higher H2O flow rates (when CaCl2 flow rates are                    GRIN lens at different flow conditions. The trajectories of light
                                                                           constant) result in larger refractive index contrast, which causes              were shown to bend smoothly in the fluid-based refractive index
                                                                           light to bend toward the lens axis more significantly and leads to              gradient and brought into a focal point. The change of the
                                                                           the decreased focal distance.                                                   focusing position was evident from the experiments. The images
                                                                              The ray-tracing experiments for the translation mode are                     also record the change of the flow patterns within the micro-
                                                                           shown in Fig. 3. To observe the trajectory of the input light beam              fluidic channel, which is more evident in the video taken in the
                                                                           (from a semiconductor laser diode, wavelength ¼ 532 nm) in the                  same variable focusing process (Video S1 in the ESI†). The
                                                                           L-GRIN lens during the variable focusing process, we dyed both                  experimental results (Figs. 3B to 3F) match well with the ray-
                                                                           CaCl2 solution and H2O with fluorescent dye rhodamine B (10 mg                  tracing simulation (Fig. 2D). The numerical aperture (NA) of the
                                                                           ml1; excitation wavelength ¼ 532 nm; emission wavelength ¼                     L-GRIN lens varied from nearly zero in Fig. 3B to approxi-
                                                                           560 nm). With rhodamine-dyed solution, the light path within                    mately 0.30 in Fig. 3F (NA ¼ nsinQ, where n ¼ 1.40 and Q is
                                                                           the L-GRIN lens shows a reddish color due to the fluorescent                    half of the output light exit angle after focusing and was
                                                                           emission of the rhodamine. Light passing through the PDMS                       measured to be 0 from Fig. 3B and 12.5 from Fig. 3F). Such
                                                                           substrate near the channel wall displays a green or yellowish                   NA is sufficient for on-chip applications such as multi-fiber
                                                                           color, which can be attributed to the scattered laser excitation                optical trapping (typical NA  0.1).5,6 Further optimization of
                                                                           light (green), or combined effects of the scattered laser light                 numerical aperture is needed to achieve NA > 1.0, which is
                                                                           (green) and fluorescence (red) emitted by the rhodamine that                    necessary for single-fiber optical trap.7
                                                                           diffuses into PDMS. The refractive index change of the solution                    The focal distance, defined as the distance between the
                                                                           caused by the rhodamine was negligible due to the low dye                       focusing position and the aperture of the optical fiber, was
                                                                           concentration. In Fig. 3A, the fluid injection was halted after the             measured from the simulation and experimental results in Figs. 2
                                                                           channel was filled with both fluorescently doped fluids. In this                and 3, and plotted as a function of sheath flow rate (Fig. S3 in the
                                                                           case, the refractive index in the L-GRIN lens was homogenous                    ESI†). A good agreement between the simulation and experiment

                                                                           This journal is ª The Royal Society of Chemistry 2009                                                             Lab Chip, 2009, 9, 2050–2058 | 2053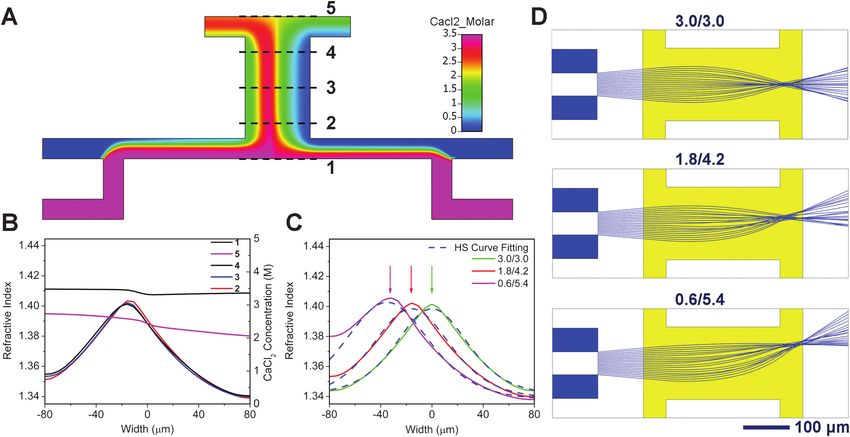
View Online
Published on 15 April 2009 on http://pubs.rsc.org | doi:10.1039/B822982A
  Downloaded by Pennsylvania State University on 11 April 2011

                                                                           Fig. 3 Ray-tracing experiments for the translation mode to characterize       Fig. 4 Characterization of the focused light beam profile in the trans-
                                                                           the variable focal length at different flow conditions. (A) Ray tracing for   lation mode. (A) Cross-sectional image of the focused light for different
                                                                           stagnant flow (homogenous refractive index). (B–F) Ray tracing for            flow conditions (A1: 3.0/3.0, which represents CaCl2 flow rates ¼ 3.0 ml
                                                                           dynamic flow. The CaCl2 flow rates were fixed at 3.0 ml m1 and the H2O       m1 and H2O flow rates ¼ 3.0 ml m1; A2: 3.0/2.4; A3: 3.0/1.8; A4: 3.0/1.2;
                                                                           flow rates were (B) 0.6, (C) 1.2, (D) 1.8, (E) 2.4, and (F) 3.0 ml m1,       A5: 3.0/0.6; and A6: 0.0/0.0). (B) and (C) are the intensity distributions of
                                                                           respectively.                                                                 the focused light in Z and X directions. The intensity readings were
                                                                                                                                                         sampled at a 10 mm interval from the images in (A) and fitted with
                                                                                                                                                         Gaussian curves. The flow conditions are indicated in the graphs (e.g.,
                                                                           was found. The tuning range for the focal distance is approxi-                3.0/3.0 represents CaCl2 flow rates ¼ 3.0 ml m1 and H2O flow rates ¼
                                                                           mately from 1,200 to 500 mm as the sheath flow rate increases. It             3.0 ml m1). (D) Plot of beam width (FWHM) measured from (C) as
                                                                           is possible to achieve shorter focal distance, and hence larger NA,           a function of sheath flow rate.
                                                                           by increasing the refractive index contrast (e.g., increasing the
                                                                           concentration of CaCl2 solution or adapting other fluids with
                                                                           higher refractive index).                                                     lens and the flow rate of CaCl2 solution were fixed while the H2O
                                                                              The optical performance of the L-GRIN lens was further char-               flow rates were adjusted to tune the focusing position. Changes in
                                                                           acterized by evaluating the tunability of the beam profile and light          the shapes and intensities of the light spots demonstrate the
                                                                           intensity. To measure the width and intensity distribution of                 focusing effect and tuning behavior. Increasing the H2O flow rate
                                                                           focused beams, the cross-sectional images of the focused light                shortened the focusing distance and causes the light to focus before
                                                                           beams at each flow condition were obtained using a side-view                  reaching the microscope focal plane (over-focused, Fig. 4A1 and
                                                                           imaging21,35–37 method (Fig. S2 in the ESI†). The experiment was              Fig. 4A2). On the other hand, decreasing the H2O flow rate caused
                                                                           conducted in a short-version L-GRIN lens (main channel length ¼               an increase of the focal distance and under-focused light spots
                                                                           250 mm). A halogen white light source, instead of a laser diode, was          (Fig. 4A4 and Fig. 4A5). In both cases, the focusing positions were
                                                                           used in the experiments due to the better image quality. Measure-             moved away from the fixed microscope focal plane, the width of
                                                                           ments were started by setting the CaCl2 solution flow rates at 3.0 ml         light spots in the X direction increased, and the light intensity
                                                                           min1 and H2O flow rates at 1.8 ml min1. The sharpest possible               decreased. Ceasing the injection of both fluids created an unfo-
                                                                           cross-sectional image (Fig. 4A3) of the light spot at this flow rate          cused light spot (Fig. 4A6) of which the intensity was much lower
                                                                           was first obtained, after which the focal plane of the microscope             than the sharply focused light spot in Fig. 4A3.

                                                                           2054 | Lab Chip, 2009, 9, 2050–2058                                                          This journal is ª The Royal Society of Chemistry 2009
View Online
Fig. 4B and 4C show the quantitative analysis of the light Swing mode
intensity distribution along the center lines of focused light spot
The swing mode operates in a slightly different flow condition
in X and Z directions. The results indicate that the intensity
from the translation mode. The CaCl2 flow rate was kept
distributions of focused light beam in both X and Z directions
constant at 3.0 ml m1 from each side (6.0 ml m1 in total from
follow the Gaussian distribution. The L-GRIN lens focuses light
both sides). On the other hand, the H2O flow rate from each side
in the X-Y device plane. Therefore, in the Z direction the peak
was adjusted asymmetrically, while keeping the total H2O flow
intensity varied with the flow rate, while the base peak width was
rate from the two sides constant (6.0 ml m1). We tested several
maintained at 160 mm, which is consistent with the width of the
typical combinations of H2O flow rates including 5.4/0.6
divergent beam in the Z direction. In the X direction, however,
(abbreviation for 5.4 ml m1 from the left side and 0.6 ml m1 from
both the peak intensity and beam width varied with the flow rate.
the right), 4.2/1.8, 3.0/3.0, 1.8/4.2, and 0.6/5.4 ml m1. The
This phenomenon was due to the focusing effect in the X–Y
experiments were conducted using a short-version L-GRIN lens
plane. The peak intensity enhancement factor (light intensity in
in order to achieve a larger swing range.
Fig. 4A3 divided by that in Fig. 4A6) was calculated to be 8,
The CFD simulated CaCl2 concentration distribution for
which is among the highest enhancement factors reported.25
a representative flow condition in the swing mode (CaCl2 flow
Published on 15 April 2009 on http://pubs.rsc.org | doi:10.1039/B822982A
The full width at half maximum (FWHM) of the beam along
rate ¼ 3.0 ml m1 on both side, H2O flow rate ¼ 1.8/4.2 ml m1)
the X direction was extracted from the Fig. 4C and plotted as
was shown in Fig. 6A. The asymmetrical distribution of the
Downloaded by Pennsylvania State University on 11 April 2011
a function of sheath flow rate in Fig. 4D. The minimum width
CaCl2 concentration was clearly shown in the simulation. Fig. 6B
(the well-focused light beam, Fig. 4A3) was estimated to be 22
shows the cross-sectional refractive index profiles at five different
mm, which is sufficient for on-chip optical applications such as
locations (cross-sections 1–5, as indicated in Fig. 6A). The results
flow cytometry. We believe that the major limiting factor for
indicate that the CaCl2 concentration (or refractive index) profile
further reducing the beam width at the current stage is the
was stable along the length of the L-GRIN lens (cross-sections 2–
aberration of the lens (non-ideal refractive index distribution). In
4), which was similar to the observations in the translation mode
order to achieve higher beam quality, further optimization of the
(Fig. 2B). The profiles at the two ends were not as uniform as
diffusion profile is necessary. This is possible by using more
those in the translation mode, but they still provide decent
sophisticated and precise methods to control microfluidic
refractive index match to PDMS (n ¼ 1.41). Fig. 6C shows the
diffusion.38–41
changes of refraction index distribution in the middle of the L-
In order to demonstrate its compatibility with other micro-
GRIN lens (cross-section 3) with different flow conditions
fluidic components and potential in lab-on-a-chip applications,
(CaCl2 flow rates ¼ 3.0 ml m1 on both sides, and H2O flow rates
we incorporated the L-GRIN lens into a simplified microfluidic
¼ 3.0/3.0, 1.8/4.2, and 0.6/5.4 ml m1, respectively). We noted that
flow cytometry device (Fig. 5). The device includes a short-
all refractive index profiles can be well fitted with the HS profiles,
version L-GRIN lens and a neighboring channel with flowing
expect for a small portion near the edge of the L-GRIN lens
particles (Bangs Laboratories, 9.85 mm polystyrene fluorescent
(H2O flow rate ¼ 0.6/5.4 ml m1). However, this deviation would
particles, excitation wavelength ¼ 525 nm, emission wavelength
not affect the focusing result since light was not expected to travel
¼ 565 nm). The flow rate of CaCl2 solution and H2O in the
through this portion. We further noted that although the
GRIN lens were set at 3.0 ml m1 and 1.8 ml m1, respectively.
refractive index distributions were no longer symmetric about the
These parameters, along with the device geometry, were chosen
centerline of the main channel, they are symmetric about their
to ensure that light was focused within the particle channel.
own axes. The shift of the axis position (indicated by the arrows
Fig. 5A to 5C show three consecutive images of a chain of
in the diagram) is evident.
individual particles travelling through the illumination region
The ray-tracing simulation for the swing mode was conducted
defined by the L-GRIN lens. The results show that the fluores-
using the same method as previously described in the translation
cent particle emitted fluorescence (Fig. 5B) only when they
mode. The simulated results (Fig. 6D) reveal that in the swing
entered the illumination region, whereas no fluorescence was
mode the off-optical-axis input light can still be focused toward
observed (Figs. 5A and 5C) from nearby particles outside the
the optical axis, which leads the output light toward a different
illumination area.
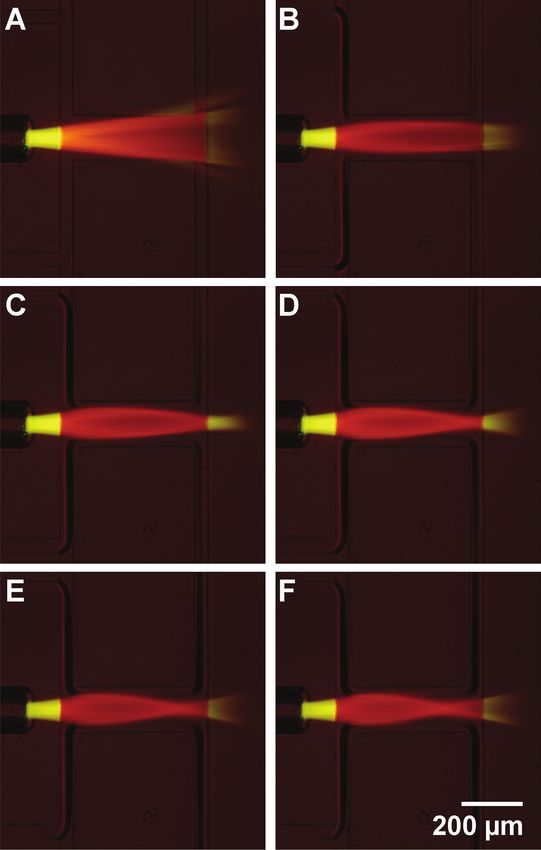
Fig. 5 Consecutive images (A–C) showing the L-GRIN lens integrated with a microfluidic flow cytometry device. The traced particle (highlighted by
a white arrow) only emitted fluorescence when entering the light-focusing region near the centre axis of the L-GRIN lens. No fluorescent emission was
observed from the neighboring particles that were outside the light-focusing region.
This journal is ª The Royal Society of Chemistry 2009 Lab Chip, 2009, 9, 2050–2058 | 2055View Online
Published on 15 April 2009 on http://pubs.rsc.org | doi:10.1039/B822982A
Downloaded by Pennsylvania State University on 11 April 2011
Fig. 6 CFD and ray-tracing simulation for the swing mode. (A) Simulated CaCl2 concentration distribution (CaCl2 flow rates ¼ 3.0 ml m1 on each side,
and the H2O flow rate on the left ¼ 1.8 ml m1, and the H2O flow rate on the right ¼ 4.2 ml m1, abbreviated as 1.8/4.2 ml m1) in a short-version L-GRIN
lens. The color bar represents the molar concentration of CaCl2. (B) Cross-sectional CaCl2 concentration/refractive index profiles at different locations
(top to bottom: cross-sections 1, 5, 4, 3, and 2 defined in A). (C) Refractive index profile at the middle of the L-GRIN lens (cross-section 3) for different
flow conditions (left to right: CaCl2 solution flow rates were fixed at 3.0 ml m1 on both sides, and the H2O flow rates were 0.6/5.4, 1.8/4.2, and 3.0/3.0 ml
m1, respectively). Dotted lines are HS curve fitting. (D) Ray-tracing simulation in a short-version L-GRIN lens using the parameters obtained from the
CFD simulation. The flow conditions are indicated in the graph (i.e., 1.8/4.2 represents H2O flow rate ¼ 1.8 ml m1 on the left and 4.2 ml m1 on the right).
direction. They also reveal that the swing angle of the output of the sheath flow rate (Fig. S4 in the ESI†). A good agreement
light can be further adjusted by shifting the position of optical between the simulation and experiment was found. The results
axis. The swing angle increased when H2O flow rates from each show a maximum swing angle of approximately 12 . A larger
side became further unbalanced. Swing in the opposite side can swing angle is possible by further optimizing the refractive index
be conveniently achieved by simply switching the H2O flow rates. gradient and channel geometries.
To experimentally observe the change of the output light To the best of our knowledge, the swing mode of in-plane
propagation in the swing mode, similar ray tracing experiments tunable microlenses has never been previously demonstrated. We
were conducted as previously described in the translation mode. believe that this additional degree of freedom in tunable micro-
Both CaCl2 solution and H2O were dyed with rhodamine to lenses can be of great interest for optics-based lab-on-a-chip
show the light path of focused beam. A short-version L-GRIN applications such as on-chip confocal microscope42 and trapping/
lens was operated at the same flow conditions as those used in the transporting microparticles/cells with fiber-based optical twee-
simulation (Fig. 6D). Fig. 7 depicts the light focusing patterns at zers,5–7 in which the scanning of the sample or change of the light
different flow conditions (from 7A to 7E, CaCl2 flow rate ¼ 3.0/ propagation direction is needed.
3.0 ml m1, and H2O flow rates ¼ 5.4/0.6, 4.2/1.8, 3.0/3.0, 1.8/4.2,
and 0.6/5.4 ml m1, respectively). Fig. 7C shows the neutral
Conclusions
position of the focused light when the H2O flow rates on both
sides were equal (3.0/3.0 ml m1). In this case, the refractive index In this study, an on-chip tunable optofluidic microlens configu-
in the L-GRIN lens was symmetric, and light was focused at the ration named L-GRIN lens was presented. In the L-GRIN lens,
centerline of the device. From Fig. 7C to Fig. 7A (or from light is focused due to the gradient refractive index within the
Fig. 7C to Fig. 7E), the focused output light gradually moved liquid medium, rather than curved refractive interfaces used in
away from the channel centerline as the H2O flow rates on two existing microlenses. This unique microlens mechanism not only
sides become increasingly unbalanced. Both the focusing of light enables the flexible changing of the focal distance (translation
and the change of the output light direction were evident. The mode), but also allows shifting of the output light direction
images also show the change of the flow patterns within the (swing mode), a second degree of freedom that to our knowledge
microfluidic channel, which is more evident from a video of the has yet to be accomplished for in-plane tunable microlenses. The
same variable focusing process (Video S2 in the ESI†). The swing combination of CFD and ray-tracing simulations proves to be an
angle for each flow rate was measured from the simulation and effective method to numerically prototype the L-GRIN lens.
experimental results in Fig. 6 and Fig. 7 and plotted as a function The L-GRIN lens can be readily fabricated via the standard
2056 | Lab Chip, 2009, 9, 2050–2058 This journal is ª The Royal Society of Chemistry 2009View Online
Fig. 7 Ray-tracing experiments for the swing mode to characterize the variable output light direction at different flow conditions. The CaCl2 flow rates
were fixed at 3.0 ml m1 on both sides, and the H2O flow rates were (A) 5.4 ml m1 on the left and 0.6 ml m1 on the right (abbreviated as 5.4/0.6), (B) 4.2/
1.8, (C) 3.0/3.0, (D) 1.8/4.2 and (E) 0.6/5.4 ml m1, respectively.
Published on 15 April 2009 on http://pubs.rsc.org | doi:10.1039/B822982A
soft-lithography technique and is highly compatible with other 7 C. Liberale, P. Minzioni, F. Bragheri, F. De Angelis, E. Di Fabrizio
Downloaded by Pennsylvania State University on 11 April 2011
microfluidic components. It also shows a high tunability and and I. Cristiani, Nat. Photon., 2007, 1, 723–727.
8 S. Kuiper and B. H. W. Hendriks, Appl. Phys. Lett., 2004, 85, 1128–
strong focusing performance. The NA of the microlens ranges 1130.
from nearly 0 to 0.3, and the angle of output light direction can 9 L. Dong, A. K. Agarwal, D. J. Beebe and H. Jiang, Nature, 2006, 442,
be freely adjusted within 12 . A focused beam width of 22 mm 551–554.
was achieved, and the peak intensity enhancement factor in the 10 N. Chronis, G. Liu, K. H. Jeong and L. Lee, Opt. Express, 2003, 11,
2370–2378.
L-GRIN lens was 8, which is among the highest enhancement 11 L. Pang, U. Levy, K. Campbell, A. Groisman and Y. Fainman, Opt.
factors that have been reported.25 The operational flow rate of Express, 2005, 13, 9003–9013.
the L-GRIN lens is on the order of a few ml m1, which is >100 12 Z. Li, Z. Zhang, A. Scherer and D. Psaltis, Opt. Express, 2006, 14,
10494–10499.
times lower than those in the previously reported in-plane 13 S. Balslev, A. M. Jorgensen, B. Bilenberg, K. B. Mogensen,
tunable liquid–liquid lenses.21,25 Such a significant reduction in D. Snakenborg, O. Geschke, J. P. Kutter and A. Kristensen, Lab
liquid consumption leads to sustainable operation of the lens and Chip, 2006, 6, 213–217.
much less stringent requirements in the future on-chip pumping 14 D. V. Vezenov, B. T. Mayers, R. S. Conroy, G. M. Witesides,
P. T. Snee, Y. Chan, D. G. Nocera and M. G. Bawendi, J. Am.
systems for lens control. In summary, the L-GRIN lens delivers Chem. Soc., 2005, 127, 8952–8953.
excellent flexibility, performance, and compatibility, and it 15 D. B. Wolfe, R. S. Conroy, P. Garstecki, B. T. Mayers,
should benefit a wide variety of optics-based lab-on-a-chip M. A. Fischbach, K. E. Paul, M. Prentiss and G. M. Whitesides,
Proc. Natl. Acad. Sci. USA, 2004, 101, 12434–12438.
applications.
16 C. L. Bliss, J. N. McMullin and C. J. Backhouse, Lab Chip, 2007, 7,
1280–1287.
17 S. Camou, H. Fujita and T. Fujii, Lab Chip, 2003, 3, 40–45.
Acknowledgements 18 J. Seo and L. P. Lee, Sens. Actuators, B, 2004, B99, 615–622.
19 D. Psaltis, S. R. Quake and C. Yang, Nature, 2006, 442, 381–386.
We thank Yuebing Zheng, Thomas R. Walker, and Daniel 20 C. Monat, P. Domachuk and B. J. Eggleton, Nat. Photon., 2007, 1,
Ahmed for assistance in experiments and helpful discussions. 106–114.
This research was supported by National Science Foundation 21 X. Mao, J. R. Waldeisen, B. K. Juluri and T. J. Huang, Lab Chip,
2007, 7, 1303–1308.
(ECCS-0824183 and ECCS-0801922) and the Penn State Center 22 D. Di Carlo, D. Irimia, R. G. Tompkins and M. Toner, Proc. Natl.
for Nanoscale Science (MRSEC). Components of this work were Acad. Sci. USA, 2007, 104, 18892–18897.
conducted at the Penn State node of the NSF-funded National 23 A. P. Sudarsan and V. M. Ugaz, Proc. Natl. Acad. Sci. USA, 2006,
103, 7228–7233.
Nanotechnology Infrastructure Network (NNIN). 24 Y. Yamaguchi, F. Takagi, K. Yamashita, H. Nakamura, H. Maeda,
K. Sotowa, K. Kusakabe, Y. Yamasaki and S. Morooka, AIChE J.,
2004, 50, 1530–1535.
25 S. K. Y. Tang, C. A. Stan and G. M. Whitesides, Lab Chip, 2008, 8,
References 395–401.
26 M. A. Unger, H. P. Chou, T. Thorsen, A. Scherer and S. R. Quake,
1 D. Erickson, C. Yang and D. Psaltis, Photonics Spectra, 2008, 42, 74– Science, 2000, 288, 113–116.
79. 27 M. Zickar, W. Noell, C. Marxer and N. de Rooij, Opt. Express, 2006,
2 J. Godin, V. Lien and Y. H. Lo, Appl. Phys. Lett., 2006, 89, 061106/ 14, 4237–4249.
061101–061106/061103. 28 C. Gomez-Reino, M. V. Perez and C. Bao, in Gradient-Index Optics:
3 Z. Wang, J. El-Ali, M. Engelund, T. Gotsaed, I. R. Perch-Nielsen, Fundamentals and Applications, eds. C. Gomez-Reino, M. V. Perez
K. B. Mogensen, D. Snakenborg, J. P. Kutter and A. Wolff, Lab and C. Bao, Springer, Heidelberg, 2002, pp. 127–131.
Chip, 2004, 4, 372–377. 29 D. B. Wolfe, D. V. Vezenov, B. T. Mayers, G. M. Whitesides,
4 D. Yin, E. J. Lunt, M. I. Rudenko, D. W. Deamer, A. R. Hawkins R. S. Conroy and M. G. Prentiss, Appl. Phys. Lett., 2005, 87,
and H. Schmidt, Lab Chip, 2007, 7, 1171–1175. 181105.
5 J. T. Blakely, R. Gordon and D. Sinton, Lab Chip, 2008, 8, 1350– 30 S. K. Y. Tang, B. T. Mayers, D. V. Vezenov and G. M. Whitesides,
1356. Appl. Phys. Lett., 2006, 88, 061112.
6 J. Guck, S. Schinkinger, B. Lincoln, F. Wottawah, S. Ebert, 31 B. K. Juluri, S.-C. S. Lin, T. R. Walker, L. Jensen and T. J. Huang,
M. Romeyke, D. Lenz, H. M. Erickson, R. Ananthakrishnan, Opt. Express, 2009, 15, 2997–3006.
D. Mitchell, J. Kas, S. Ulvick and C. Bilby, Biophys. J., 2005, 88, 32 C. Gomez-reino, M. V. Perez, C. Bao, M. T. Flores-arias and S. Vidal,
3689–3698. J. Mod. Opt., 2000, 47, 91–102.
This journal is ª The Royal Society of Chemistry 2009 Lab Chip, 2009, 9, 2050–2058 | 2057View Online
33 S.-C. S. Lin, T. J. Huang, J.-H. Sun and T.-T. Wu, Phys. Rev. B: 38 D. Irimia, D. A. Geba and M. Toner, Anal. Chem., 2006, 78, 3472–
Condens. Matter, 2009, 79, 094302. 3477.
34 D. S. Wilkinson, in Mass Transport in Solids and Fluids, Cambridge 39 N. L. Jeon, S. K. W. Dertinger, D. T. Chiu, I. S. Choi, A. D. Stroock
University Press, 2000, pp. 60–65. and G. M. Whitesides, Langmuir, 2000, 16, 8311–8316.
35 J. Cao, B. Donell, D. R. Deaver, M. B. Lawrence and C. Dong, 40 F. Lin, W. Saadi, S. W. Rhee, S. J. Wang, S. Mittal and N. L. Jeon,
Microvas. Res., 1998, 55, 124–137. Lab Chip, 2004, 4, 164–167.
36 J. Leyton-Mange, S. Yang, M. H. Hoskins, R. F. Kunz, J. D. Zahn 41 Y. Du, J. Shim, M. Vidula, M. J. Hancock, E. Lo, B. G. Chung,
and C. Dong, J. Biomed. Eng., 2006, 128, 271–278. J. T. Borenstein, M. Khabiry, D. M. Cropek and
37 X. Mao, J. R. Waldeisen and T. J. Huang, Lab Chip, 2007, 7, 1260– A. Khademhosseini, Lab Chip, 2009, 9, 761–767.
1262. 42 S. Kwon and L. P. Lee, Opt. Lett., 2004, 29, 706–708.
Published on 15 April 2009 on http://pubs.rsc.org | doi:10.1039/B822982A
Downloaded by Pennsylvania State University on 11 April 2011
2058 | Lab Chip, 2009, 9, 2050–2058 This journal is ª The Royal Society of Chemistry 2009You can also read