Turkey's gas demand decline: reasons and consequences - Oxford Institute for Energy
←
→
Page content transcription
If your browser does not render page correctly, please read the page content below

April 2017

                                         The Turkey’s
                                             Forthcoming    LNG decline:
                                                      gas demand Wave:
                                                             reasons and  consequences
                                                                      A Case of ‘Crying Wolf’?

      Introduction
      Key factors contributing to sluggish demand growth after three decades of a steep growth path
      In 2001, Turkey introduced its Natural Gas Market Law 4646 with the objective of instituting an
      ambitious program for change, targeting not only liberalization of the gas market, but also the creation
      of a financially sound, competitive and transparent market, involving both private and public market
      players bringing more gas to the market at a competitive price. Although progress since then has been
      quite slow, nevertheless the Law has contributed to dynamic natural gas market development and rapid
      demand growth. Turkey’s natural gas consumption rose rapidly during the 2000s and by 2014, the
      highest gas consumption year, had more than tripled to 48.7 bcm/year 1compared to a level of 15 bcm
      in 2000.
      An OIES paper on the Turkish domestic natural gas market published in 2014 forecast that gas demand
      in Turkey would grow modestly but steadily and might reach 67–70 bcm/year by 2030.2 This assumption
      was in contradiction to the BOTAŞ forecast performed in 2012 that projected demand growth to almost
      double by 2030, reaching 81 bcm/year from the 2012 level of 45 bcm/year. With this rapid growth
      projection by BOTAŞ as well as the OECD’s Economic Outlook3 that foresaw Turkey as having the
      fastest-growing demand among OECD countries, the Turkish government faced several increasingly
      important tasks: to ensure Turkey’s energy security, meet demand in the long term, and ensure that no
      periodic supply shortages occurred in the next two decades. Shortages might also occur during the
      2020s as BOTAŞ’s long-term contracts with all its suppliers of pipeline gas are due to expire (Azerbaijan
      in 2021, Iran in 2026 and Russia in 2025), as are private companies’ contracts with Gazprom, in 2021,
      affecting around 36 bcm/year of gas. Any possible shortage of gas in the country could not only put
      energy security at risk, but also affect the internal political situation. With this concern in mind, the
      government of Turkey initiated a policy of reducing the share of imported gas and increasing the share
      of domestically produced energy resources (mainly hydropower, coal, lignite, wind and solar energy) in
      the energy mix, particularly in the power generation sector.

      1
       EMRA’s Natural Gas Market 2014 Sector Report,
      http://www.emra.org.tr/EN/Documents/NaturalGasMarket/PublishmentsReports.
      2
       Rzayeva G., Natural Gas in the Turkish Domestic Energy Market: policies and challenges, OIES, February 2014.
      https://www.oxfordenergy.org/wpcms/wp-content/uploads/2014/02/NG-82.pdf
      3
       OECD (2012)

Energy Insight: 11                                                                                                   Gulmira Rzayeva
  Energy Insight: 4                                                                                               Howard Rogers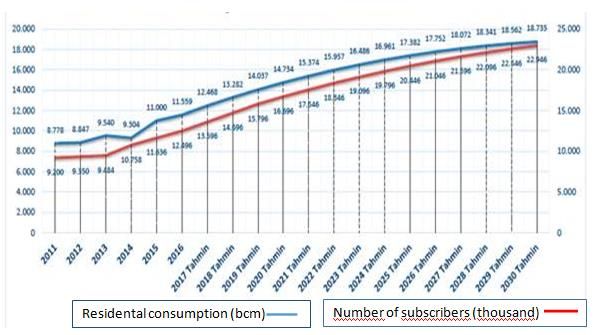
Figure 1: Turkey’s primary energy mix, 2014, 2015, 2016 4
                                 2014                                                             2015
                                                                                            3%
                             7% 2%                                                     11%

                                       33%                                                               30%
                           28%
                                                                                            30%
                                  29%                                                                   26%

               Natural gas    Coal            Petrol                          Natural gas        Coal          Petrol
               Hydro          Renewables                                      Hydro              Renewables

                                                             2016
                                                             4%

                                                           12%
                                                                       26%

                                                       30%
                                                                   28%

                                     Natural gas    Coal      Petrol         Hydro    Renewables

Source: Energy Market Regulatory Authority (EMRA) and author
Such rapid demand growth and increasing import dependence, with expenditure of USD 50 billion/year
on energy and mineral imports, led the government to take serious measures to reduce the share of
gas in the energy mix of the country, particularly in the electricity generation sector, introducing a
number of strategies and action plans on energy efficiency and renewable energy. The government
initiated an Electricity Market and Security of Supply Strategy in 2009, and in its Vision 2023 (the year
that marks the 100th anniversary of the Republic of Turkey) published in 2010 the government adopted
targets to fully utilize the lignite and hard coal potential of the country by 2023. Overall, the Vision
foresees increasing the share of renewable sources in the electricity mix to 30%, of coal to 30%, and
of nuclear plants to 10%, while reducing the share of natural gas to 30%. The government has already
almost succeeded in achieving its targets and managed to reduce the share of gas in the power
generation sector from 48.12% (or 23.5 bcm) in 20145 to 37.9% (16.52 bcm) in 20156 and 33% (15.7
bcm) in 2016 (Figure 3). It is expected that the share of gas in this sector will reduce further in 2017,
with overall gas consumption forecast by EMRA to be 46 bcm, which would be unchanged from the
previous year’s level (Figure 2). In overall country’s primary energy mix the share of gas has been
reduced for 7% over last 3 years (Figure 1). This achievement is possible thanks to the government
policy of privatization of the electricity production sector and incentives provided for renewable energies
and other domestic resources including coal and lignite.

4
  2016 data are author’s estimates calculated based on demand growth changes in various sectors
5
 EMRA Turkish natural gas Market Report 2014, http://www.epdk.org.tr/TR/Dokumanlar/Dogalgaz/YayinlarRaporlar/Yillik. By
the time of writing this paper, EMRA Turkish Natural Gas Market Report 2016 has not been published. The 2016 figures were
obtained from EMRA.
6
 Gazbir (Turkey Natural Gas Distributors Association) 2016 Natural Gas Sector Report.

The contents of this paper are the author’s sole responsibility. They do not necessarily represent the views of
the Oxford Institute for Energy Studies or any of its Members.                                                              2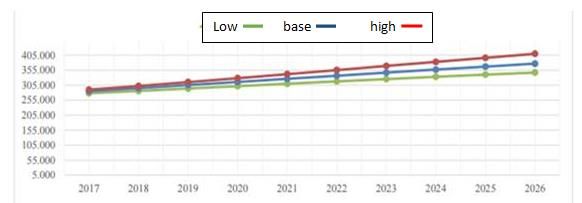
Figure 2: Gas demand growth changes, 2009–2017
                                                     Gas consumption
                       60                   16.80%                                                         20.00%

                                                                      48.717 48.885
                       50                                 45.918                        46.3       46      15.00%
                                            44.145 45.241

                       40   36.865 37.411                                                                  10.00%
                 BCM

                                                                            6.10%
                       30              6.20%                                                               5.00%
                                                          3.50%
                                                                   1.50%                          -0.60%
                       20                                                                                  0.00%
                                                                                    -1.50%
                                                                                               -4.00%
                       10     -4.50%                                                                       -5.00%

                        0                                                                                  -10.00%
                            2009    2010     2011    2012     2013     2014    2015     2016 2017(E)

Source: EMRA
The office of the new minister of energy and natural resources of Turkey, Berat Albayrak, attached even
more importance to replacing imported natural gas with locally produced energy resources, targeting
increasing the share of domestic resources in the power generation sector to at least two-thirds, with
an immediate target of 50% in 2017.7 The government achieved a remarkable outcome in 2016, which
was a record year, with around 49% of Turkey’s electricity generation from domestic and renewable
resources. The share of domestic coal in electricity generation rose from 12% to 16%. To achieve this,
the government implemented new regulations, provided a number of incentives to the private sector to
attract investment in renewable energy and local coal-fired plants, and introduced feed-in tariffs that
were supportive of the private sector.
The first results of the Vision 2023 policy started to manifest as early as May 2014, when natural gas
demand in Turkey started declining almost every month on average by around 6%, with an overall
decline in 2016 of 4% from 2015 (Figure 2). Major reasons behind the rapid decline during 2015, 2016
and into 2017 are: a) gas combustion for power fell considerably in 2015 and most of 2016 due to
increased renewables and coal-fired installed capacity and output; b) Turkey had a relatively mild 2015–
2016 winter, which may have had an impact on residential use; c) BOTAŞ introduced load shedding in
the power sector and put restrictions on gas supplies to independent gas-fired power producers and
state-controlled utilities because of gas transmission system capacity constraints during the winter peak
period.

7
From the speech of Berat Albayrak at the 15th Anniversary of the foundation of the EMRA, Ankara, 22 February 2017.

The contents of this paper are the author’s sole responsibility. They do not necessarily represent the views of
the Oxford Institute for Energy Studies or any of its Members.                                                       3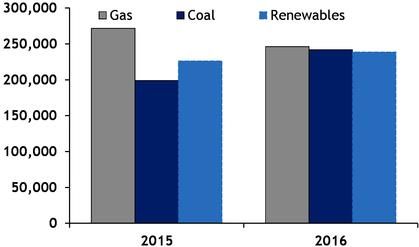
Figure 3: Primary energy sources for electricity production in Turkey, 2014-2016
                              2014                                                            2015

                             4.9%

                                                                                            6.6%

                    16.1%
      0.7%                                                                      25.6%                    37.9%
                                          48.0%

                  30.3%
                                                                        0.8%
                                                                                            29.1%

      Natural gas     Coal    Others   Hydro    Renewables            Natural gas    Coal     Others   Hydro      Renewables

Source: TEIAŞ

Thus, a number of major factors have played significant roles in the decline in the demand for gas over
the last three years and will cause further sluggish growth in the next few years. Those factors are: a)
increasingly high dependence on natural gas imports (98%) and the issue of supply security; b) the
balance of payment deficit caused by the significant difference between the cost of energy imports and
the heavily subsidized price BOTAŞ charges to domestic customers; c) GDP decline due to political
instability in the country over the last 2–3 years; d) two new nuclear power plant projects: Akkuyu, a
Rosatom plant (VVER 4800 MW) with Russia, planned to be completed by 2023, and Sinop (ATMEA
4480 MW),8developed by Japanese project company JAPCO (ENGIE, MHI, Itochu) with the Electricity
Generation Corporation (EÜAŞ) as the operator and also planned to be commissioned by 2023.
Moreover, there are technical and legal factors that constrain BOTAŞ and private gas import companies
from importing greater volumes of gas or even offtaking full contracted volumes. These factors also
indirectly contribute to the demand decline. Such technical constraints limit the penetration of additional

8
 Energy Policies of IEA Countries – Turkey, 2016 Review, International Energy Agency.
http://www.iea.org/publications/freepublications/publication/EnergyPoliciesofIEACountriesTurkey.pdf.

The contents of this paper are the author’s sole responsibility. They do not necessarily represent the views of
the Oxford Institute for Energy Studies or any of its Members.                                                                 4
volumes of gas into the BOTAŞ gas transmission system as entry and transfer capacity limitations put a strain on the system, especially during high demand periods. Legal constraints are set by the Natural Gas Market Law (NGML) as a part of its regulatory function, taking into account domestic market liberalization efforts. It sets forth various restrictions on BOTAŞ’s gas purchases, with the aim of decreasing BOTAŞ’s market share and establishing a more competitive market. Article 2 also places restrictions on gas imports by companies other than BOTAŞ. It states that no new gas purchase contracts can be signed with countries from which BOTAŞ is already importing gas until BOTAŞ’s existing contracts with these countries expire. As BOTAŞ currently imports gas from Nigeria, Algeria, Iran, Russia and Azerbaijan, a private company will not be allowed to import gas from these countries until the expiration of BOTAŞ’s existing contracts, with some exceptions put forward to ensure supply security.9 This paper attempts to review the natural gas demand balance of Turkey starting from 2014 and analyzes the main factors in and reasons behind demand decline. It also attempts to give some projections of demand growth for the next decade. Natural gas in power generation and installed generation capacity The power generation sector is the biggest consumer of gas in Turkey. Any changes in gas supply and consumption in this sector tangibly affect overall national demand growth. The new Electricity Market Law (No. 6446) introduced in 2013 dynamically and successfully implemented liberalization of the energy market. As a result, in the electricity sector most power generation assets, excluding hydro and some coal assets, as well as the distribution sector have been privatized. Privatization attracted greater investment into the sector, boosting capacity margins and supporting electricity demand growth. The government created the day-ahead and balancing market (PMUM) organized by system operator TEAŞ in 2015, which further contributed to increased investment in this sector. The electricity wholesale market was reorganized by the government in March 2015 when the new energy market operating company EPIAŞ (wholesale electricity exchange) was created and, under Law No. 6446, TEAŞ PMUM was incorporated into EPIAŞ. Figure 4: Turkish power generation mix 2015 -2016, GWh Source: Argus, TEIAŞ 9 For more details, see Austvik, O.G. & Rzayeva, G., “Turkey in the Geopolitics of Natural Gas”, Harvard Kennedy School, Mossavar–Rahmani Center, September 2016, https://www.hks.harvard.edu/centers/mrcbg/publications/awp/awp66 and OIES 2014 paperhttps://www.oxfordenergy.org/wpcms/wp-content/uploads/2014/02/NG-82.pdf. The contents of this paper are the author’s sole responsibility. They do not necessarily represent the views of the Oxford Institute for Energy Studies or any of its Members. 5
Liberalisation of the electricity market and privatisation of the sector contributed to an increase in the
production of electricity from local resources, which in return increased the total amount of power
production and indirectly affected electricity demand. Gas combustion for power fell considerably in
2015 and most of 2016 due to increased renewable and coal-fired installed capacity and output (Figure
4). Gas demand in power generation is also depressed by the fact that gas has been the most expensive
generating technology (without any support tariffs) and major investments in other technologies are
displacing gas from the merit order. Electricity in Turkey is traded at the prices set at the Exchange
Market and gas-fired plants cannot compete with renewables because the government subsidises solar,
wind and local coal-fired power producers. The cost of pipeline gas Turkey imports from its three main
gas suppliers on long-term contracts10 has always been higher than imported and domestic coal and
other domestically produced energy resources. Gas-fired plants are costed in USD terms based on
their installation costs, but the electricity produced is sold in Turkish Lira (TL), which creates a cash
deficit for the operating corporations given the 20% devaluation of the TL against the USD since the
beginning of 2016.
Thus, the government’s policy of reducing the share of gas in the power generation sector to 30% by
2023 and increasing the share of domestically produced energy resources is already close to being
achieved, thanks to the measures the government started implementing in 2014. In May 2016 the
Ministry of Energy and Natural Resources (MENR) issued the Regulation on Renewable Energy
Resources 11 which set out terms and conditions of the government support scheme to renewable
energy producers to attract more investment and increase the share of solar and wind energy in the
electricity generation energy mix. The Regulation includes the following important incentive measures: 12
a) tax incentives for wind and solar energy which include both tax refunds and exemptions;
b) de-licensing companies producing no more than 5 MWh of renewable energy. Those companies
   producing more than 5 MWh are required to apply to EMRA for a license for production;
c) minimum 10 year government purchase guarantee for electricity produced by wind (feed-in tariff
   USD 0.133/kWh), solar (feed-in tariff USD 0.073/kWh), hydroelectric (feed-in tariff USD
   0.073/kWh), geothermal (feed-in tariff USD 0.105/kWh) and biomass-fired generation (feed-in tariff
   USD 0.133/kWh) using a fixed (indexed) price structure. (Additionally, if the company is using
   locally produced components and technology and a local workforce, 3.5 to 4 cents is added to the
   fixed purchase price.);
d) when state-owned trading company Tetaş purchasing electricity, priority is given to renewable
   energy as part of government policy;
e) easing the process of land allocation;
f)   eliminating customs duties;
g) incentivizing generating companies to widely use locally produced equipment assemblies,
   components, workforce and technology to produce renewable energy, thus creating new
   employment and decreasing import dependence.
As a result, the share of renewable energy (solar and wind only) in the power generation sector
increased from 3.4% in 2014, consisting of 8,520.1 GWh for wind and 17.4 GWh for solar, to 5% in
2015 (11,652.5 GWh for wind and 194.1 GWh for solar) and to 7.8% in 2016, a total increase of wind

10
  According to an Argus Turkey Report of March 2017, BOTAŞ and private companies are estimated to buy Russian gas at
around $183/mcm, Azerbaijani gas at $192/mcm and Iranian gas at $203/mcm for gas deliveries in the first quarter of 2017, up
from the fourth quarter of 2016 in line with higher oil prices.
11
  The government created the Renewable Energy Resources Support Mechanism (YEKDEM) in 2015 to support manufacturers
of electricity from renewable energy resources, in line with the Regulation on Documentation and Support of Electricity
Manufacturing from Renewable Energy Resources which entered into force in 2013 and deals with the application process.
12
  The Renewable Energy Support Scheme is regulated by Law No. 5346 which was enacted on 18 May 2005 and became
operational on 31 December 2015. The Law is available in Turkish at: http://www.eie.gov.tr/yenilenebilir/y_mevzuat.aspx.

The contents of this paper are the author’s sole responsibility. They do not necessarily represent the views of
the Oxford Institute for Energy Studies or any of its Members.                                                                 6
contribution in power generation of 36.8% and solar of 1,015.3% in the period 2014–2015.13 At the
same time the share of gas in power generation decreased to 47.9% in 2014, to 37.9% in 2015 and
33% in 201614 (Figure 3). The production of electricity from renewables exceeded the set target by a
factor of three, reaching a total of 15.083 GWh instead of the targeted 5.423 GWh. Despite the fact that
government only offered a feed-in tariff at a breakeven rate the companies have benefited from the
guarantee of not being exposed to market and foreign exchange rate volatility risks. Equally, the
companies have the opportunity to sell their product in the liberalized market for a better price, although
the majority of companies have preferred to sell under breakeven feed-in tariffs with a purchase
guarantee.
The great rush of companies to produce more renewable energy prompted EMRA to act to modify the
Law and create more competition between the companies. In October 2016 MENR published an
Amendment to the Regulation on Renewable Energy Resources Law No. 5346 introducing new terms
and conditions which will create new competition between companies. The most important part of the
new Amendment is that the purchase guarantee will be given only to the companies that produce energy
using locally-manufactured products and technologies: 15
a) The offers by the Ministry will be in the form of financial bid packages. Bids will be assessed in
   accordance with the decreasing method on electricity price (purchase ceiling price per kWh)
   determined and announced by the Ministry.
b) The winning company will propose the lowest guarantee price to be paid by the government, which
   will be below an upper threshold to be announced by the MENR. The competition is finalized when
   the lowest and last offer is reached.
c) It is obligatory to use products manufactured in local factories for the electric energy production
   facility and the use of domestic products will be specified in the procurement plan.
d) The duration of the production licenses for renewable energy production is 30 years and at the end
   of this period a procedure is established in accordance with the legislation of the relevant institutions
   where the land use right is allocated.
However, there are some issues with the Amendment that make the implementation of the terms and
conditions of the Law difficult. It is not clear how EMRA or the Ministry will identify the origin of
equipment. Even if this is done, how will the relevant authority rank the local product and identify the
winners? EMRA needs to clarify these issues. Until EMRA clarifies or amends some provisions in the
Amendment, this will most likely cause a slow-down in investment in renewable generation plants which
will be a temporary manifestation (during 2017) and in case of necessity offset with hydro power. EMRA
at the moment is working on the Amendment to clarify the ranking of the products produced locally
which are used in renewable energy production.
In 2016 coal-fired output accounted for 33% of total power generation and hydropower for 25% with the
remainder being other renewables and thermal generation (Figure 3).The government has incentivized
widespread use of the country’s hydropower, geothermal, biomass and wave energy potential 16 and is
planning to increase their share in the energy mix over the next few years. Turkey has great potential
to develop renewable energy technologies. The MENR estimates the minimum energy potential of
hydropower to be 160,000GWh/year, wind energy capacity 40,000 GWh/year, average global solar
radiation 1.520 kWh/m2/year, biomass potential 8.6 MTEP, biogas potential 1.5–2 MTEP and
geothermal capacity 31,500 MW.17

13
  TEIAŞ Annual Report 2015.
14
  EMRA Natural Gas Sector Report 2014 and 2015, Gazbir 2016.
15
  The Amendment is available in the Official Gazette: http://www.resmigazete.gov.tr/eskiler/2016/10/20161009-1.htm.
16
  According to EMRA the share of all the renewable energy, which includes biomass, solar, hydraulic, geothermal, unlicensed
renewables and wind constituted 16.8% for 2016.
17
  Renewable Energy Report 2015, MENR, http://www.eie.gov.tr/document/2015_f_r.pdf.

The contents of this paper are the author’s sole responsibility. They do not necessarily represent the views of
the Oxford Institute for Energy Studies or any of its Members.                                                                7
The share of both imported and domestically produced coal and lignite has risen significantly in the
energy mix over the last 2–3 years. The share of coal in the power generation sector in 2014 was
30.3%, in 2015 it was 29.1% and in 2016, 33%. Higher coal-fired power generation and renewable
output in Turkey led to a more balanced generation mix in 2016 with gas burn for power continuing its
year-on-year decline. Coal-fired generation rose by 22% year on year in 2016, pressing gas-fired output
to fall by 9%.18
As with renewables, a government support scheme exists for the coal industry, encouraging
development of domestic coal reserves and increasing the use of those reserves in the power
generation sector to support economic growth by meeting domestic and industrial demands. In addition,
coal production has helped to develop some remote and less developed regions of the country as well
as create thousands of employment opportunities. The main incentives the government provides for
coal-fired power are:
a) Feed-in tariff guaranteed and purchase of electricity payable for 10 years from August 2016 by
   state-owned trading company Tetaş;
b) VAT exemption (the customs duty exemption for imported coal was eliminated in August 2016);
c) License exemption for the first 8 years and 85% discount for land use and rent;
d) Control fee waiver for deforestation and erosion for the first 10 years.
In 2016, domestic coal-fired capacity rose by 424MW to 9.4GW. As a part of a support scheme
approved by the government in June 2016, Tetaş started purchasing domestic coal-fired generation
power at a fixed price from August 2016. An import tax was also imposed on coal from August, but
despite this, imported coal-fired production climbed by around 42% over a year, it strongest growth
since at least June 2014.
The government has also guaranteed the purchase of lignite-fired output from a 700–800MW power
plant to be built in the Cayirhan area near the capital, Ankara. The winning firm will have to produce at
least 700MW of lignite-fired output from the plant for 35 years. The purchase guarantee duration is 15
years.
However, it seems that imported coal has gradually been losing ground in competition with other types
of fuel in power generation starting from November 2016 due to the surge in global coal prices. Efficient
gas-fired utilities have also become more competitive than imported-coal plants because of TL
depreciation. The delivered price for imported coal for Turkish utilities was an average $93.50/t in
January2017 19 significantly above its average price of $53.50/t in January 2016. Therefore, the
imported coal maybe replaced with domestically produced coal and lignite.

Prospects for gas use in power generation
Turkey’s electricity consumption has been on the rise year-on-year over last two decades, mainly due
to GDP and population growth (Figure 5). For the last three years the country’s electricity consumption
rose by an average 4% year-on-year and by almost 33% between 2009 and 2016. According to TEIAŞ
electricity demand will continue to rise, at an annual average 3.3% (low growth scenario), 4.3% (base
growth) or 6.3% (high growth), whereas the maximum electricity demand projection during the peak
demand seasons, based on the high-growth scenario, is projected to be 7.7% (Figure 6).

18
  Argus Turkey Report, February 2017. According to the Report hourly coal-fired output rose by 1.8GW year on year in 2016 to
10.1GW. Of this, domestic coal-fired generation rose by 1GW to 4.75GW and imported coal output rose by 0.8GW to 5.3GW.
19
  Ibid.

The contents of this paper are the author’s sole responsibility. They do not necessarily represent the views of
the Oxford Institute for Energy Studies or any of its Members.                                                                 8
Figure 5: Turkey’s electricity consumption and growth rate
                                                Electricity consumption (Mkwh)
     400                                                                                                                      12%
                                                                                                                  347
                                                                                                          334 340
     350                                                                                      317.6 325.4                     10%
                                                                     293.7      301.6 309.6
     300               9.5%                      265.7 273 278 285.6                                                          8%
                 8.5%                248.3 257.2
     250               230.3 242.3                                                                                            6%
                 210.4
           194
     200                     5.2%                                                                                             4%
     150                                    3.6% 3.3%                                                                         2%
                                     2.5%               2.7%          2.7% 2.8% 2.7% 2.7% 2.6% 2.5% 2.6%
     100                                                       1.8%                                               1.8% 2.1%   0%
     50                                                                                                                       -2%
           -2%
      0                                                                                                                       -4%
           2009 2010 2011 2012 2013 2014 2015 2016 2017 2018 2019 2020 2021 2022 2023 2024 2025 2026

Source: TEIAŞ

Figure 6: Turkey’s electricity demand projection, 2017-2026, MWh

Source: TEIAŞ
The rapid growth of electricity consumption during the last two decades, combined with TEIAŞ’s
projections of further steep growth during the next decade, was one of the main reasons that the gas
demand projection made by BOTAŞ in 2012 was so high. However, apart from the support schemes
and incentives the government provides for renewables and coal and lignite-fired plants, it continues to
facilitate the building of new non-gas fired plants and guarantee sales of electricity as a wider effort to
support domestic energy resources and reduce external dependency.
Once online, the two planned nuclear plants - Akkuyu and Sinop, which will add around 9,280 MW of
electricity generating capacity, will be able to further reduce the share of gas in the electricity generation
energy mix. Since 2009, Turkey has been advancing the development of a nuclear program on the
basis of intergovernmental agreements ratified by the Parliament. It is estimated that the first unit of its
planned $20 billion Akkuyu nuclear power plant, being built in collaboration with Russia, will be online
by the end of 2023.20 The Sinop nuclear plant located in northern Turkey (built with Japanese partners)
will be the country's second nuclear power plant and is also expected to start electricity production from
2023. However, the commencement year of 2023 for both plants seems ambitious as Turkey has never
previously had nuclear power and needs to create the legal framework to obtain nuclear permits and
approvals for different designs.

20
  Turkey expects first unit of Akkuyu nuclear plant to be online by end 2023, Reuters, http://www.reuters.com/article/us-turkey-
energy-idUSKBN1330PH.

The contents of this paper are the author’s sole responsibility. They do not necessarily represent the views of
the Oxford Institute for Energy Studies or any of its Members.                                                                      9
As the government target to reduce the share of gas in the power generation sector to 30% has already almost been achieved, no particular active measure to further curb gas consumption in this sector is expected, at least in the short term. Furthermore, when limits are imposed on gas supplies for power generation during peak demand days during the wet season, it is possible to offset lower gas output by hydro generation. This happened during the cold days in January 2017 when, with the temperature below the seasonal norm, BOTAŞ instructed both state-controlled utilities and independent gas-fired power producers (IPPs) to reduce gas use to 50% of contractual levels. BOTAŞ has to periodically limit supplies of gas to power generators and prioritize residential use due to existing bottlenecks and capacity constraints in the transmission system. The daily peak demand may reach as high as 260 mmcm/d, while the maximum daily transmission capacity is no more than 200 mmcm/d. Until the bottlenecks are removed and the capacity issue is solved, significant gas demand growth in the electricity sector seems highly unlikely. IPPs could solve the problem by directly importing spot LNG supplies through the recently built FSRU at Aliaga, north of the port city of Izmir on the country's Aegean coast, if distribution capacity is expanded, however these companies do not have import licences and import permits from EMRA. It is not expected that any changes will be made with the contract transfers by BOTAŞ to private companies in 2017or in the short- to mid-run as it seems that it is not a priority for the government for the time being. In the mid-term, if the problem with the transmission system is resolved and BOTAŞ and private companies are able to import more pipeline gas and LNG, there could be room for gas consumption growth in the power generation sector, depending on the imported gas price and the cost of gas-fired electricity generation. Currently, during the supply cut-offs described above, IPPs make losses because they operate less than 5,000 hours/year. This makes the cost per gas unit higher than the breakeven price. To protect IPPs the government is currently preparing measures which envisage paying a stand- by price to the companies for the days they are unable to operate due to cut-offs. On the other hand, more CCGT must be built for balancing renewable energy production when needed, while no CCGT investment incentives are provided by the government to the private sector. In Turkey it is hydro that offsets other renewable power output. However, with hydro the difficulty is that all the dams are contracted and new investment is needed for further construction. Also, hydro power is largely dependent on the season (drought/wet). This may also slightly add to gas demand growth in the longer term. The Amendment to the Regulation on Renewable Energy Resources Law No. 5346 introduced in 2016 has strengthened competition between renewable and gas-fired generating companies and we expect that during 2017 there will not be any significant increase in renewable (mainly solar and wind) power production. After an initial phase with rapid take-off in the deployment of renewable generation during the last three years, the rush for investment in this sector of the economy will be slower in 2017 and the share of renewables will remain stable or with little growth. However in a longer-term perspective, the Turkish government will sustain its support for renewables and constantly improve the legislation to attract more investment. This implies that due to more favourable conditions for investments in renewable plants this type of energy will continue to increase in the electricity generation mix and maintain a substantial share of power generation into the future. Given the factors described above, little to no change is expected in gas demand growth in the power generation sector in 2017. It is most likely that the demand growth will be flat to slightly increase during the 2020s and show modest growth in a longer-term perspective if imported gas prices remain favourable for Turkey, as electricity demand growth will accelerate. The share of gas in the energy mix in this sector may however decrease further as a result of government measures and support schemes for other than gas-fired power generation, depending on the pace of renewable energy deployment, coal development and electricity demand growth. Gas will continue to lose to coal competition in the wholesale market in the absence of a carbon levy or new environmental restrictions in Turkey and in the presence of a government support scheme which gives coal an advantage over gas use in power generation. The contents of this paper are the author’s sole responsibility. They do not necessarily represent the views of the Oxford Institute for Energy Studies or any of its Members. 10
Natural gas in the residential sector
Residential and commercial is the third largest energy consuming sector in Turkey with an 18.6% share.
Both sectors together consume mainly natural gas, which constitutes 30% of total use, with electricity
generated from renewable and hydro at 23% and from coal at 22%. The residential natural gas demand
has highly seasonal dependence and is typically temperature sensitive. The lowest gas consumption
months in this sector are from June to September, the warmest months of the year. During these months
maximum monthly residential gas consumption in 2016 was 10 times lower than the average monthly
residential consumption in the winter period.
The domestic sector in Turkey has shown the greatest natural gas demand growth among other sectors
for the last three years and this trend will continue in the following years. By the end of 2016, 43.1
million end users had access to natural gas which is 53% of the total population. The number of eligible
subscribers as of the end of 2016 was 12.5 million and it is expected that by 2020 this will reach 16.7
million.21 This sector accounted for 25% of total gas consumption (46 bcm) in 2016 and it is expected
that the share of gas in the residential sector will reach 29% by 2025. 22
The demand for natural gas in the residential sector has been growing modestly, with average annual
growth of 1–2 bcm/year. In 2014 the consumption in this sector was 9.3 bcm, and rose to11 bcm/year
in 2015, growth of 1.7 bcm/year. In 2016 it grew by a further 1.7 bcm to 12.7 bcm 23, 24.7% of total
natural gas consumption, up from 22.98% in 2015. It is most likely that this modest demand growth path
will be continued in the following years despite the fall in other sectors, due to four main factors:
1. Population growth: Turkey’s population is 80,173 million people (as of March 2017) with a growth
   rate from 1% to 2% year-on-year since 2000. It is forecast that Turkish population growth will slow
   and yearly growth will be no more than 1% till 2050. 24 Although modest, the yearly population
   growth may add a little to the natural gas demand growth in this sector.
2. Construction of new residential buildings: massive construction projects for new housing and
   apartment blocks are under way as a result of growth and modernization of big cities such as
   Istanbul, Ankara, Izmir, Gazientep, and Adana. Connection of new end users to the gas distribution
   system may add to demand growth in this sector. It is expected that by 2020 around 1.1 million new
   end-users will connect to the gas distribution system and have access to natural gas, with the
   growth continuing in the following years but with slowed pace. Although the total amount of
   domestic consumption has increased over the years, the average annual consumption per
   subscriber is decreasing. It was 934m 3/year in 2016 and is forecast to be 896 m 3/year in 2020.25
3. Gasification of the south-eastern part of the country: this is subject to the ceasefire agreement with
   the Kurdish terrorist organisation PKK, which will create a strong chance that Turkish energy
   companies will be interested in supplying these regions once they are connected to the BOTAŞ gas
   distribution system. In 2016 28 new provinces of the country connected to the BOTAŞ gas
   distribution system and it is expected that natural gas supply to the newly connected Agri-
   Doğubayazıt and Tunceli distribution areas will be provided soon once the EMRA tender processes
   are finalized. The process of gasification will be continued in 2017 with plans for the gasification of
   the cities of Artvin, Hakkâri-Şırnak-Yüksekova and Cizre-Idil-Silopi tendered by EMRA. After the
   bidding process, which will be concluded in 2017, all 81 provinces will have access to natural gas.
   To connect more provinces to the grid, investment will be needed to expand the capacity of the
   BOTAŞ gas transmission system. According to Gazbir, TL 3.5 billion network investment is needed
   to connect approximately 2 million new natural gas users to the system. With planned expansion,
   about 8 million additional citizens will be able to have access to natural gas. As a result, residential

21
  Gasbir Natural Gas Report 2016, http://www.enerjihaber.com/dogalgaz/2016/13370/.
22
  Ibid.
23
  EMRA 2016 data. The EMRA Natural Gas Sector Report 2016 had not been published by the time of writing this paper.
24
  Worldometers: http://www.worldometers.info/world-population/turkey-population/.
25
  Gasbir Natural Gas Report 2016.

The contents of this paper are the author’s sole responsibility. They do not necessarily represent the views of
the Oxford Institute for Energy Studies or any of its Members.                                                        11
use of natural gas is expected to climb year-on-year, adding around 1 bcm/year till 2023, with
     growth slowing in subsequent years as full gasification is reached (Figure 7).
4. If temperatures are below the seasonal norms: in January 2017 temperatures remained below
   seasonal norms at 5–6°C, keeping residential gas demand during these days high, which has rather
   a short-term impact on natural gas demand growth. During such peak demand BOTAŞ prioritizes
   residential gas use, increasing gas supplies to households while restricting gas supplies to the
   power generators.
The modest demand growth in the residential sector will not add substantially to overall Turkish demand
growth as it may be balanced by decline in the industrial sector and the effects on the electricity
generation sector described above.
Figure 7: Number of subscribers and consumption in the residential sector

Source: Gazbir estimate

Natural gas in the industrial sector
The industrial sector has the lowest gas usage among the sectors described in this paper with 504,161
independent consumers consuming 14 bcm of natural gas in 2016. Coal is the main energy source with
a 57% market share and natural gas is the second largest with 30%. Cement, iron and steel are the
main sub-sectors for energy consumption in industry.
The share of gas in the fuel mix in industry rose from 25.4% in 2014 (12.375 bcm) to 29.1% (13.965
bcm) in 2015 and to 30% (14 bcm) in 2016. 26 In previous years, demand in this sector was growing by,
on average, approximately 1 bcm year-on-year with the revival of the economy and subsequent GDP
growth after the economic crisis in 2009. However, in 2012 GDP growth fell to 2.3% due to political
tensions in Turkey’s immediate neighborhood, and gas consumption growth in the industrial sector fell
by about 15%.27 Industrial demand growth is more or less correlated with GDP but at a lower rate
because of energy saving (Figure 8). Almost all industry has access to natural gas. In April 2016, the

26
 Ibid.
27
 Rzayeva G., Natural Gas In the Turkish Domestic Energy Market: policies and challenges, OIES, February 2014.
https://www.oxfordenergy.org/wpcms/wp-content/uploads/2014/02/NG-82.pdf

The contents of this paper are the author’s sole responsibility. They do not necessarily represent the views of
the Oxford Institute for Energy Studies or any of its Members.                                                    12
IMF argued that, with revived growth in productivity, Turkey could achieve a potential output growth of
3–3.5%/year.28 In February 2017, the IMF confirmed this long-term potential but warned: “Growth is
projected to be below potential in 2016–17.” 29 The forecast slower GDP growth gives grounds for
projecting quite modest and sluggish future natural gas consumption growth in this sector.
Figure 8: GDP and natural gas demand growth correlation
20
16.8
15
10 8.5 11.1 6.1
4.8
8.5
5 6.2
1.5 6.1 2.5
5.2
3.5 -1.5
0 2.3
-4.5 0.6
-5
-4
-4.7
-10
2009 2010 2011 2012 2013 2014 2015 2016 2017
Gas demand growth % GDP growth %
Source: EMRA, Global Securities, author
After the constant rapid GDP growth from 2010 till mid-2016, growth started declining sharply from 4.5%
in June to -1.8% in September 2016, the worst indicator for the last 8 years, due to the failed coup and
domestic political tensions. GDP growth promptly recovered after government measures and incentive
packages were implemented and in October 2016 the decline slowed to -0.3%. In December, growth
was 1.9% and in January 2017 2.9%,30 demonstrating more robust but still fragile growth. Gas demand
from 2010 till 2015 was more or less correlated with GDP growth but at a much lower pace, although
in 2015 the correlation gap widened significantly. This was due to the still rapid GDP growth in Turkey
(before the failed coup) and the negative affect on gas demand growth of government support for non-
gas fired-plant. In 2016 the gap slightly narrowed as internal political events negatively affected GDP
growth and policy incentives continued. In 2017 it is estimated that there will be a slight change in GDP
growth and almost no change in gas demand growth (Figure 8) so that the gap will most likely narrow
further. In the short and mid-run the gap is forecast to continue to narrow due to forecast slow GDP
growth till 2019-2020.
The major factors that contributed to economic decline in Turkey all appear to be likely to depress rather
than augment energy and natural gas demand growth. The main factors that contributed to depressed
natural gas demand growth in the industrial sector are:
a) More contagion from the Syrian war and Iraq;
b) confrontation with the EU;
28
IMF Survey: Turkey: Growth is Robust but More Structural Reforms are Needed,
https://www.imf.org/external/pubs/ft/survey/so/2016/car042516b.htm.
29
Turkey financial sector assessment program. Detailed assessment of observance— IAIS insurance core principles,
International Monetary Fund, 8 February 2017, https://www.imf.org/en/Publications/CR/Issues/2017/02/08/Turkey-Financial-
Sector-Assessment-Program-Detailed-Assessment-of-Observance-of-the-IAIS-44642.
30
Turkey: Monthly Economic Monitor, February 2017, BBVA Research:
https://www.bbvaresearch.com/en/publicaciones/turkey-monthly-economic-monitor-march-2017/.
The contents of this paper are the author’s sole responsibility. They do not necessarily represent the views of
the Oxford Institute for Energy Studies or any of its Members. 13c) renewed domestic political tension;
d) the political focus on transitioning to a presidential system;
e) renewed questions over the future of EU–Turkey relations;31and
f) the tense security situation in the south-east and conflicts in neighboring countries that are
expected to prolong uncertainty, keeping domestic demand subdued.
However, there also factors that will most likely contribute to economic growth in Turkey, positively
affecting future gas usage in this sector:
a) Foreign Direct Investment (FDI) in Turkey recovered considerably during the second half of 2016
and reached USD 1.9 billion in December 2016, the highest monthly FDI inflows during the year.
In the first quarter of 2016, foreign investment was USD 2.7 billion, climbing in the fourth quarter to
USD 3.6 billion, and it is projected that this trend will continue – mainly due to an incentive
package initiated by the government.
b) The Turkish regulator has approved an investment budget of USD 6.3 billion and an OPEX budget
of USD 12 billion for the period covering 2016–2020. More investment is required beyond 2020.
Turkey attracted FDI of around USD 160 billion between 2003 and 2015 and the government
expects the Turkish economy to attract USD 70 billion of FDI within the next 4 years. 32 This will
depend on many factors including the internal political situation, government economic policy, and
political relations with neighboring countries including those in Europe.
c) Normalization of political and economic relations between Turkey and its third most important
trading partner, Russia, and further developing relations to a strategic partnership would bring new
investment in tourism, energy, agriculture and other sectors of the economy. Before sanctions,
bilateral trade with Russia amounted to USD35–40 billion/year. After a thaw in relations between
the two countries, it is most likely that phasing out trade sanctions, opening food imports, allowing
Turkish construction companies to enter Russia, energizing the construction of the Akkuyu nuclear
power plant and completing the first line of the Turkish Stream project by December 2019 could
increase annual bilateral trade to USD100 billion from the current USD 28 billion.
The most gas-intense sphere of the industrial sector is the production and manufacturing sector that
includes chemical and petrochemical products production (2.6 bcm in 2015), the textile, leather and
clothing industry (0.856 bcm in 2015), transport vehicle production (0.150 bcm in 2015), organized
industrial zones (3.268 bcm in 2015).33 This sector is likely to contribute most to gas demand growth as
GDP growth and an increase of FDI in the Turkish economy will contribute new gas consumers to the
industrial sector, potentially easing sluggish growth. In 2015 natural gas demand growth in this sector
was only 4% and in 2016 natural gas demand stagnated, due mainly to slowed GDP and FDI growth,
despite the connection of 30,000 new eligible consumers to the grid.
As the government’s measures are directed at the electricity sector with almost zero effect on other
sectors, with GDP growth projected to be 2.5% in 2017, 3% in 2018 34 and potentially climbing to 4.5–
5% after 2020, gas consumption in this sector may be expected to show modest growth of, on average,
1 to 2 bcm/year in the 2020s, depending on the pace of GDP growth and the level of FDI.
31
According to the Investment Support & Promotion Agency of Turkey, the UK and the Netherlands along with Azerbaijan were
the largest contributors of FDI in 2016. The political crisis with the Netherlands that emerged in March 2017 may negatively
affect FDI during 2017.
32
Turkish Energy Market Outlook: Achievements, Overview and Opportunities, October 2016,
http://dektmk.org.tr/upresimler/turkish-energy-market-outlook.pdf.
33
EMRA
34
Global Securities, Macro & Political Outlook of Turkey, December 2016.
The contents of this paper are the author’s sole responsibility. They do not necessarily represent the views of
the Oxford Institute for Energy Studies or any of its Members. 14Conclusion Natural gas is the main fuel in Turkey, accounting for almost 26% of total primary energy supply in 2016, but natural gas production is negligible – 0.4 bcm/year – making Turkey almost entirely dependent on external suppliers. Importing 98% of its gas from external suppliers creates an increasing energy import bill, which constitutes around 60% of the foreign trade deficit. Among other reasons, including energy supply security, the dominance of the gas import bill in the foreign trade deficit urged the Turkish government to initiate Programs and Action Plans to lessen the share of gas in the electricity generation energy mix, the biggest gas consuming sector. The measures undertaken were effective in just a few years and resulted in an almost 27% reduction in the share of gas in this sector (from 60% in 2007 to 33% in 2016). As a result, overall gas demand declined from 48.8 bcm in 2015 to 46 bcm in 2016, the first decline since 2009. However, it is expected that demand will be stagnant in 2017, remaining at around 46 bcm, with a small decline in the power sector balanced by modest growth in the residential sector. This can be explained by the reduced investment in renewables following the first round of rapid investment, due to the amendments introduced by MENR to the support scheme in the Regulation on Renewable Energy Resources. The amendments toughen competition between the companies and make the feed-in tariff in some cases below the cost of gas, putting renewable companies in revenue difficulties. Consequently, Turkish power companies face increased costs in 2017 related to the Yekdem renewable support scheme, the weaker Turkish currency, uncertainties regarding day-ahead prices and higher renewables capacity. Unless the government makes changes to the amendments and clarifies the ranking methods for equipment, which must originate in Turkey, investment in renewable energy is likely to be further subdued, at least in 2017. Turkey’s coal plant developments are among the largest in the world outside China and India, taking into account plants announced, proposed and under construction. But most of the coal used in the power sector is imported coal due to the low calorific value of local coal and lignite. With the support scheme the government provides for coal-fired power plants, the share of coal in the energy mix rose by 22% in 2016, causing gas-fired output to fall by 9%, and this is likely to continue due to large investments in coal developments. As a result, gas will continue to lose in competition with coal due to the high dark spread (although in November–January the spark spread was higher due to a surge in the world coal price) and because of the absence of carbon tariffs and environmental restrictions in Turkey. The Turkish government also gives coal an advantage over gas use in power generation because it does not have any binding obligations to restrict greenhouse gas emissions, which contribute to global warming at a level less than 1%. Turkey has, however, expressed its readiness to join the global fight against climate change and is expected to reduce its 2020 emissions level from 1,185 to 940 million tonnes of CO2, in line with the Paris Declaration.35 Even if gas demand surges during the peak season, especially when temperatures are below seasonal norms, the BOTAŞ gas system has a low capacity margin and has difficulty coping with demand peaks and exceptional levels of transmission system usage. This inevitably impacts the country’s gas-fired power plants and also electricity security, as the lion’s share of all natural gas is consumed in the power sector. As a partial solution, BOTAŞ restricts the gas supply to state and independent power producers, giving preference to residential gas use. This constrains natural gas demand growth even in peak seasons. To solve the capacity restrictions, BOTAŞ is planning to more than double its maximum daily gas supply capacity from the current 200 mmcm/d to 428 mmcm/d by 2024 36 by bringing new projects online. This will to be achieved by expanding the capacity of pipelines, LNG receiving terminals, FSRUs and storage facilities. With Turkish Stream coming online in 2019 as planned by Gazprom, the supply capacity will be 48 mmcm/d while the Western Line daily capacity is 41 mmcm/d. Supply capacity at the TANAP first entry point at Eskisehir, which will be directed to the domestic market, is expected to 35 Turkish Energy Market Outlook Achievements, Overview and Opportunities, http://dektmk.org.tr/upresimler/turkish-energy- market-outlook.pdf . 36 Argus Turkey Report, November 2016. The contents of this paper are the author’s sole responsibility. They do not necessarily represent the views of the Oxford Institute for Energy Studies or any of its Members. 15
be 5.7 mmcm/d in 2018, expanding to 11 mmcm/d by 2019 and reaching full entry capacity of 17
mmcm/d in 2022.
Over optimistic projections made by BOTAŞ in 2012 were based on calculations of electricity demand
growth, population growth and GDP and FDI growth which proved accurate in 2013 and 2014, when
demand pace growth was quite rapid. However, based on these calculations and BOTAŞ projections,
the government decided to take solid measures to prevent such growth in demand, which might even
more than double by 2030 without intervention. Growing dependence on external supply sources would
also affect Turkey’s economic and political security.
The reduction in natural gas demand in the power generation sector has significantly affected overall
natural gas demand growth in 2014 to 2016. This trend will continue, bringing the share of gas in
electricity generation sector down while increasing the share of coal and renewables. Given the
government decisiveness, the target of a 30% gas share in the power sector by 2023 (currently 33%,
16 bcm) is most likely to be achieved in 1-2 years and it seems that the government will continue this
policy in the longer-term. However this policy is not directed to the residential and industry sectors
where demand growth has been quite modest. On the contrary, BOTAŞ is prioritizing gas usage in the
residential sector and during the seasonal peak demand periods diverts additional volumes from the
power sector to households. Given an average growth of 1 bcm/year of gas in the short and mid-run
and little to no growth in the long-run, it is expected that demand in this sector will be no more than 17.5
bcm/year by 2025 and 18.5 bcm/year by 2030. Likewise, industrial sector demand growth will be no
more than 1bcm/year which will largely depend on the GDP and FDI growth, especially in the most gas
intense spheres such as the production and manufacturing industry (chemical and petrochemical
products production, textile, leather and clothing industry, transport vehicle production, organized
industrial zones). The fall in natural gas consumption in the power sector will be balanced by moderate
growth in the residential and industry sectors in 2017 and given the calculations above, we forecast that
Turkey’s gas demand will be no more than 55–56 bcm/year by 2025 and 60–62 bcm/year by 2030
(Figure 9).
Figure 9: Turkey’s gas demand growth projection, 2014-2030
 70                                                                                                                             8.00%

 60                                                                                                                             6.00%
       6.00%
                                                                                                                                4.00%
 50                                                                                         4.63%
                                                                                                                                2.00%
 40                                      2.17% 2.13% 2.08% 2.04% 2.00% 1.96% 1.92% 1.89%            2.65%
                                                                                                            1.72% 1.69% 1.67%   0.00%
 30                     0.65%
                                -0.65%                                                                                          -2.00%
 20
                                                                                                                                -4.00%
 10                                                                                                                             -6.00%
               -5.54%
   0                                                                                                                            -8.00%
       2014 2015 2016 2017 2018 2019 2020 2021 2022 2023 2024 2025 2026 2027 2028 2029 2030

                                    Electricity        industry       residential          others            total

Source: Author’s estimates

The contents of this paper are the author’s sole responsibility. They do not necessarily represent the views of
the Oxford Institute for Energy Studies or any of its Members.                                                                    16
You can also read