Turning points (still) ahead - Poland: 2019 Outlook MACROscope - Santander

Page created by Jeremy Ford
 
CONTINUE READING
Turning points (still) ahead - Poland: 2019 Outlook MACROscope - Santander
MACROscope                     Warsaw, 10 January 2019

Turning points (still) ahead
Poland: 2019 Outlook

Economic Analysis Department
Santander Bank Polska S.A.
ekonomia@santander.pl
+48 (22) 534 1887
Turning points (still) ahead - Poland: 2019 Outlook MACROscope - Santander
Index

 ■      Executive summary                  p. 3
 ■      2018 Forecasts in rearviewmirror   p. 5
 ■      2019 Forecasts and main risks      p. 6
 ■      External environment               p. 7
 ■      Leading indicators                 p. 8
 ■      GDP                                p. 9
 ■      Consumption                        p. 11
 ■      Investment                         p. 14
 ■      Foreign trade                      p. 18
 ■      Labour market                      p. 21
 ■      Inflation                          p. 26
 ■      Monetary policy                    p. 31
 ■      Fiscal policy                      p. 32
 ■      Debt market                        p. 36
 ■      Foreign exchange market            p. 41
 ■      Political update                   p. 48
 ■      Forecasts table                    p. 49

                                                   2
Turning points (still) ahead - Poland: 2019 Outlook MACROscope - Santander
Executive summary (macro)
We see clouds thickening over the global economic outlook, and although we do not expect a major downturn in Europe in 2019, the worsening external
environment will gradually take its toll, further depressing Polish exports and manufacturing (strongly linked with European value chains). The good news is
that domestic investments financed by EU structural funds, which have revived in 2018, are likely to continue providing a counter-balance for faltering
external demand, as according to our estimate the peak of EU funded-spending in the current seven-year framework is still ahead. Private consumption is
likely to remain the strongest growth engine, even though in this area the best days are probably over. As a result, GDP growth in Poland will slow from
around 5% in 2018 to around 4% in 2019, still remaining above potential and among the highest in Europe.
There is no more slack in the Polish labour market – the unemployment rate is at new lows with deepening shortage of workers being the major obstacle for
expanding business in many sectors. The good news is that the inflow of migrant workers has continued, it seems (although visibility in this area is
obscured by lack of reliable data), which still creates some breathing space for entrepreneurs. The bad news: even though domestic participation rate has
been on the rise, the local supply of labour is unlikely to go up further. Meanwhile, if the economy is to expand nearly 4 percent, further job creation is
needed, which means that wage growth is unlikely to moderate.
Despite seemingly perfect environment for an inflation pickup (above-potential growth driven by consumption, tightening labour market, low interest rates,
decent credit growth), price growth has not only remained muted in Poland, but even underperformed most of European markets in 2018. We believe that
part of the answer to this puzzle lies in corporate profits, which have been decent enough to allow companies to absorb costs instead of passing them to
customers. However, such situation cannot last forever and we observe growing evidence of margin compression process being already quite advanced.
Thus, either we see the pass-through from costs to prices accelerating in the coming quarters, or corporate profits deteriorate much more in the
environment of slowing economic activity. We expect to see a gradual increase of the core inflation in 2019, going towards 2.5% by the end of the
year. The headline CPI is likely to follow almost identical path, after the risk of surge in energy costs has been mitigated by the government.
The Polish central bank has been watching the booming economy with cold blood, and probably rightly so, given scarce evidence of economic imbalances
building so far. The core inflation will pick up in 2019, but slowly, so it is hard to imagine the consensus for monetary policy normalisation building
before 2020, especially in the environment of slowing GDP growth.
It seems that excellent performance of the state budget did part of the job in terms of policy-mix adjustment, as it looks very likely that 2018 will end with
almost balanced fiscal position. 2019 budget was planned responsibly, as the room for spending spree was limited by the stabilising expenditure
rule. However, given the election cycle in full swing, it seems more likely that this time the planned deficit will be utilised almost in full, which would imply a
counter-cyclical policy adjustment again. With the deficit way below 3% of GDP and public debt remaining on descending path, the room for some fiscal
expansion is there, if needed in case of deeper economic slowdown.

                                                                                                                                                                 3
Turning points (still) ahead - Poland: 2019 Outlook MACROscope - Santander
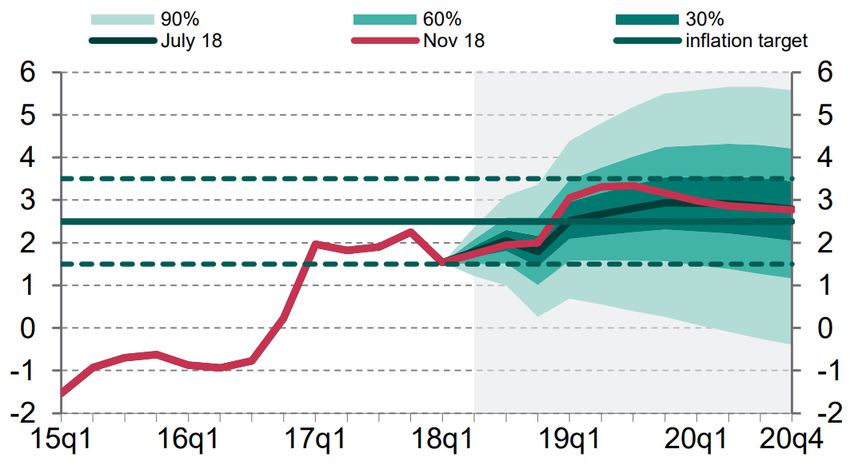
Executive summary (markets)
FX
We expect EUR/PLN to rise above the upper end of the 4.26-4.34 range in 1Q19 and ease to 4.30 at the year-end.
The first months of 2019 could bring some zloty depreciation as the hard data will finally show evidence that the economic slowdown in Poland is actually
happening. Additionally, the materialisation of two Fed rate hikes in 1H19 (currently not priced-in by the market) could be negative for EM assets. The
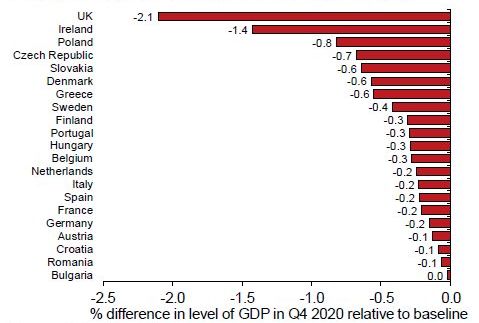
beginning of 2019 might be a tough period for the zloty also amid Brexit uncertainty as the Polish economy is among the most exposed to the no-deal
Brexit. Volatility on the (not only) Polish market is very low and this also makes us cautious as regards the room for stronger zloty in the short term.
"Hard Brexit" is not our base-case scenario and any jump in volatility should be sharp but temporary. Thus, later in the year, the zloty may start benefiting
from the rising EUR/USD, pause in the Fed rate hike cycle and market pricing for an improvement of the situation on the emerging markets after a turbulent
2018. However, the pace of EUR/PLN decline may be slow amid no interest rate hikes in Poland this year, continuation of an economic slowdown and
markets’ uncertainty ahead of the general election planned for autumn.
Our main driver for USD/PLN forecast is the assumption that EUR/USD would rise in 2019. We forecast the economic growth in the US to slow as the
impact of the fiscal stimulus would fade prompting the FOMC to end the rate hike cycle in mid-2019. At the same time, the ECB should be on track to
deliver first hike for years in late 2019.

FI
We assume Polish bond yields will stay low for the better part of 2019, mainly thanks to the CPI running below the NBP target and deceleration of
GDP growth. We could see some (temporary) upside pressure in mid-2019 as the rise of core inflation becomes more evident and due to looming
parliamentary elections. The market could worry that ideas to ease fiscal policy could be at the center of attention during the elections campaign while an
outstanding budget performance in 2018 was one of the key factors pushing yields down. However, we expect the bond weakening to be only temporary as
we do not assume any generous spending to be introduced and as well as we do not expect any interest rate hike in 2019.

                                                                                                                                                           4
Turning points (still) ahead - Poland: 2019 Outlook MACROscope - Santander
2018 Forecasts in rearviewmirror
Indicator                                         Our view - 12 months ago                                                                                 Outcome

                      Growth has already peaked, but should remain solid, near 4%, supported by a very                The economy proved much more resilient than we had ever dreamed, with GDP
GDP                   favourable external environment and accommodative domestic macro policies.                      growth running at c5% y/y for already five quarters in a row. External environment
                                                                                                                      deteriorated quickly, but it was offset by strengthening domestic demand.
                      Consumption is still the main driver of growth, with investments growing                        Consumption confirmed to be the main growth engine and was joined by stronger-
GDP breakdown         moderately, fuelled mainly by local government spending. Net exports close to                   than-expected revival in fixed investments, fuelled by pre-election spending spree in
                      neutral again and inventories slightly negative.                                                local governments. Inventories rose strongly third year in a row.
                      Jobless rate at record low and falling. Labour shortages intensifying across the                As expected, jobless rate fell and labour shortages deepened. However, wage
Labour market         board, slowing employment growth and triggering further acceleration of wage                    growth refused to accelerate much above 7% y/y, possibly due to, among others,
                      pressure, but also a rise in labour participation.                                              continuing inflow of migrant workers and rising labour participation.
                      CPI topping the inflation target mid-year and retreating to c.2% in 2H due to a high            Inflation hugely disappointed once again, remaining below 2% for the better part of
Inflation             base effect. Higher labour costs and above-potential growth fuelling a gradual pick-            the year. Core inflation, instead of accelerating, stayed muted below 1%.
                      up of core inflation towards 2%.
                      Rising inflation and growing wage pressure could deepen the divide in the MPC                   Inflation’s underperformance suppressed hawkish voices in the MPC. Despite the
Monetary policy       and trigger an interest rate hike before year-end, most likely in November 2018.                first motion for a rate hike being filed in November, the broad consensus in the
                                                                                                                      Council supports no changes in monetary policy not only in 2018 but also in 2019.
                      Fiscal budget still under control, even though the scope for further improvement in             Strong economic growth and progress in tax compliance resulting in excellent fiscal
Fiscal policy         tax collection seems limited.                                                                   performance. The year is likely to end with the best fiscal balance on record.

                      The first half of the year will see the rise of short end of the curve, in reaction to rising   Subdued inflation, central bank’s 'wait-and-see' approach and scarce debt supply
Fixed income market   inflation. Long end should go up following core markets, more slowly.                           kept short end of the curve low. Long end more closely followed German Bunds than
                                                                                                                      US Treasuries.
                      Stabilisation of PLN in a narrow range, as improvement of macro fundamentals and                The view was broadly correct, which is reflected in our first rank in Bloomberg’s FX
FX market             political uncertainty has been already priced-in.                                               forecasts comparison. EURPLN was hovering in a narrow band, although at a
                                                                                                                      slightly higher level than we had initially assumed.

                                                                                                                                                                                                   5
2019 Forecasts and main risks
Indicator                                         Our view (in a nutshell)                                                                            Main risks

                      The economic cycle has matured and the coming quarters will see GDP growth               We expect slowing global economy, but no major downturn. If external environment
GDP                   slowing moderately, yet still holding somewhat above potential.                          deteriorates more, it could have negative implications for Polish economy, either
                                                                                                               directly or through our links with EU.
                      Consumption still contributing the most, although slowing gently amid deceleration       Upside: consumption and investment growth may exceed expectations, especially if
GDP breakdown         of real disposable income. Moderate investment growth continues, fuelled largely         the inflow of migrant workers accelerates (triggered by Russia’s next incursion in
                      by public spending on infrastructure. Net exports slightly negative again.               Ukraine, for example). Downside: deeper external shock negative for exports.
                      Polish economy needs to continue creating jobs to grow c4%, so labour shortages          In case of a significant slowdown in net inward migration, Polish companies may
                      likely to persist. Depleted domestic resources make us dependent on migrants flow.       struggle to fill in the resulting vacancies. Fortunately, Germany’s plan to open the
Labour market         Wage growth will remain elevated, but unlikely to accelerate much amid slowing           labour market to non-EU citizens have been postponed until 2020.
                      GDP, corporate profits under pressure, continuing migrants inflow and (later on)
                      introduction of PPK scheme.
                      Once again we expect to see a turning point for inflation as all preconditions for       If inflation could have disappointed once, why cannot it do the same next year? Perhaps
                      higher price growth are in place. Even though the electricity tariff spike will be       there is some piece of the puzzle we are missing? On the other hand, we find it difficult to
Inflation             muted by the government, other factors will be pushing up corporate costs, which         justify why inflation in Poland should be persistently among lowest in Europe, so we feel
                      should finally lift core inflation towards 2.5%, in our view, as the process of margin   that risks for our (cautious) inflation forecast are skewed to the upside. Once firms start
                      compression is already advanced. However, the inflation pickup will be quite slow.       pushing through costs to customers, the scale of rebound may exceed expectations.
                      Monetary Policy Council signalled clearly it would have lots of tolerance for            Speculation about monetary tightening could appear back on the radar should
                      inflation’s deviation from the target, as long as there is no strong evidence of a       inflation pickup prove much stronger, with risk of persistent breach of 2.5% target. In
Monetary policy
                      persistent upward trend in core inflation. It means that 2019 will be another year of    case of deeper economic slowdown and/or another downward inflation surprise the
                      interest rate stabilisation.                                                             MPC will not hurry to cut rates due to worries about impact on small banks’ stability.
                      No risks on the horizon as long as economic growth is solid. Budget draft is based       Major economic downturn and lack of inflation are the biggest threats for fiscal
Fiscal policy         on realistic assumptions and does not allow for spending spree, despite 2019 being       performance, as budget deficit reduction in the last two years was largely cyclical.
                      the election year.
                      The yields of Polish bonds will remain low over most of 2019, mainly owing to the CPI    Yields could go higher if global growth outlook proves more positive than currently priced-in
                      staying below the NBP inflation target and a deceleration of GDP growth, plus the        by the market and thus expectations for faster / more aggressive monetary policy
Fixed income market
                      supply of bonds still being not very high.                                               tightening increase. In the event of much more severe slowdown, long end of the curve
                                                                                                               may be under pressure of growing credit risk.
                      Slowing economic growth and Fed rate hikes would weigh on the zloty in early             "Hard Brexit" could spur risk aversion sending EURPLN higher than we expect. On
FX market             2019. Later, PLN could rebound amid euro strengthening vs dolar, among others.           the other hand, fewer rate hikes in the US might push the exchange below our
                                                                                                                                                                                          6 target.
Euro zone GDP and manufacturing PMI
External environment:                                                           65

                                                                                60
                                                                                                                                                        6.0

                                                                                                                                                        4.0
slowdown, but how deep?                                                         55                                                                      2.0

                                                                                50                                                                      0.0
2018 saw European manufacturing PMIs plummeting after their superb              45                                                                      -2.0
performance in the previous year. But as much as leading indicators’
surge at the end of 2017 was not a good harbinger of the following                                              Euro zone PMI (12m mov.avg., lhs)
                                                                                40                                                                      -4.0
change in economic cycle, their recent collapse must not herald                                                 Euro zone GDP (% y/y)
economic doomsdays ahead. We still think that euro zone domestic                35                                                                      -6.0

                                                                                     Jan 07
                                                                                      Jul 07
                                                                                     Jan 08
                                                                                      Jul 08
                                                                                     Jan 09
                                                                                      Jul 09
                                                                                     Jan 10
                                                                                      Jul 10
                                                                                     Jan 11
                                                                                      Jul 11
                                                                                     Jan 12
                                                                                      Jul 12
                                                                                     Jan 13
                                                                                      Jul 13
                                                                                     Jan 14
                                                                                      Jul 14
                                                                                     Jan 15
                                                                                      Jul 15
                                                                                     Jan 16
                                                                                      Jul 16
                                                                                     Jan 17
                                                                                      Jul 17
                                                                                     Jan 18
                                                                                      Jul 18
demand has strong fundamentals and the GDP growth slowdown in
Europe in 2019 should be only mild. Similar story applies to US
economy, where – despite confidence surveys still being high – tighter
monetary conditions and gradually wearing off effects of fiscal stimulus       Source: Markit, Santander
will lead to slightly slower GDP growth.
That leaves us with global economic growth still strong enough to allow
the main central banks continue / start their monetary policy
normalisation. The US Fed may increase main interest rates twice in
2019, in our view, while ECB should start lifting rates before the end of
2019.
There are, of course, many risk factors to this scenario, including Brexit,
trade tensions escalation, or political instability in Europe.
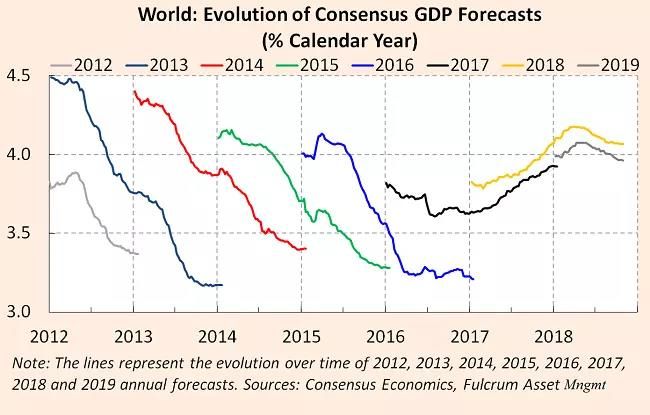
It should be noted that in the last couple of years – barring 2017-18 – the
evolution of global growth forecasts was quite similar: the initial
deterioration of expectations always started very gently, but as the time
went by, the reality check proved to be brutal. The last two years showed
this is not a universal phenomenon, and we do not expect the pattern to
repeat in 2019, but it suggests a risk one should reckon with.

                                                                              Source: FT.com
                                                                                                                                                    7
Leading indicators: mixed evidence
     The leading indicators for Polish manufacturing tell two different stories at the same time, depending where you look at.

     PMI, after declining throughout 2H18, dropped below the breakeven level of 50 pts in November-December. Historically, when quarterly average of PMI sank
     below 50 it was followed by GDP growth slowdown of varying intensity. 2014 was an exception, but PMI spent only three months below 50 pts back then.
     Still, it has to be noticed that in general the PMI is a 'noisy' indicator, signalling too often swings in business sentiment.

     In contrast, European Commission’s ESI and GUS sentiment indicators signalled a "second wind" among businesses in November and December despite
     deteriorating euro zone leading indicators. Yet, it should be remembered that those indicators have been overly optimistic earlier in 2018. GUS also showed
     an acceleration in the value of industrial new orders in late 2018.

     Our take on the diverging signals is that there might be a really gentle, gradual slowdown down the road for the Polish economy.

              GDP growth around periods                                                     Mixed signals from                                               New orders speak against
                of PMI’s sub-50 decline                                                     leading indicators                                                   slowing output
7                                                                                                                                             55                                                                                         25
                                                          4Q98     200             ESI industry, 3M mov. av., standardized                                             GUS value of new orders, %y/y, 3M
                                                                                   PMI, 3M mov. av. standardized                         7                             mov. av.
6                                                                  150                                                                        45
                                                                                   GDP, % y/y (rhs)                                                                    Industrial output, SA, % y/y (rhs)                                20
                                                          3Q00                                                                           6
5                                                                                                                                             35
                                                                   100
                                                                                                                                         5                                                                                               15
                                                          1Q05                                                                                25
4                                                                   50
                                                                                                                                         4                                                                                               10
                                                                                                                                              15
3                                                         2Q08        0
                                                                                                                                         3
                                                                          Jan 12

                                                                                   Jan 13

                                                                                            Jan 14

                                                                                                     Jan 15

                                                                                                              Jan 16

                                                                                                                       Jan 17

                                                                                                                                Jan 18
                                                                                                                                                5
                       quarter with average

                                                                                                                                                                                                                                         5
2                                                                  -50                                                                   2
                                                          2Q12

                                                                                                                                                    Nov 10

                                                                                                                                                              Nov 11

                                                                                                                                                                          Nov 12

                                                                                                                                                                                   Nov 13

                                                                                                                                                                                            Nov 14

                                                                                                                                                                                                     Nov 15

                                                                                                                                                                                                              Nov 16

                                                                                                                                                                                                                       Nov 17

                                                                                                                                                                                                                                Nov 18
                       PMI going
GDP in 2018:                                                                                        Evolution of 2018 GDP forecasts for Poland and Germany
                                                                                                    Bloomberg consensus, Germany (lhs)

defying gravity?                                                           3.6                      Bloomberg consensus, Poland (rhs)
                                                                                                    Santander forecast for Poland (rhs)
                                                                                                                                                                                                                                                                                     5.0

                                                                           3.1                                                                                                                                                                                                       4.5
Polish economy has clearly decoupled from the Western European
world in terms of economic growth in 2018. Whereas most of the             2.6                                                                                                                                                                                                       4.0
European economies experienced a soft patch at the start of 2018,
Poland managed to continue surprising to the upside, with GDP growth
                                                                           2.1                                                                                                                                                                                                       3.5
running at around 5% y/y for already five quarters in a row.
                                                                           1.6                                                                                                                                                                                                       3.0

                                                                                           Nov 17

                                                                                                        Dec 17

                                                                                                                        Jan 18

                                                                                                                                                                        May 18

                                                                                                                                                                                        Jun 18

                                                                                                                                                                                                                                                     Nov 18

                                                                                                                                                                                                                                                                 Dec 18
                                                                                                                                    Feb 18

                                                                                                                                             Mar 18

                                                                                                                                                                                                   Jul 18

                                                                                                                                                                                                             Aug 18

                                                                                                                                                                                                                         Sep 18
                                                                                                                                                        Apr 18
                                                                                 Oct 17

                                                                                                                                                                                                                                         Oct 18
The deterioration of external environment has been counterbalanced by
healthy domestic demand: relatively robust consumption, reviving
investments and build-up of inventories.
                                                                                 Source: Bloomberg, Santander

The positive surprises from domestic economic data and the economy’s
resilience to business climate deterioration abroad triggered systematic
upward revisions of GDP growth forecasts throughout the year, even                                                GDP growth and its selected components (%y/y)
though forecasts for euro zone economies have been trending in the          12
opposite direction since early 2018.                                        10
                                                                             8
                                                                                                                                                                                                                                                              5 x 5%!
                                                                             6
It has been the second straight year when the performance of domestic
economy has clearly surprised us to the upside. Will we be more lucky        4
third time, predicting mild slowdown for 2019? Let’s see…                    2
                                                                             0

                                                                                  1Q09

                                                                                          3Q09

                                                                                                     1Q10

                                                                                                                 3Q10

                                                                                                                             1Q11

                                                                                                                                      3Q11

                                                                                                                                             1Q12

                                                                                                                                                      3Q12

                                                                                                                                                                 1Q13

                                                                                                                                                                                 3Q13

                                                                                                                                                                                            1Q14

                                                                                                                                                                                                    3Q14

                                                                                                                                                                                                            1Q15

                                                                                                                                                                                                                      3Q15

                                                                                                                                                                                                                                  1Q16

                                                                                                                                                                                                                                              3Q16

                                                                                                                                                                                                                                                      1Q17

                                                                                                                                                                                                                                                                3Q17

                                                                                                                                                                                                                                                                              1Q18

                                                                                                                                                                                                                                                                                     3Q18
                                                                            -2
.                                                                           -4
                                                                            -6
                                                                            -8
                                                                           -10
                                                                                                            GDP                                   Private consumption                                                   Fixed investments (rhs)
                                                                             Source: GUS
                                                                                                                                                                                                                                                                          9
GDP in 2019:
still flying high                                                                                   Decomposition of GDP growth in Poland, % y/y
                                                                         10
The five-percent GDP growth will be hard to sustain much longer, given
deteriorating external environment (trade tensions, potential slowdown
in economic growth abroad and in international trade) and building
domestic challenges (deepening labour shortage, already high capacity     8
use, corporate margin compression). However, the pace of expansion
should remain decent in the coming quarters, with the domestic
demand playing the first fiddle.                                          6

The good news is that domestic investments financed by EU structural
funds, which have revived in 2018, are likely to continue providing a     4
counter-balance for faltering external demand, as according to our
estimate the peak of EU funded-spending in the current seven-year
framework is still ahead. Private consumption is likely to remain the
strongest growth engine, even though in this area the best days are       2
probably over.

                                                                          0
In general, the structure of economic growth should closely resemble

                                                                               2000
                                                                                      2001
                                                                                             2002
                                                                                                     2003
                                                                                                            2004
                                                                                                                   2005
                                                                                                                          2006
                                                                                                                                 2007
                                                                                                                                        2008
                                                                                                                                               2009
                                                                                                                                                      2010
                                                                                                                                                             2011
                                                                                                                                                                    2012
                                                                                                                                                                           2013
                                                                                                                                                                                  2014
                                                                                                                                                                                         2015
                                                                                                                                                                                                2016
                                                                                                                                                                                                       2017
                                                                                                                                                                                                              2018
                                                                                                                                                                                                                     2019
                                                                                                                                                                                                                            2020
what we saw in 2017-18, although the pace will be slightly smaller. On
the following pages we present more details about the growth
components.                                                              -2

                                                                         -4
                                                                                                               Individual consumption                          Public consumption
                                                                                                               Fixed Investments                               Inventories
                                                                                                               Net exports                                     GDP

                                                                         Source: GUS, Santander
                                                                                                                                                                                                                     10
Consumption:                                                                  10
                                                                                       Real growth of households' income measures and private consumption

keep calm and carry on                                                         8

                                                                               6
In our view private consumption will remain the backbone of GDP
growth in 2019. Even though the peak of the consumer spending cycle
                                                                               4
is probably behind, growth rate well above 4% y/y should be easy to
maintain given predicted trajectory of labour income and social
subsidies. Employment should keep rising, wage growth in the private           2
sector should remain elevated, and wages in the public sector (already
rising nearly 8% y/y) may even accelerate further, which should prevent        0

                                                                                    1Q01

                                                                                               1Q02

                                                                                                               1Q03

                                                                                                                        1Q04

                                                                                                                               1Q05

                                                                                                                                         1Q06

                                                                                                                                                         1Q07

                                                                                                                                                                    1Q08

                                                                                                                                                                           1Q09

                                                                                                                                                                                    1Q10

                                                                                                                                                                                               1Q11

                                                                                                                                                                                                           1Q12

                                                                                                                                                                                                                   1Q13

                                                                                                                                                                                                                           1Q14

                                                                                                                                                                                                                                     1Q15

                                                                                                                                                                                                                                                     1Q16

                                                                                                                                                                                                                                                              1Q17

                                                                                                                                                                                                                                                                     1Q18

                                                                                                                                                                                                                                                                              1Q19
any material slowdown. On top of it, households’ saving rate might
decline some more as real interest rates are unlikely to rise this year.      -2
                                                                                               Private consumption                                              Wage bill + pension bill + 500+                                             Wage bill + pension bill
                                                                              Source: GUS, Santander
The 500+ child benefit programme played its role in reviving
consumption in 2016-2017, but has already become a drag on total
income growth. The flows to households are already shrinking in y/y                                                        Consumer confidence and private consumption
                                                                              10                                                                                                                                                                                                     10
terms (by 15.7% in 2Q and by 22.9% in 3Q), mainly due to stricter
                                                                                                                                           Consumer sentiment, current assessment index                                                                                              9
verification of beneficiaries and demographic changes (more children            5
reaching age 18 than entering the pool). Also, the payments are not                                                                        Private consumption (rhs)                                                                                                                 8
CPI-linked, so their real value decreases with time.                            0

                                                                                      Jan 05

                                                                                                      Jan 06

                                                                                                                      Jan 07

                                                                                                                                Jan 08

                                                                                                                                                Jan 09

                                                                                                                                                                Jan 10

                                                                                                                                                                           Jan 11

                                                                                                                                                                                      Jan 12

                                                                                                                                                                                                      Jan 13

                                                                                                                                                                                                                  Jan 14

                                                                                                                                                                                                                            Jan 15

                                                                                                                                                                                                                                            Jan 16

                                                                                                                                                                                                                                                            Jan 17

                                                                                                                                                                                                                                                                     Jan 18
                                                                                                                                                                                                                                                                                     7
                                                                               -5
                                                                                                                                                                                                                                                                                     6
Consumer confidence (GUS measure) flattened out in 2018 at record
high levels, higher than in 2017 when private consumption accelerated         -10                                                                                                                                                                                                    5
to 4.9% on average. Electricity bill uncertainty caused a large drop in       -15                                                                                                                                                                                                    4
December, but it might be reversed as this issue is already solved.
                                                                                                                                                                                                                                                                                     3
                                                                              -20
Negative risks to 2019 private consumption are linked to higher cost of                                                                                                                                                                                                              2
                                                                              -25
living. Rise of electricity bill will be covered by the state, but rise of                                                                                                                                                                                                           1
prices of gas, heating and solid fuels plus extra tax on fuel will not. The   -30                                                                                                                                                                                                    0
gradual introduction of Employee Capital Plans (PPK) from mid-2019
on will be denting disposable incomes as well.                                -35                                                                                                                                                                                                    -1
                                                                              Source: GUS, Santander
                                                                                                                                                                                                                                                                     11
Consumption:                                                               50
                                                                                                  Private consumption by categories, %y/y

how durable?                                                               40

                                                                           30
                                                                                                 semi-durable goods, non-durable goods and services                durable goods

Eurostat breakdown of household consumption expenditures shows a           20
35-40% y/y increase of durable goods purchases in the recent quarters
                                                                           10
– a pace that seems hard to maintain much longer – and relative
weakness in the other categories. Consumption of durables is very           0
volatile and its high phase usually occurs late in the cycle.
                                                                           -10

Note also that in 2007-2008 sizeable contribution from durables came       -20

                                                                                  1Q05

                                                                                          1Q06

                                                                                                  1Q07

                                                                                                          1Q08

                                                                                                                 1Q09

                                                                                                                        1Q10

                                                                                                                                1Q11

                                                                                                                                       1Q12

                                                                                                                                              1Q13

                                                                                                                                                     1Q14

                                                                                                                                                            1Q15

                                                                                                                                                                       1Q16

                                                                                                                                                                              1Q17

                                                                                                                                                                                     1Q18
on top of strong performance of other consumption components. This
time the total consumption growth is stable so far, but consumption of
durables is crowding out the remaining categories instead of building on   Source: GUS, Santander
top of their stable pace of growth.                                                                 Structure of private consumption y/y growth
                                                                           10
                                                                                                                           durable goods
What is more, consumer survey showed in 4Q a decline of attitude
towards major purchases with a simultaneous rise of the propensity to       8                                              semi-durable goods, non-durable goods and services
save (an alternative use of household budget surplus).
                                                                                                                           Final consumption expenditure of households
                                                                            6

This suggests a slowdown in 2019 when base effect in durables
consumption starts to weigh. And yet in 2006-2008 a double-digit            4
growth in durables lasted for 10 quarters. What is more, the
deceleration back then was a consequence of the global financial crisis     2
rather than a natural move to another phase of the business cycle. If
this time we assume gradual loss of economic momentum, consumers            0
may be able to smooth the consumption path more than during the
crisis.
                                                                           -2

                                                                                 1Q05

                                                                                         1Q06

                                                                                                 1Q07

                                                                                                         1Q08

                                                                                                                 1Q09

                                                                                                                        1Q10

                                                                                                                                1Q11

                                                                                                                                       1Q12

                                                                                                                                              1Q13

                                                                                                                                                     1Q14

                                                                                                                                                            1Q15

                                                                                                                                                                       1Q16

                                                                                                                                                                              1Q17

                                                                                                                                                                                     1Q18
                                                                           Source: GUS, Santander
                                                                                                                                                                               12
Consumption: limited                                                       12
                                                                                                                                 Loan growth, FX adjusted, % y/y

room for credit boost?                                                     10
                                                                            8
                                                                            6
Theoretically, when real income growth decelerates, the credit boost        4
could help to keep consumption growth afloat. However, in our view
chances for such scenario in current environment are limited.               2
                                                                            0

                                                                                Jan 10

                                                                                                  Jan 11

                                                                                                                        Jan 12

                                                                                                                                          Jan 13

                                                                                                                                                                Jan 14

                                                                                                                                                                                  Jan 15

                                                                                                                                                                                                       Jan 16

                                                                                                                                                                                                                            Jan 17

                                                                                                                                                                                                                                              Jan 18
Consumer loans are already running at a high 9%+ y/y pace, the             -2
strongest in eight years, so what we observe in private consumption is
already supported by credit.                                               -4
                                                                           -6                                       Consumption loans                                                        Loans for individuals
In 3Q senior loan officers’ survey banks reported strong demand for
                                                                           Source: NBP, Santander
financing of durable goods purchases, unlike in the previous periods.
Nevertheless, the index of banks’ expectations for consumer credit
                                                                           14                                                    Consumer credit to GDP, %
demand in 4Q remained relatively low.
                                                                           12
What is more, ESI consumer survey reveals a change of approach
towards saving vs using financial leverage. Compared to the peak of        10
the cycle in 2007, the share of households which are running into debt
decreased from 9% to 2% while the share of those who are putting            8
aside rose from 17% to 35%. However much of this difference between
the shares at the cyclical peaks might come from the rise of disposable     6
income that occurred in the meantime.
                                                                            4
Apart from all this, the economy is already relatively saturated with
                                                                            2                                   Poland                             EU median                               80th percentile of EU countries
consumer loans compared to the rest of Europe, unlike in other loan
categories. The ratio of consumer credit to GDP for Poland is one of the    0
highest in the EU. So, the room for further expansion of consumer

                                                                                Jun 04

                                                                                         Jun 05

                                                                                                           Jun 06

                                                                                                                     Jun 07

                                                                                                                                 Jun 08

                                                                                                                                              Jun 09

                                                                                                                                                       Jun 10

                                                                                                                                                                         Jun 11

                                                                                                                                                                                  Jun 12

                                                                                                                                                                                              Jun 13

                                                                                                                                                                                                                Jun 14

                                                                                                                                                                                                                         Jun 15

                                                                                                                                                                                                                                     Jun 16

                                                                                                                                                                                                                                                  Jun 17

                                                                                                                                                                                                                                                           Jun 18
loans does not seem to be exceptionally large.

                                                                           Source: NBP, Santander
                                                                                                                                                                                                                                              13
Investment growth breakdown by ownership

Investment: driven by                                                        20

                                                                             15

the public sector                                                            10

                                                                              5
In 3Q18 investment grew by almost 10% y/y, posting the highest growth
                                                                              0
rate since early 2015. About 2/3 of the entire investment growth was

                                                                                     1Q13
                                                                                            2Q13
                                                                                                   3Q13
                                                                                                          4Q13
                                                                                                                  1Q14
                                                                                                                         2Q14
                                                                                                                                3Q14
                                                                                                                                       4Q14
                                                                                                                                              1Q15
                                                                                                                                                     2Q15
                                                                                                                                                            3Q15
                                                                                                                                                                   4Q15
                                                                                                                                                                          1Q16
                                                                                                                                                                                 2Q16
                                                                                                                                                                                        3Q16
                                                                                                                                                                                               4Q16
                                                                                                                                                                                                      1Q17
                                                                                                                                                                                                             2Q17
                                                                                                                                                                                                                    3Q17
                                                                                                                                                                                                                           4Q17
                                                                                                                                                                                                                                  1Q18
                                                                                                                                                                                                                                         2Q18
                                                                                                                                                                                                                                                3Q18
achieved by local governments, which were on a pre-election spending          -5
spree. In the first half of the year, investment in other economic sectors
remained in stagnation, but in our view the private sector may have          -10
shown some revival in 3Q18 First, statistics on investment in
                                                                             -15
companies employing 50+ people showed a 15% y/y growth in 3Q18.
                                                                                                     Central governments                                    Local governments                                   Companies
Second, Breakdown of investment by assets showed a rebound in                -20
machinery and equipment (14.3% y/y), which is strongly correlated with                               Households                                             Total economy                                       Big companies
investment in companies.                                                      Source: GUS, Eurostat, Santander

                                                                                                                                                                                 Fixed investment: Actual vs
In our view, public investment will remain strong, driven by projects                Investment rates by sector                                                                            Surveys
started prior to elections (note that we have other two elections coming           (fixed investments in relation to gross value
                                                                             50              added in a given sector)                                              30                                                                                  24
in 2019) and by increasing utilisation of EU funds. We see EU-funded
                                                                             45
investment to peak in 2019, see page 15. Central budget’s investment                                                                                                                                                                                   22
                                                                             40                                                                                    20
plans for 2019 are actually lower than for 2018: PLN32.4bn versus            35
PLN35.4bn of total property spending and EU projects co-financing.           30                                                                                                                                                                        20
However, 2018 realisation is rather low, at PLN14.9bn after October, so      25                                                                                    10
growth in actual numbers is quite probable.                                  20
                                                                                                                                                                                                                                                       18
                                                                             15
                                                                             10                                                                                      0

                                                                                                                                                                            2008
                                                                                                                                                                            2009
                                                                                                                                                                            2010
                                                                                                                                                                            2011
                                                                                                                                                                            2012
                                                                                                                                                                            2013
                                                                                                                                                                            2014
                                                                                                                                                                            2015
                                                                                                                                                                            2016
                                                                                                                                                                            2017
                                                                                                                                                                            2018
                                                                                                                                                                            2019
Even with the probable rebound in 3Q18 in mind, the 2019 outlook for          5                                                                                                                                                                        16
                                                                              0
private investment is not too positive. Some business sentiment                                                                                                    -10

                                                                                   Jan 00
                                                                                   Jan 01
                                                                                   Jan 02
                                                                                   Jan 03
                                                                                   Jan 04
                                                                                   Jan 05
                                                                                   Jan 06
                                                                                   Jan 07
                                                                                   Jan 08
                                                                                   Jan 09
                                                                                   Jan 10
                                                                                   Jan 11
                                                                                   Jan 12
                                                                                   Jan 13
                                                                                   Jan 14
                                                                                   Jan 15
                                                                                   Jan 16
                                                                                   Jan 17
                                                                                   Jan 18
indicators are already going down, investment surveys point either to                                                                                                                                   Fixed investments, % y/y                       14
decline or to just minor growth, firms are witnessing falling margins and                                                                                          -20                                  EC Investment survey
are pointing to persisting institutional uncertainty as an important drag                                                                                                                                                                              12
                                                                                       Total                                    Non-financials                                                          Investment in private
to their expansion plans. Thus, in general we are expecting the 2019                   Financials                               General government                                                      companies, 4Q sum, % y/y
                                                                                                                                                                   -30                                  NBP Quick Monitoring                           10
investment demand to be still driven mostly by the public sector.                      Households                                                                                                       investment survey, rhs

                                                                              Source: GUS, European Commission, NBP, Eurostat, Santander                                                                                           14
Investment: EU spending                                                     250
                                                                                  Utilisation of EU funds: 2008-11 vs 2015-18, PLNbn, signed contracts

                                                                                                                                                                                                                                      63% of budget

to peak in 1H19                                                             200
                                                                                                                         Framework 2007-2013

                                                                                                                         Framework 2014-2020
                                                                            150
Utilisation of EU structural funds from 2014-2020 financial framework
was rising steadily throughout the year, surpassing PLN200bn in the                                                                                                                                                                                                        67% of budget
                                                                            100
middle of the year. Until November, 63% of the total budget for Poland
was contracted as compared to 67% for the 2007-2013 framework in             50
November 2011. At the end of 2017 these ratios amounted to 49% for
2014-2020 framework and 55% for 2007-2013 framework, meaning that             0
some slack was cut in 2018.

                                                                                   Nov 08/15

                                                                                                             Mar 09/16

                                                                                                                                      Jul 09/16

                                                                                                                                                  Sep 09/16

                                                                                                                                                              Nov 09/16

                                                                                                                                                                                      Mar 10/17

                                                                                                                                                                                                              Jul 10/17

                                                                                                                                                                                                                          Sep 10/17

                                                                                                                                                                                                                                       Nov 10/17

                                                                                                                                                                                                                                                               Mar 11/18

                                                                                                                                                                                                                                                                                         Jul 11/18

                                                                                                                                                                                                                                                                                                      Sep 11/18

                                                                                                                                                                                                                                                                                                                  Nov 11/18
                                                                                               Jan 09/16

                                                                                                                          May 09/16

                                                                                                                                                                          Jan 10/17

                                                                                                                                                                                                  May 10/17

                                                                                                                                                                                                                                                   Jan 11/18

                                                                                                                                                                                                                                                                             May 11/18
According to our estimates, EU-financed investments accelerated
markedly throughout 2018. That having said, total utilisation in Jan-Nov
period in 2018 was way lower than in 2017 (PLN48.7bn vs PLN78bn,                  Source: Ministry of Development, Santander
respectively). According to our model, contracts become actual
investment in six-eight quarters, so we estimate the peak of EU-funded                                                    Estimate of EU-funded investments, PLNbn
investment to occur in 4Q18-3Q19 period.                                     25
                                                                                                           EU-funded investment estimate, sa

With EU-funded investments peaking in 2019, their contribution to total      20
                                                                                                           Local government EU-funded investment, actual data
investment growth will amount to about five percentage points, so it will
be similar to contribution in 2018, or even slightly lower. In 2020 the      15                            EU-funded investment estimate, nsa
impact of EU-funded investment on total investment growth rate is likely
to be negative.
                                                                             10

                                                                              5

                                                                              0

                                                                                  Source: Ministry of Development, Ministry of Finance, Santander
                                                                                                                                                                                                                                                                                                     15
Investment: does leasing                                                 80
                                                                                          Other, PLNbn, lhs
                                                                                                            Value of leases in Poland
                                                                                                                                                                               30

tell different story?                                                    70
                                                                         60
                                                                                          Machinery and equipment, PLNbn, lhs                                                  25

                                                                                          Cars and trucks, PLNbn, lhs                                                          20
                                                                         50
The rather moderate recovery of investment in 2018 provoked                               Lease-to-investment, %, rhs
                                                                         40                                                                                                    15
speculations that the Statistics Office understates the investment
numbers. Such worries were even voiced by the NBP president Adam         30
Glapiński, who announced that the central bank would issue an official                                                                                                         10
enquiry on this matter.                                                  20
                                                                                                                                                                               5
                                                                         10

A potential explanation, put forward by market analysts, was that the      0                                                                                                   0
Office does not fully account leases, which are strongly growing in            2007     2008    2009     2010   2011   2012      2013   2014   2015   2016   2017   1-3Q
importance as a source of investment financing. According to Polish                                                                                                 2018
Leasing Association (Związek Polskiego Leasingu, ZPL), total value of    Source: ZPL, GUS, Santander

leases in 2017 amounted to PLN68bn as compared to PLN352bn of
total fixed investment in 2017 (19.3%). In 2012, leasing-to-investment
ratio stood at 9.7%                                                                                    Investment corrected for leases, % y/y
                                                                         35                                                                                                7
                                                                                                           Difference, pp, rhs
We see no reason to doubt the Stat Office’s statistics. However, we      30                                                                                                6
                                                                                                           Investment, official data, % y/y, lhs
decided to make some back-of-the-envelope calculations showing what      25                                                                                                5
would happen with investment if market doubts proved accurate. We                                          Investment, corrected for leasing, % y/y, lhs
assumed that the Statistics Office completely omits leases in            20                                                                                                4
investment data and we added their value by ZPL to arrive at corrected   15                                                                                                3
values and growth rates of investment.                                   10                                                                                                2
                                                                           5                                                                                               1
We estimate that the error of omitting leases would result in
                                                                           0                                                                                               0
understating investment growth rate by about 2 percentage points in

                                                                               1Q05
                                                                               3Q05
                                                                               1Q06
                                                                               3Q06
                                                                               1Q07
                                                                               3Q07
                                                                               1Q08
                                                                               3Q08
                                                                               1Q09
                                                                               3Q09
                                                                               1Q10
                                                                               3Q10
                                                                               1Q11
                                                                               3Q11
                                                                               1Q12
                                                                               3Q12
                                                                               1Q13
                                                                               3Q13
                                                                               1Q14
                                                                               3Q14
                                                                               1Q15
                                                                               3Q15
                                                                               1Q16
                                                                               3Q16
                                                                               1Q17
                                                                               3Q17
                                                                               1Q18
                                                                               3Q18
2017-2018. Note that adjusting investment for leasing does not change     -5                                                                                               -1
the general trend at any point of time.                                  -10                                                                                               -2
                                                                         -15                                                                                               -3

                                                                           Source: ZPL, GUS, Santander                                                              16
FDIs back on track                                                           30
                                                                                                                                   FDI and portfolio investment, PLNbn

                                                                             20

                                                                             10
2017 saw a major slowdown in net FDI. In our last yearly outlook, we
argued that this was a one-off due to one big ticket transaction and
                                                                              0
rebalancing between portfolio and direct investments. Our call proved

                                                                                  Jan 05

                                                                                                  Jan 06

                                                                                                                   Jan 07

                                                                                                                              Jan 08

                                                                                                                                              Jan 09

                                                                                                                                                         Jan 10

                                                                                                                                                                         Jan 11

                                                                                                                                                                                     Jan 12

                                                                                                                                                                                              Jan 13

                                                                                                                                                                                                           Jan 14

                                                                                                                                                                                                                     Jan 15

                                                                                                                                                                                                                              Jan 16

                                                                                                                                                                                                                                       Jan 17

                                                                                                                                                                                                                                                Jan 18
true and 2018 saw investment values return to averages, with October
2018 net 12-month FDIs at €10.6bn. We expect this trend to continue in      -10
2019.
                                                                            -20
                                                                                                                  FDIs into Poland                                                                     FDI from Poland
In 2017, gross inflow of FDI into Poland amounted to €8.1bn, breaking                                             Net FDI, 12m sum                                                                     Net Portfolio Investment, 12m sum
down into +€8.9bn of reinvested profits, -€0.4bn of change in equity and    -30
-€0.4bn change in net debt instruments. Biggest inflow of FDIs came        Source: NBP, Santander
from Germany (€3.0bn), Luxembourg (€2.9bn), Cyprus (€1.3bn) and
Austria (€1.2bn), while major outflows were seen in case of Italy (-                                                                          Gross foreign debt, % of GDP
€2.0bn), Netherlands (-€1.7bn) and France (-€0.9bn). Polish FDIs into
other economies grew by €2.4bn and were directed mostly to Sweden            20                                                                                                               80%
                                                                                                                                                                                                                    Effect of change in nominal
(+€1.7bn) and Luxembourg (+€1.0bn), while investment in Cyprus fell                                                                                                                           75%                   GDP
                                                                             15
by €1.6bn.                                                                                                                                                                                                          Intercompany debt
                                                                                                                                                                                              70%
                                                                             10
                                                                                                                                                                                                                    Other sectors
Poland’s gross external debt fell to 64.5% of GDP in 3Q18, the lowest         5
                                                                                                                                                                                              65%
since 2Q10. In annual terms, debt fell 4.8% of GDP after a decline by                                                                                                                         60%                   Banking sector
8.0% of GDP in 2Q18 (this was the most considerable fall since                0
comparable data have been available, i.e. 2004). This decline was                                                                                                                             55%                   Central bank
achieved primarily thanks to strong GDP growth (over 6.0% y/y in             -5
                                                                                                                                                                                              50%
nominal terms), and only a slight growth of nominal indebtedness, and                                                                                                                                               Government
with falling foreign debt of the government. A further decline in gross     -10                                                                                                               45%
external debt would be welcomed by rating agencies.                                                                                                                                                                 Total debt, annual change
                                                                            -15                                                                                                               40%                   in % of GDP

                                                                                  1Q08

                                                                                           1Q09

                                                                                                           1Q10

                                                                                                                    1Q11

                                                                                                                            1Q12

                                                                                                                                       1Q13

                                                                                                                                                 1Q14

                                                                                                                                                        1Q15

                                                                                                                                                                  1Q16

                                                                                                                                                                              1Q17

                                                                                                                                                                                     1Q18
                                                                                                                                                                                                                    Total debt, % GDP, rhs

                                                                           Source: NBP, Santander
                                                                                                                                                                                                                                       17
Foreign trade: export
unlikely to take off
Polish export growth decelerated visibly in 2018, following a similar
pattern in German and – more broadly – in global trade. The slowdown
was broad-based and affected all major Polish export markets.

The outlook for the coming quarters does not look particularly bright,
given the clouded global growth outlook and persisting trade tensions,
which may negatively affect the international trade turnover. It is
virtually impossible to see a revival in Polish exports without a pickup in
EU (or, more specifically, in Germany). Therefore, we expect Polish
export growth to slow to about 3.0% y/y in 2019 from 5.5% in 2018.

On the flip side, the competitiveness of the Polish exports does not
seem to be significantly undermined. The pace of unit labour costs                         Hourly labour cost, €                  Nominal unit labour cost based on
growth has accelerated in the recent quarters, but remains below the          45                                             15        hours worked (% y/y)
most of the CEE peers. And the gap between costs of labour here and           40                        Non-wage costs
in the developed Europe is still huge.                                                                                                     2018Q2         2018Q2 (4Q avg.)
                                                                              35
                                                                                                        Wages and salaries
                                                                              30                                             10
As regards the exchange rate of the zloty, it has trimmed part of the         25
appreciation recorded in 2017 and does not seem to be overvalued
                                                                              20
(with Real Effective Exchange Rate being only c5% above the trough                                                            5
reached just after the 2008 global economic crisis and 3% below its           15
20Y average). The NBP survey shows that both EURPLN and USDPLN                10
are well above levels, which secure profitability of Polish exports.          5                                               0

                                                                                                                                           Norway
                                                                                                                                            Poland

                                                                                                                                         Denmark

                                                                                                                                            Austria
                                                                                                                                            France
                                                                                                                                              Malta
                                                                                                                                          Portugal

                                                                                                                                            Ireland
                                                                                                                                          Hungary

                                                                                                                                          Slovakia
                                                                                                                                         Slovenia

                                                                                                                                         Lithuania
                                                                                                                                           Croatia
                                                                                                                                               Italy

                                                                                                                                           Cyprus

                                                                                                                                      Netherlands
                                                                                                                                              Spain
                                                                                                                                          Czechia

                                                                                                                                          Sweden

                                                                                                                                           Finland
                                                                                                                                         Romania

                                                                                                                                             Latvia

                                                                                                                                     Luxembourg

                                                                                                                                           Greece
                                                                                                                                           Estonia

                                                                                                                                          Bulgaria

                                                                                                                                  United Kingdom
                                                                                                                                        Germany
                                                                              0

                                                                                        Greece
                                                                                      Denmark

                                                                                        Finland
                                                                                         Ireland

                                                                                      Slovenia

                                                                                       Hungary
                                                                                   Netherlands
                                                                                       Belgium

                                                                                          Latvia
                                                                                       Sweden
                                                                                   Luxembourg

                                                                                              EA
                                                                                            Italy
                                                                                              EU

                                                                                        Cyprus

                                                                                        Estonia

                                                                                      Romania
                                                                                           Spain

                                                                                        Croatia
                                                                                         France
                                                                                      Germany

                                                                                           Malta
                                                                                       Czechia
                                                                                       Slovakia
                                                                                         Poland
                                                                                         Austria

                                                                                              UK

                                                                                       Portugal

                                                                                      Lithuania
                                                                                       Bulgaria
After all, one should remember that historically the strength of external
demand always proved to be much more important for Polish export                                                             -5
performance that the level of exchange rate.
                                                                                    Source: Eurostat                              Source: Eurostat, Santander
                                                                                                                                                                       18
Foreign trade: expansion beyond Europe continues …
                    … but it’s still only a (growing) margin
The EU is still the biggest Polish export market, although the process of geographical diversification continues. However, the non-European markets still
constitute only a relatively narrow margin of Polish trade. Thus, the potential impact of global trade wars on Polish exports would be felt probably mainly
indirectly, through the influence on the German (European) economy.

     Change in value of Polish exports                                        Breakdown of Polish exports, €bn
                2007-2017                                                                                                     220       Latin America
           by country groups                                                                                                  200
                                                                                        11% {                                           Africa
                 0     20          40          60          80                                                                 180
North America                                                                                                                 160       Middle East
     East Asia                                                                                                                140       East Asia
  Middle East
                                                                                                                              120
        Africa                                                                                                                          North America
Latin America                                                    8% {                                                         100
          CEE                                                                                                                 80        CIS
 North Europe                                                                                                                 60        South Europe
South Europe
                                                                                                                              40
           CIS                                                                                                                          CEE
                                                                                                                              20
                 0%     100%             200%             300%
                                                                                                                              0         North Europe
       change in %      change in billions of EUR                            2007                     2017
                            Source: Eurostat, Santander                                             Source: Eurostat, Santander

                                                                                                                                                        19
Foreign trade: still no                                                      25000
                                                                             20000
                                                                                                         Balance of payments (12m moving sums, EURm)

external imbalance                                                           15000
                                                                             10000
                                                                              5000
Trade balance started deteriorating in 2018 as exports slowed while                0

                                                                                       Jan 02

                                                                                                Jan 03

                                                                                                          Jan 04

                                                                                                                      Jan 05

                                                                                                                                Jan 06

                                                                                                                                           Jan 07

                                                                                                                                                       Jan 08

                                                                                                                                                                   Jan 09

                                                                                                                                                                                Jan 10

                                                                                                                                                                                             Jan 11

                                                                                                                                                                                                           Jan 12

                                                                                                                                                                                                                             Jan 13

                                                                                                                                                                                                                                               Jan 14

                                                                                                                                                                                                                                                                 Jan 15

                                                                                                                                                                                                                                                                                   Jan 16

                                                                                                                                                                                                                                                                                                 Jan 17

                                                                                                                                                                                                                                                                                                               Jan 18
imports remained supported by strong domestic demand. However,                -5000
surplus in services keeps soaring (as Poland attracts more and more          -10000
business services due to its cost competitiveness, among other
                                                                             -15000
factors), while the widening of negative income balance slowed clearly.
As a result, current account balance is still close to zero.                 -20000
                                                                             -25000
C/A deficit may widen in 2019, but mildly, remaining near 1% of GDP.                                               Current account                                                                                  Goods
Bigger gap in trade of goods should be largely offset by rising surplus in                                         Services                                                                                         Income (primary+secondary)
services, while income balance should not deteriorate much, given             Source: NBP, Santander
lower financial results of companies and resulting lower dividend
payments.
                                                                              10%                                               Net lending / borrowing (% of GDP)
Moreover, the proper measure of Poland’s external imbalance is not the
current account gap alone, but the sum of the current and the capital
accounts (the latter reflects the inflow of capital transfers from EU).         5%
Those two taken together correspond to total economy’s net lending/
borrowing position, which is currently in surplus at near 1.5% of GDP
and should remain positive in 2019, given likely acceleration of EU
transfers inflow.                                                               0%

                                                                                       2000Q1

                                                                                                2001Q1

                                                                                                          2002Q1

                                                                                                                     2003Q1

                                                                                                                               2004Q1

                                                                                                                                         2005Q1

                                                                                                                                                    2006Q1

                                                                                                                                                                2007Q1

                                                                                                                                                                            2008Q1

                                                                                                                                                                                         2009Q1

                                                                                                                                                                                                      2010Q1

                                                                                                                                                                                                                    2011Q1

                                                                                                                                                                                                                                      2012Q1

                                                                                                                                                                                                                                                        2013Q1

                                                                                                                                                                                                                                                                          2014Q1

                                                                                                                                                                                                                                                                                        2015Q1

                                                                                                                                                                                                                                                                                                      2016Q1

                                                                                                                                                                                                                                                                                                                   2017Q1

                                                                                                                                                                                                                                                                                                                            2018Q1
Also, the analysis of sectoral net lending/borrowing positions does not
seem to herald major risks for external imbalance. The impressive fiscal       -5%
consolidation will probably not continue, but unless we see a major
revival in households’ consumption or corporate investments (which is
                                                                                                                               Total economy                                                                                    Non-financial corporations
not our base case scenario), the overall net external position of the
                                                                              -10%                                             Financial corporations                                                                           General government
economy should remain in surplus.
                                                                                                                               Households
                                                                              Source: Eurostat, Santander
                                                                                                                                                                                                                                                                                                          20
Working age population (15-59/64)
Labour market:                                                                      26000
                                                                                    25500

demographics bites                                                                  25000
                                                                                    24500
                                                                                    24000                                                                                                                                                                                                                               -3m
In the last ten years the working age population in Poland has
decreased by c.3 million, according to the Labour Force Survey. And                 23500
yet it did not prevent the economy from growing rapidly. The number of              23000
jobs rose in the last decade by almost 2.5m, as there were still
available reserves to use: the number of unemployed fell sharply by                 22500
                                                                                                                                                                                                                                                                                              -500k
over 2m (jobless rate down to 3.8%, one of the lowest in EU), and the               22000
participation rate increased, lifting the number of active persons by over

                                                                                              2000Q1
                                                                                                         2001Q1
                                                                                                                   2002Q1
                                                                                                                            2003Q1
                                                                                                                                      2004Q1
                                                                                                                                                 2005Q1
                                                                                                                                                            2006Q1
                                                                                                                                                                        2007Q1
                                                                                                                                                                                     2008Q1
                                                                                                                                                                                                   2009Q1
                                                                                                                                                                                                                     2010Q1
                                                                                                                                                                                                                                   2011Q1
                                                                                                                                                                                                                                                2012Q1
                                                                                                                                                                                                                                                            2013Q1
                                                                                                                                                                                                                                                                       2014Q1
                                                                                                                                                                                                                                                                                  2015Q1
                                                                                                                                                                                                                                                                                            2016Q1
                                                                                                                                                                                                                                                                                                     2017Q1
                                                                                                                                                                                                                                                                                                               2018Q1
                                                                                                                                                                                                                                                                                                                          2019Q1
                                                                                                                                                                                                                                                                                                                                   2020Q1
380k in the last decade.

However, we are arriving at the point where those domestic reserves           Source: Eurostat, Santander
are close to run out: (1) Even with participation rate still on the rise in
the recent quarters, active population already started shrinking due to
ageing. (2) We see evidence of upward trend in participation rate                                                                                         Labour market participation
stalling in most of age groups in the last year, probably at least partly            17,700                                                                                                                                                                                                                                           58%
due to reduction of retirement age in October 2017 and introduction of
500+ family subsidy. (3) If we assume participation rates across age                 17,500                                                                                                                                                                                                                                           57%
groups stabilising at recent highs or even rising slightly, the total                17,300                                                                                                                                                                                                                                           56%
participation rate and the total number of active persons will drop in the
coming years, according to our estimates, because of population                      17,100                                                                                                                                                                                                                                           55%
ageing, i.e. large cohorts moving to much less active groups – unless
                                                                                     16,900                                                                                                                                                                                                -350k                                      54%
participation rates in those age groups increase sharply.
                                                                                     16,700                                                                                                                                                                                                                                           53%
With unemployment already at record low level, this leaves little room               16,500                                                                                                                                                                                                                                           52%
for employment growth in the coming years, at least if we take into

                                                                                                2000Q1
                                                                                                          2001Q1
                                                                                                                   2002Q1
                                                                                                                            2003Q1
                                                                                                                                     2004Q1
                                                                                                                                               2005Q1
                                                                                                                                                          2006Q1
                                                                                                                                                                     2007Q1
                                                                                                                                                                                 2008Q1
                                                                                                                                                                                              2009Q1
                                                                                                                                                                                                            2010Q1
                                                                                                                                                                                                                          2011Q1
                                                                                                                                                                                                                                       2012Q1
                                                                                                                                                                                                                                                   2013Q1
                                                                                                                                                                                                                                                              2014Q1
                                                                                                                                                                                                                                                                         2015Q1
                                                                                                                                                                                                                                                                                   2016Q1
                                                                                                                                                                                                                                                                                            2017Q1
                                                                                                                                                                                                                                                                                                     2018Q1
                                                                                                                                                                                                                                                                                                              2019Q1
                                                                                                                                                                                                                                                                                                                        2020Q1
account the domestic labour force. We forecast the number of labour
market participants to drop to 16.8m by the end of 2020, which is only
1.6% above the current level of employment. That makes Polish
economy increasingly dependent on inflow of migrant workers.                                                                                              Active persons                                                            Participation rate
                                                                              Source: Eurostat, Santander
                                                                                                                                                                                                                                                                                                               21
Number of pensioners
Earlier retirement did not                                                     6500
                                                                               6450             Actual number

hit the labour market                                                          6400
                                                                               6350
                                                                                                In scenario of further gradual rise in retirement age

                                                                               6300
Since the start of 2013, the retirement age had been going gradually up                                                                                         300 thousand
                                                                               6250
to 67. This decision has had a positive impact on labour market
                                                                               6200
participation – while total population activity rate rose by less than one
percentage point in 2012-16, activity of men aged 65-69 rose by 2.5 pp         6150
and activity of women aged 60-64 rose by more than 6.0 pp.                     6100
                                                                               6050
Since 1 October 2017, the retirement age was diverted from its upward          6000
path back to 65 for men and 60 for women. As we have claimed on                       Jan Mar May Jul Sep Nov Jan Mar May Jul Sep Nov Jan Mar May Jul Sep
numerous occasions, we assess this decision as detrimental for the                     16 16 16 16 16 16 17 17 17 17 17 17 18 18 18 18 18
long-term growth potential of Polish economy. Our analysis shows that           Source: ZUS, Santander
almost all eligible people took advantage of the new law, and this did
have some negative yet not overly strong effect on employment in the
                                                                                                                              Employment in older cohorts
oldest cohorts.
                                                                               450                                                                                                      30
                                                                                             Men 65-69, employment, k, lhs
                                                                               400                                                                                                      28
According to our estimates, In October 2018, the number of pensioners                        Women 60-64, employment, k, lhs
was by 300k higher than in counterfactual scenario of continuation of          350           Men 65-69, activity rate, %, rhs                                                           26
the previous policy. Total number of old-age pensioners rose by 350k,                        Women 60-64, activity rate, %, rhs                                                         24
                                                                               300
but lowering of retirement age caused a reduction in the number of
                                                                                                                                                                                        22
disability pensioners, so the final number is lower. Still, this figure will   250

                                                                                                   gradual rise of ret. age
be growing in the years to come and is likely to surpass 500k in 2020 or                                                                                                                20

                                                                                                                                                            Lower retirement age
2021. In fiscal terms, we estimate total costs of higher pensions at           200
                                                                                                                                                                                        18
PLN7.0bn in 2019.                                                              150
                                                                                                                                                                                        16
                                                                               100                                                                                                      14
As regards effect on employment: it was not particularly strong. We
estimate that the decision decreased the 2Q18 employment of women               50                                                                                                      12
in the 60-64 age cohort and men in the 65-69 age cohort by 70k in total          0                                                                                                      10
(vs current employment in these groups at 500k).                                  2012Q1 2012Q4 2013Q3 2014Q2 2015Q1 2015Q4 2016Q3 2017Q2 2018Q1
                                                                                 Source: Eurostat, Santander
                                                                                                                                                                                   22
Labour market: immigrants keep coming, it seems
In the last 2-3 years the inflow of migrant workers (mainly from Ukraine)                    Declarations of hiring a non-resident                                                            Number of work permits
supported greatly the labour supply in Poland. Unfortunately it is hard to                   12M sum (k)
track the inflow due to lack of reliable and precise data. Companies’         70                      Belarus     Change of regulations                                 2000        10
                                                                                                                                                                                                          Bangladesh
declarations to hire a non-resident suggested a switch to negative trend                              Russia                                                            1800         9
                                                                              60                                                                                                                          Belarus
in 2018, but it coincided with a change of regulations. The number of                                 Moldova                                                           1600         8
                                                                              50                      Georgia                                                                                             India
foreigners contributing to Polish social security shows that positive trend                                                                                             1400
                                                                                                                                                                                     7
                                                                                                      Armenia                                                           1200                              Moldova
is still in place, and so do the reports from border guards about border      40                                                                                                     6
                                                                                                      Ukraine (rhs)                                                     1000                              Nepal
crossings with Ukraine (but only if we extract the high-frequency             30                                                                                                     5
                                                                                                                                                                        800
crossings, which distort the picture). Unfortunately, none of these data
                                                                              20                                                                                        600          4
give a full picture and all of them are flawed to some extent: declarations                                                                                             400
to hire a foreigner do not translate one-to-one to actual employment and      10                                                                                                     3
                                                                                                                                                                        200          2
were affected by the change of regulations this year. Numbers on               0                                                                                        0
immigrants paying social insurance contributions are delayed and only                                                                                                                1

                                                                                    Jun 14

                                                                                                        Jun 15

                                                                                                                           Jun 16

                                                                                                                                             Jun 17

                                                                                                                                                               Jun 18
                                                                                             Dec 14

                                                                                                                  Dec 15

                                                                                                                                    Dec 16

                                                                                                                                                      Dec 17
cover those holding a contract (probably not even a half of the total                                                                                                                0
number). Border crossings will not discriminate between Ukrainians                                                                                                                          1H16           2H16           1H17           2H17              1H18
bound for Poland and e.g. Germany, nor between potential workers and          Source: GUS, Santander                                                                                Source: GUS, Santander
tourists. However, all signals taken together seem to suggest, in our
                                                                                   Number of foreigners paying contributions                                                    Number of crossings of the Ukrainian border,
view, that migrants keep coming to work in Poland in big numbers (and
                                                                                   to Polish Social Security (k)                                                                to Poland, by foreigners, 4Q sum (mn)
for now we find little reason for this trend to stop in 2019). This may be
the missing piece of puzzle explaining why the corporate wage growth               450                                                                                         12
failed to accelerate above 7% y/y in recent quarters.                              400                           Ukrainians
                                                                                   350                                                                                         10
German plans to ease immigration rules to attract non-EU jobseekers is             300
a risk factor for the inflow of foreign workers to Poland. However the                                           Others                                                         8
                                                                                   250
government proposed to introduce changes only in 2020 and not 2019
                                                                                   200                                                                                          6
as initially suggested. Furthermore, they are targeting selected skilled
workers, so it need not imply a massive outflow from Poland. Yet, the              150
                                                                                                                                                                                4
risk is that, with time, it will drain the local labour supply somehow.            100                                                                                                                            total
                                                                                     50                                                                                         2                                 ex high-frequency crossings
Meanwhile, in Poland works on the government’s proposal to ease                          0                                                                                                                        high-frequency crossings
immigration rules have stalled (they included extending the life span of                                                                                                        0

                                                                                             Mar 12
                                                                                             Sep 12
                                                                                             Mar 13
                                                                                             Sep 13
                                                                                             Mar 14
                                                                                             Sep 14
                                                                                             Mar 15
                                                                                             Sep 15
                                                                                             Mar 16
                                                                                             Sep 16
                                                                                             Mar 17
                                                                                             Sep 17
                                                                                             Mar 18
                                                                                             Sep 18
declarations to hire, the list of eligible countries, making it easier to

                                                                                                                                                                                     1Q13
                                                                                                                                                                                            3Q13
                                                                                                                                                                                                   1Q14
                                                                                                                                                                                                          3Q14
                                                                                                                                                                                                                 1Q15
                                                                                                                                                                                                                        3Q15
                                                                                                                                                                                                                               1Q16
                                                                                                                                                                                                                                      3Q16
                                                                                                                                                                                                                                             1Q17
                                                                                                                                                                                                                                                    3Q17
                                                                                                                                                                                                                                                            1Q18
                                                                                                                                                                                                                                                                   3Q18
legalize work and bringing one’s spouse to Poland).
                                                                                   Source: ZUS, Santander                                                                           Source: Straż Graniczna, Santander
                                                                                                                                                                                                                                                23
Labour market:                                                            80
                                                                                                               Labour demand and vacancies, % y/y

uncovered labour demand
                                                                                              Newly created jobs, %y/y
                                                                          60                  Vacancies among newly created jobs

                                                                          40                  Vacancies at the end of the quarter
In 3Q vacancies kept growing at a high pace (c20% y/y). Employers
failed to fill 21.5% of newly created jobs – this is the second highest
share of the last decade (after 25.3% in 2Q18). The growth rate of new    20
jobs was still limited (4.3% y/y), compared to 14.4% in 1Q18 and 19.5%
in 4Q17. At the same time the pace of job destruction accelerated          0
visibly (to 30.2% y/y). This most likely means that the labour market

                                                                                1Q10
                                                                                2Q10
                                                                                3Q10
                                                                                4Q10
                                                                                1Q11
                                                                                2Q11
                                                                                3Q11
                                                                                4Q11
                                                                                1Q12
                                                                                2Q12
                                                                                3Q12
                                                                                4Q12
                                                                                1Q13
                                                                                2Q13
                                                                                3Q13
                                                                                4Q13
                                                                                1Q14
                                                                                2Q14
                                                                                3Q14
                                                                                4Q14
                                                                                1Q15
                                                                                2Q15
                                                                                3Q15
                                                                                4Q15
                                                                                1Q16
                                                                                2Q16
                                                                                3Q16
                                                                                4Q16
                                                                                1Q17
                                                                                2Q17
                                                                                3Q17
                                                                                4Q17
                                                                                1Q18
                                                                                2Q18
                                                                                3Q18
remains very tight, judging e.g., by the historically high pool of
unsatiated labour demand, and the wage pressure is pushing the labour     -20
force to jobs where it is more efficiently utilised.
                                                                          -40
                                                                          Source: GUS, Santander
Sentiment indicators show a rebound of employment indices in 4Q18,
surprisingly joint with a correction in super-low unemployment                           ESI employment indices and consumer unemployment fears
expectations of consumers. We treat the ESI indices as a proxy of
                                                                          -20                      Consumers: unemployment expectations (lhs, inverted)                                                        12
labour demand by various sectors. The behaviour of the indices is
generally in line with what we expect for 2019: slower descent of the                              Industry, employment expectations
                                                                          -15                                                                                                                                  9
unemployment rate, and continued high labour demand clashing with                                  Construction
                                                                          -10                                                                                                                                  6
limited supply, keeping wage pressure alive.                                                       Services
                                                                           -5                      Retail trade                                                                                                3

With economic growth most likely still above potential next year, it is     0                                                                                                                                  0
hard to argue that labour demand will fade. The less bright outlook         5                                                                                                                                  -3
does call for its moderation, though. There should also be focus on
raising productivity instead of expansion by raising staff levels.         10                                                                                                                                  -6
                                                                           15                                                                                                                                  -9
                                                                           20                                                                                                                                  -12

                                                                                Nov 15

                                                                                                      May 16

                                                                                                                Aug 16

                                                                                                                         Nov 16

                                                                                                                                           May 17

                                                                                                                                                    Aug 17

                                                                                                                                                             Nov 17

                                                                                                                                                                               May 18

                                                                                                                                                                                        Aug 18

                                                                                                                                                                                                      Nov 18
                                                                                          Feb 16

                                                                                                                                  Feb 17

                                                                                                                                                                      Feb 18
                                                                          Source: European Commission, Santander
                                                                                                                                                                                                 24
Labour market: wage                                                            60

                                                                               50
                                                                                                                  Share of enterprises constrained by shortage of labour
                                                                                                                                                                                    Industry (total)

growth unlikely to slow                                                        40
                                                                                                                                                                                    Industry (skilled labour)
                                                                                                                                                                                    Retail trade (total)
                                                                                                                                                                                    Construction (skilled labour)
                                                                               30
2018 did not go as we imagined as far as wage growth is concerned.
The pressure was certainly there, with all business sectors reporting
                                                                               20
historically high difficulties in finding new workers. The pool of available
potential employees was systematically shrinking, as the
unemployment rate set one new record low after another. But somehow            10
the wage growth in the enterprise sector (a narrow measure, but the
only one that can be tracked on a monthly basis) could not climb                0

                                                                                     4Q04

                                                                                                    4Q05

                                                                                                                  4Q06

                                                                                                                                4Q07

                                                                                                                                              4Q08

                                                                                                                                                            4Q09

                                                                                                                                                                           4Q10

                                                                                                                                                                                           4Q11

                                                                                                                                                                                                       4Q12

                                                                                                                                                                                                                     4Q13

                                                                                                                                                                                                                                  4Q14

                                                                                                                                                                                                                                                 4Q15

                                                                                                                                                                                                                                                                4Q16

                                                                                                                                                                                                                                                                              4Q17

                                                                                                                                                                                                                                                                                            4Q18
significantly above 7% y/y in nominal terms.

However, the 3Q readings of other wage statistics: economy-wide                 Source: European Commission, Santander
measure and growth rate of compensation in the budget sector (both                                                                                            Wage growth, %y/y
coming on a quarterly basis), raise the probability that 7% is not a           16
ceiling that cannot be crossed. Both these measures went above the
corporate wage growth, reaching almost 8% in 3Q2018.                           14
                                                                                                                                                                                                                            Corporate sector
                                                                               12
                                                                                                                                                                                                                            Budget sector
The public sector has finally caught up with corporates, and the 3Q            10
print does not look like the top, with several work groups already                                                                                                                                                          Total
securing pay rises in 2019 (policemen, soldiers among others).                  8
Lawmakers may be under further pressure to hike wages in the budget             6
sector during the year, by groups counting on their generosity ahead of
elections (like teachers, unsatisified with the already granted wage            4
hikes).
                                                                                2

                                                                                0
We believe that in 2019 wage growth in the national economy can stay

                                                                                    1Q05
                                                                                            3Q05
                                                                                                   1Q06
                                                                                                           3Q06
                                                                                                                  1Q07
                                                                                                                         3Q07
                                                                                                                                1Q08
                                                                                                                                       3Q08
                                                                                                                                              1Q09
                                                                                                                                                     3Q09
                                                                                                                                                             1Q10
                                                                                                                                                                    3Q10
                                                                                                                                                                             1Q11
                                                                                                                                                                                    3Q11
                                                                                                                                                                                             1Q12
                                                                                                                                                                                                    3Q12
                                                                                                                                                                                                           1Q13
                                                                                                                                                                                                                  3Q13
                                                                                                                                                                                                                         1Q14
                                                                                                                                                                                                                                3Q14
                                                                                                                                                                                                                                         1Q15
                                                                                                                                                                                                                                                3Q15
                                                                                                                                                                                                                                                        1Q16
                                                                                                                                                                                                                                                               3Q16
                                                                                                                                                                                                                                                                       1Q17
                                                                                                                                                                                                                                                                              3Q17
                                                                                                                                                                                                                                                                                     1Q18
                                                                                                                                                                                                                                                                                            3Q18
close to 7% y/y we estimate for 2018, but it is more likely it will
accelerate some more rather than slow down this year.
                                                                                Source: ZUS, Santander
                                                                                                                                                                                                                                                                       25
Economic growth and inflation in the EU

Inflation: so low for                                                                                       6

                                                                            Final demand deflator, % y/y,
                                                                                                            5

so long                                                                                                     4
                                                                                                                                                                                     Poland
                                                                                                            3

                                                                                       2018
Closed output gap, strong consumption demand, rising wage pressure
(salaries growing faster than productivity) and other costs mounting –                                      2
all those factors have been justifying higher inflationary pressure for
some time. Meanwhile, core inflation in Poland not only refused to                                          1
climb, but even underperformed the corresponding measures in other
                                                                                                            0
European countries.
                                                                                                                 0             1               2             3             4             5               6
                                                                                                            -1
                                                                                                                                              Economic growth, % y/y, 2018
Strong international competition and very good financial results of
                                                                                     Source: European Commission, Santander. Note: the chart omits two outliers: UK and Ireland
companies (they could have afforded squeezing margins without
passing costs onto customers) could be responsible for lack of price
acceleration; plus, some one-off effects (price drop in insurance sector                                             2018 economic growth and final demand deflator components
and financial services).                                                                                                                compared to EU-28

Poland’s inflation is very low in comparison to other countries with                                                         GDP
similar economic growth rates, both in EU and in the world. To put it
differently: Polish GDP growth in 2018 is higher than in 26 of EU-28                           Final demand deflator
countries, but the final demand deflator is higher than in 10 of them. If                                                    Neer

                                                                                                                                                                                                     deflator components
                                                                                                                                                                                                     Final demand
we decompose the deflator into impacts of nominal effective exchange
rate, indirect taxes, import prices, nominal unit labour costs and gross                                                   Taxes
operating surplus, it becomes pretty obvious that contribution of gross
operating surplus is among the lowest in the EU-28 (only three                                                       Import prices
countries rank lower). This means that inflation is low mostly due to the
fact that companies accept lower margins.                                                                                    Nulc

                                                                                                                             GOS

                                                                                                                                     0          5          10          15         20          25                  30
                                                                                                                                     Number of countries that recorded lower values than Poland in 2018
                                                                                     Source: European Commission, Santander
                                                                                                                                                                                                   26
Margins in 50+ companies – breakdown of changes

Corporate margins:                                                            2.0                                                     5.5      Other costs

further compression?

                                                                                                                                                                           change in margin
                                                                                                                                                                           Components of annual
                                                                                                                                               Social contributions
                                                                              1.5                                                     5.0
                                                                                                                                               Taxes
                                                                              1.0                                                     4.5
                                                                                                                                               Depletion
In our view, development of corporate margins is able to explain the
behaviour of prices and wages in the Polish economy. In our Economic          0.5                                                     4.0      Services
Comment released in June 2018, we argued that improving financial
                                                                              0.0                                                     3.5      Energy
results of Polish companies made it possible to accommodate high
wage growth without pressure on prices. We also claimed that                          4Q12 4Q13 4Q14 4Q15 4Q16 4Q17 4Q18 4Q19
                                                                                                                                               Wages
deterioration of profits in 2018 will not be strong enough to make            -0.5                                                    3.0
                                                                                                                                               Raw materials
companies hike prices.
                                                                              -1.0                                                    2.5
                                                                                                                                               Annual change in margin, pp, lhs

In 2019, this situation may change, as margins will be further under          -1.5                                                    2.0      Margin, %, rhs
pressure of rising wages, energy prices (most notably gas, as electricity       Source: GUS, Santander
prices are not likely to go up), materials and the introduction of PPK. At
the same time, revenues will grow slower than in 2018 due to a weaker                                    Corporate margins – different measures
economic growth. In our view, this will bring margins close to the lows
seen in 2012 and might eventually encourage some companies to raise             58.5                                                                                                      6.5
prices.                                                                         58.0                                                                                                      6.0
                                                                                57.5                                                                                                      5.5
Here we use gross financial results as % of revenues in companies               57.0                                                                                                      5.0
employing 50+ as our proxy of corporate margins. If we extend this
                                                                                56.5                                                                                                      4.5
metric also to companies employing 10-49, the story does not change.
We prefer the 50+ statistics, as it is distributed quarterly, while the 10-     56.0                                                                                                      4.0
49 data are released twice a year. We also have another measure:                55.5                                                                                                      3.5
gross operating surplus as % of gross value added, which should be
capturing the whole economy. Interestingly, this measure is going down          55.0                                                                                                      3.0
since early 2016. There are some differences in the methodology (like
the accounting of fixed assets depletion), but in our view this may
suggest that small companies are way worse off than the big ones.
                                                                                                   GOS/GVA, %, lhs        Margins in 50+ companies, 4Q ma, %, rhs

                                                                                     Source: GUS, Santander
                                                                                                                                                                      27
Electricity prices: wholesale vs households’ prices
Inflation: no energy price                                                 300
                                                                           275
                                                                                                TGE electricity forward, PLN/MWh, lhs
                                                                                                                                                     130
                                                                                                                                                     125

hike before elections                                                      250
                                                                           225
                                                                                                CPI Electricity, 2015=100, rhs                       120
                                                                                                                                                     115
                                                                                                                                                     110
Costs of energy production went up significantly in the recent months,     200
                                                                                                                                                     105
mainly due to higher prices of coal and CO2 emission permits. This         175
could have added as much as 1.0 pp to CPI in case of no government                                                                                   100
reaction. It seems that the government will limit the transmission of      150                                                                       95
higher wholesale energy prices to the economy to almost zero.              125                                                                       90
                                                                           100                                                                       85
After a long period of uncertainty, the government enacted a bill,

                                                                                 Jan 10

                                                                                 Jan 11

                                                                                 Jan 12

                                                                                 Jan 13

                                                                                 Jan 14

                                                                                 Jan 15

                                                                                 Jan 16

                                                                                 Jan 17

                                                                                 Jan 18
                                                                                 May 10
                                                                                 Sep 10

                                                                                 May 11
                                                                                 Sep 11

                                                                                 May 12
                                                                                 Sep 12

                                                                                 May 13
                                                                                 Sep 13

                                                                                 May 14
                                                                                 Sep 14

                                                                                 May 15
                                                                                 Sep 15

                                                                                 May 16
                                                                                 Sep 16

                                                                                 May 17
                                                                                 Sep 17

                                                                                 May 18
                                                                                 Sep 18
earmarking PLN9.0bn to halt the electric energy price hikes. The act
assumes lowering the excise duty to PLN 5 per MWh from PLN 20 per
MWh (cost of PLN1.85bn) and the so-called transitory charge by 95%          Source: TGE, GUS, Santander
(this charge varies among energy consumers, cost of PLN2.24bn) as
well as introducing subsidies for the energy sector (PLN5.0bn).                                 Gas prices: wholesale vs households’ prices
Subsidies will be financed via a special fund, supplied with means from
sales of undistributed CO2 permits from 2013-2017 period.                  150                                                                       120
                                                                                                ICE gas forward, 2015=100, lhs
                                                                           140                  TGE gas forward, 2015=100, lhs                       115
The regulations should imply there will be no major impact of higher       130                  CPI gas, 2015=100, rhs
electricity prices on the economy. However, some impact on CPI prints                                                                                110
                                                                           120
(especially flash releases for Jan-Feb) could be still visible, as some                                                                              105
                                                                           110
energy companies have already sent out new increased tariffs to
customers. Additionally, there is still some risk that the European        100                                                                       100
Commission may question the subsidies for the energy sector – it has        90
already asked for the government notification.                                                                                                       95
                                                                            80
                                                                            70                                                                       90
That having said, there is more in store than just higher electricity
                                                                            60                                                                       85
tariffs. We also saw upward tendencies in gas, heating, solid fuels and

                                                                                 Jan 10

                                                                                 Jan 11

                                                                                 Jan 12

                                                                                 Jan 13

                                                                                 Jan 14

                                                                                 Jan 15

                                                                                 Jan 16

                                                                                 Jan 17

                                                                                 Jan 18
                                                                                 May 10
                                                                                 Sep 10

                                                                                 May 11
                                                                                 Sep 11

                                                                                 May 12
                                                                                 Sep 12

                                                                                 May 13
                                                                                 Sep 13

                                                                                 May 14
                                                                                 Sep 14

                                                                                 May 15
                                                                                 Sep 15

                                                                                 May 16
                                                                                 Sep 16

                                                                                 May 17
                                                                                 Sep 17

                                                                                 May 18
                                                                                 Sep 18
there is an additional tax on fuel starting from 2019. Thus, in our view
energy will be a moderately positive contributor to inflation.
                                                                             Source: TGE, Bloomberg, GUS, Santander
                                                                                                                                                28
You can also read