U.S.-Canada Cross-Border Petroleum Trade
←
→
Page content transcription
If your browser does not render page correctly, please read the page content below
U.S.-Canada Cross-
                               Border Petroleum
                               Trade:
                               An Assessment of Energy
                               Security and Economic
                               Benefits

                               March 2021

Submitted to:
American Petroleum Institute
200 Massachusetts Ave NW
Suite 1100,
Washington, DC 20001

Submitted by:
Kevin DeCorla-Souza
ICF Resources L.L.C.
9300 Lee Hwy
Fairfax, VA 22031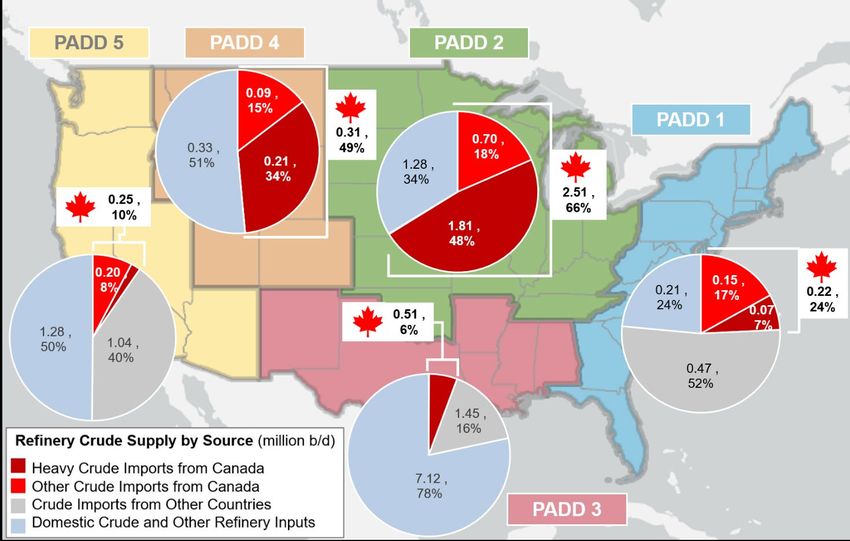
U.S.-Canada Cross-Border Petroleum Trade: An Assessment of Energy Security and Economic Benefits

            This report was commissioned by the American Petroleum Institute (API)

                                                                                               2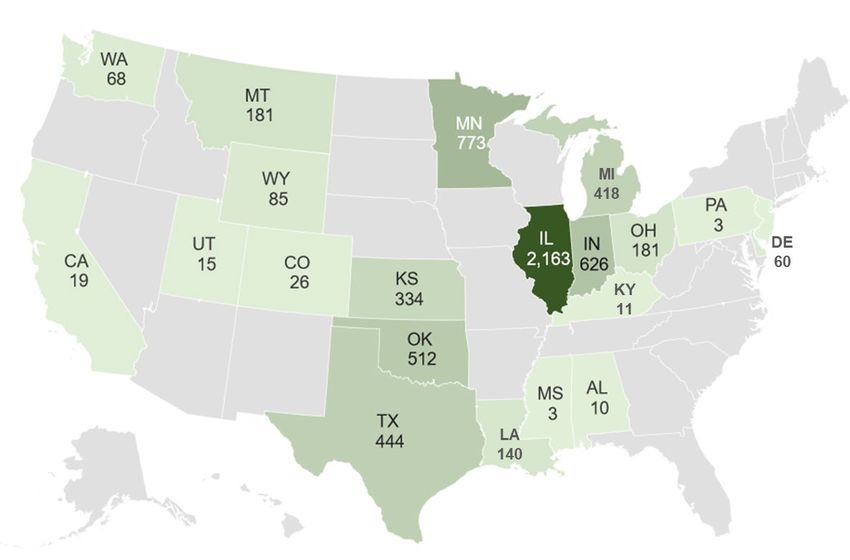
U.S.-Canada Cross-Border Petroleum Trade: An Assessment of Energy Security and Economic Benefits

Table of Contents
I.          Executive Summary ...................................................................................................... 4
II.         Introduction ................................................................................................................... 6
III.        Overview of U.S.-Canada Petroleum Trade ................................................................. 7
      U.S.-Canada Petroleum Trade Volumes Have Surged ........................................................... 7
      Petroleum Is a Major Component of Total U.S.-Canada Bilateral Trade ................................. 8
IV.         North American Oil Production and Refining Markets Integration ...........................10
      U.S.-Canada Oil Trade Reduces North American Dependence on Overseas Crude Oil
      Imports ..................................................................................................................................10
      Cross-Border Pipelines Facilitate U.S.-Canada Oil Market Integration...................................14
      The United States Is a Natural Market for Western Canadian Oil Exports .............................15
V.          The Importance of Canadian Heavy Crude Oil to U.S. Refiners ................................17
      Refining Heavy Crude Oil Requires Additional Processing ....................................................17
      U.S. Refineries Have Added Heavy Oil Processing Capabilities ............................................19
      U.S. Heavy Crude Oil Supply Relies on Imports from Canada ...............................................21
VI.         Economic Benefits of Refining Heavy Canadian Crude Oil .......................................23
      Assessment of Heavy Canadian Crude Oil Costs ..................................................................23
      Assessment of Replacement Crude Oil Costs .......................................................................24
      Estimation of Per Barrel Refinery Margin Impacts .................................................................25
      Estimation of Total Refinery Margin Benefits .........................................................................28
      Economic Benefits by State ...................................................................................................29
VII.        Endnotes .......................................................................................................................31

                                                                                                                                                3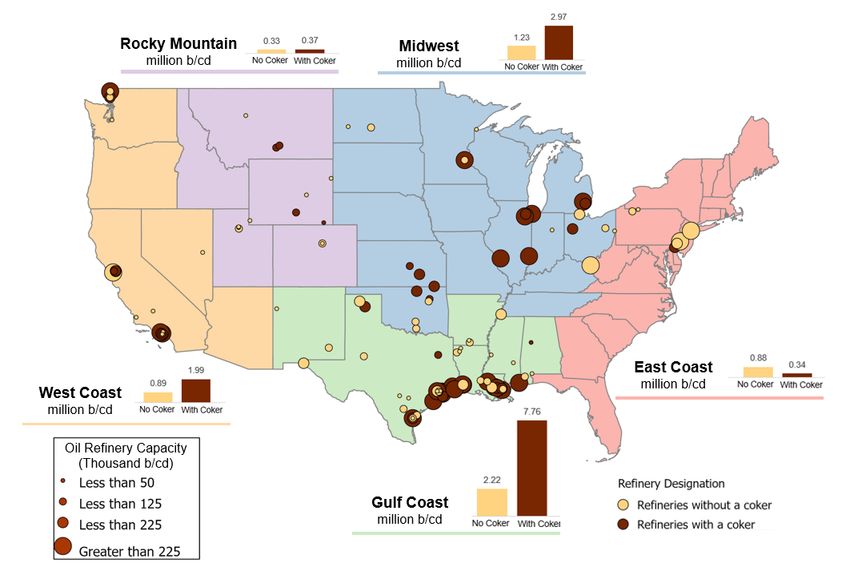
U.S.-Canada Cross-Border Petroleum Trade: An Assessment of Energy Security and Economic Benefits

 I. Executive Summary
Over the past decade, surging growth in the U.S.-Canada cross-border petroleum trade has
accelerated integration of the North American energy market, providing economic benefits to
both nations—supporting economic growth, jobs and market efficiencies that help lower
consumer energy costs on both sides of the border—and strengthening the continent’s energy
security by expanding the flow of critical energy supply between trusted trading partners. From
2010 through 2019, total petroleum trade volume between the United States and Canada
doubled from approximately 1.0 to 2.0 billion barrels annually. Most of the volume growth over
this period came from increased trade in crude oil, driven by U.S. imports of heavy crude oil by
pipeline and rail from Western Canada, and Canadian imports of light crude oil by marine vessel
and pipeline from U.S. tight oil regions in Texas and North Dakota.
Growth in the cross-border petroleum trade, coupled with the growth in domestic production on
both sides of the border, has strengthened North American energy security by helping drive a
sharp decline in oil imports from overseas suppliers—from 2010 through 2019, the share of U.S.
refinery crude supply coming from North American sources (United States, Canada, or Mexico)
rose from 57% to 86%, while the share for Eastern Canadian refineries rose from 36% to 82%.
Over the same period, imports from the Organization of the Petroleum Exporting Countries
(OPEC) fell from around one-third of total supply in both countries to approximately 9% in the
United States and 12% in Eastern Canada, respectively (see Exhibit 1).
Exhibit 1. U.S. and Eastern Canadian Refinery Crude Supply (%) by Origin, 2010 vs. 2019

           U.S. Refinery Crude Supply                             E. Canada Refinery Crude Supply
 100%                                                      100%
                                        9%                                                      12%
  90%                                   5%                  90%
                 34%,                                                     34%,                   6%
  80%            OPEC                                       80%           OPEC
                                       23%
  70%                                                       70%

  60%          9%, Other                4%                  60%                                 45%,
                                                                                                USA
                 13%,                                                     30%,
  50%                                                       50%           Other
                Canada
                                                  86%
  40%             8%,                                       40%
                 Mexico                                                                                82%

  30%                       57%        59%                  30%

  20%            36%,                                       20%           35%,                  37%
                 USA
                                                                                     36%
                                                                         Canada
  10%                                                       10%

    0%                                                       0%
                 2010                  2019                                2010                 2019

Source: ICF analysis of data from the U.S. Energy Information Administration and Statistics Canada

U.S.-Canada trade in heavy crude oil is an interdependent relationship. The United States is a
natural export market for Western Canadian heavy oil and virtually all of Canada’s increased oil
production over the past decade was exported to U.S. refining markets. Many refineries in the
U.S. Midwest, Rocky Mountain, and Pacific Northwest regions are closer to Western Canadian
oil production than refineries in Eastern Canada. Furthermore, driven by discounts on heavy

                                                                                                             4
U.S.-Canada Cross-Border Petroleum Trade: An Assessment of Energy Security and Economic Benefits
crude grades, many U.S. refineries have equipped their facilities with the additional processing
and treatment capacity needed to transform heavy, high-sulfur crude oil into high-value end
products. As of 2019, Canadian heavy crude accounted for more than half of total heavy oil
supply to U.S. refineries. Given the limited global supply of heavy oil and the landlocked
locations of many U.S. heavy oil refiners, the United States is not able to easily replace
Canadian heavy oil with supply from other sources.
U.S. refining of Canadian heavy crude oil contributes to the economic output of several U.S.
States. ICF estimates that, in 2019, U.S. refiners enhanced refinery margins (product revenues
minus crude costs) by approximately $6.1 billion by processing Canadian heavy oil instead of
regionally available replacement grades. These enhanced margins contribute directly to value
added in the industrial sector, which in turn contributes to U.S. Gross Domestic Product (GDP)
and to the Gross State Product (GSP) of 21 states (see Exhibit 2). Most of these benefits—
approximately $5.0 billion—accrued to refiners in the U.S. Midwest/Midcontinent region
(Petroleum Administration for Defense District [PADD] 2), where approximately 70% of all
Canadian heavy oil barrels were imported and where low-cost, cross-border pipelines reduce
the delivered cost of Canadian crude.
Exhibit 2. Direct Benefits to Gross State Product of Processing Canadian Heavy Crude Oil ($ million)
Source: ICF modeling and analysis
Continued growth in U.S.-Canada petroleum trade will further strengthen the economies of both
countries and further enhance North American energy security. However, such growth in trade
relies on the continued development and maintenance of cross-border infrastructure to facilitate
the movement of energy commodities and further integration of the North American energy
market.
5U.S.-Canada Cross-Border Petroleum Trade: An Assessment of Energy Security and Economic Benefits
II. Introduction
U.S.-Canada cross-border trade in petroleum liquids—including crude oil, petroleum products,
and hydrocarbon gas liquids (HGLs)—is an important contributor to the North American
economy and to the continent’s energy security. This trade has accelerated over the past
decade as technological advances have unlocked new sources of North American energy in
Canada’s oil sands and in U.S. shale gas and tight oil regions, and as North American
midstream companies have developed new transportation infrastructure and pathways to
support these trade flows.
Growth in the cross-border petroleum trade provides economic benefits to both countries,
contributing to the economic output in many U.S. states and Canadian provinces, contributing to
lower energy costs for consumers across the continent, and supporting well-paying jobs in both
countries’ manufacturing sectors—primarily in the energy industry itself and in its support
industries, and secondarily in industries that thrive on the low-cost energy and commodity inputs
supplied by the petroleum sector.
Growth in the cross-border petroleum trade also promotes U.S. and Canadian energy security—
defined by the International Energy Agency (IEA) as “the uninterrupted availability of energy
sources at an affordable price”—by creating secure pathways for critical energy flows and
further integrating the North American energy market. Robust North American energy
production and cross-border trade reduces dependence on unstable or unreliable overseas
suppliers, including members of the Organization of the Petroleum Exporting Countries (OPEC),
and mitigates the impacts of overseas supply disruptions on the U.S. and Canadian economies.
The energy security benefits of the U.S.-Canada energy trade are underscored by recent
disruptions to overseas oil supplies, such as the September 2019 attack on Saudi oil
infrastructure, and by ongoing instability in major oil producing countries, such as Venezuela,
Iran, and Nigeria.
Continued growth in the U.S.-Canada petroleum trade—growth that will further strengthen the
economies of both countries and further enhance North American energy security—relies on the
continued development and maintenance of cross-border infrastructure to facilitate the
movement of energy commodities and further integration of the North American energy market.
This report, which was commissioned by the American Petroleum Institute (API), will examine
several aspects of U.S.-Canada petroleum trade, including
• a high-level overview of the cross-border petroleum trade and growth in this trade over
the past decade (Section III);
• an analysis of cross-border crude oil trade, highlighting the integration of the U.S. and
Canadian oil production and refining sectors (Section IV);
• an analysis of the growth of Canadian heavy oil supply and investments by U.S. refiners
to take advantage of this nearby, low-cost energy source (Section V); and
• an assessment of the economic benefits to U.S. states of processing Canadian heavy oil
(Section VI).
6U.S.-Canada Cross-Border Petroleum Trade: An Assessment of Energy Security and Economic Benefits
III. Overview of U.S.-Canada Petroleum Trade
U.S.-Canada Petroleum Trade Volumes Have Surged
Petroleum trade between Canada and the United States doubled over the past decade (2010
through 2019) as technological advances unlocked new production sources in both countries,
and as importers/exporters leveraged a combination of existing cross-border pipelines, new
cross-border pipelines, marine vessels, and rail to further integrate the North American energy
market. Exhibit 3 presents two charts: the chart on the left shows movements of petroleum
liquids from Canada to the United States and the chart on the right shows movements in the
opposite direction. Volumes on both charts are broken out by commodity type: crude oil;
petroleum products, such as gasoline, diesel, and jet fuel; and HGLs, which include natural gas
liquids such as ethane, propane, butane, and pentanes plus. The black line on the left indicates
U.S. imports of Canadian petroleum as a share of total U.S. petroleum supply (total domestic
production plus imports) and the dotted black line on the right indicates Canadian imports of
U.S. petroleum as a share of total Canadian petroleum supply.
Exhibit 3. U.S.-Canada Petroleum Liquids Trade Volume by Direction and Commodity, 2010–2019
4.5 18%
Canada to USA USA to Canada
4.0 16%
3.5 14%
Volume, Million b/d
3.0 12%
2.5 10%
Crude Oil
2.0 8%
HGLs (including NGLs)
1.5 Petroleum Products 6%
1.0 4%
0.5 2%
0.0 0%
Source: ICF analysis of U.S. Energy Information Administration (EIA) and Canadian Energy Regulator data
Exhibit 3 shows that total petroleum trade between the United States and Canada doubled from
approximately 2.75 million barrels per day (b/d) in 2010 to approximately 5.5 million b/d in 2019.
The volume growth occurred in both directions, with U.S. imports of Canadian petroleum
increasing 1.9 million b/d, or 75%, and Canadian imports of U.S. petroleum increasing 0.8
million b/d, or more than 300%, over the decade. This trade growth has further integrated the
North American energy market, and as of 2019, each country relied on the other for
approximately 15% of its total petroleum supply.
Trade growth in both directions was dominated by crude oil movements—primarily heavy crude
oil shipped by pipeline and rail from the Alberta oil sands in Western Canada to refineries in the
U.S. Midwest and Gulf Coast regions, and light crude oil from tight oil plays in North Dakota and
Texas shipped by pipeline and marine vessel to refineries in Eastern Canada. Other drivers of
trade growth included Canadian imports of U.S. products, which nearly doubled from 145,000
7U.S.-Canada Cross-Border Petroleum Trade: An Assessment of Energy Security and Economic Benefits
b/d to about 280,000 b/d, and Canadian imports of U.S. HGLs, which increased more than
fivefold from 50,000 b/d to 275,000 b/d. HGL exports to Canada have surged over the past
decade following the completion of a new cross-border pipeline carrying ethane from the
Marcellus Shale region in Pennsylvania to the petrochemical hub in Sarnia, Ontario, and the
reversal and conversion of existing cross-border pipelines to carry diluent (pentanes plus) to
Alberta to be blended with oil sands bitumen to facilitate the shipment of heavy crude oil by
pipeline and rail. 1 It should be noted that much of this diluent is returned to the United States as
part of Canada’s heavy oil export mix.
Although U.S. imports of Canadian petroleum products and HGLs have been relatively stable
over the decade, they remain an important source of supply for several regions in the United
States. In New England, petroleum product and HGL imports (including gasoline, diesel, and
propane) from Canada ranged from 330,000 to 400,000 b/d over the period, typically accounting
for more than 40% of all products consumed in the region. 2 Transportation fuel volumes were
primarily delivered by marine vessel from Eastern Canadian refineries, while propane imports
were primarily delivered by rail. In the U.S. Midwest, propane imports from Canada by pipeline
and rail ranged from 35,000 to 60,000 b/d, accounting for 15% to 30% of the region’s propane
consumption, and even higher shares in some states, particularly in the Upper Midwest. 3
Petroleum Is a Major Component of Total U.S.-Canada Bilateral Trade
Canada was the United States’ top trading partner for goods in 2019, and cross-border trade of
petroleum liquids comprised a significant portion of this cross-border trade. 4 Exhibit 4 plots the
annual value of U.S.-Canada petroleum trade from 2010 through 2019. 5
Exhibit 4. U.S.-Canada Petroleum Liquids Trade Value by Direction, 2010–2019
140 25%
120
26 20%
Customs Value, $ billion
19
100 13
11
22 20 15%
80
7 17 15
60
10%
100 14
92 96
40 86
74 76
65 59 62 5%
20 45
0%
2010 2011 2012 2013 2014 2015 2016 2017 2018 2019
U.S. Petroleum Liquids Exports to Canada ($ bn)
U.S. Petroleum Liquids Imports from Canada ($ bn)
Petroleum Liquids as % of Total U.S.-Canada Trade in Goods (Right Axis)
Note: Denominator for total U.S.-Canada trade in goods only. Excludes trade in services and U.S. exports to Canada
of foreign goods (re-exports).
Source: ICF analysis of U.S. Census Bureau (USA Trade Online) data
Although petroleum trade volumes sharply increased over the decade (see Exhibit 3), the trade
value has fluctuated along with global commodity prices; U.S.-Canada petroleum trade peaked
8U.S.-Canada Cross-Border Petroleum Trade: An Assessment of Energy Security and Economic Benefits
at more than $125 billion in 2014—when U.S. benchmark West Texas Intermediate (WTI) oil
prices averaged $93 per barrel—and fell to a low of just under $60 billion in 2016—when WTI
averaged $43 per barrel. 6 Over the decade, petroleum liquids trade as a share of total U.S.-
Canada trade in goods similarly fluctuated in the range of 10% to 20%. In 2018 and 2019, trade
in oil and gas liquids held stable at $96 billion, or approximately 17% of total U.S.-Canada trade
in goods. For comparison, in 2019, total cross-border petroleum trade of $96 billion was the
second largest category of goods traded between the U.S. and Canada, behind only vehicles
and vehicle parts ($102 billion). 7
9U.S.-Canada Cross-Border Petroleum Trade: An Assessment of Energy Security and Economic Benefits
IV. North American Oil Production and Refining
Markets Integration
The U.S. and Canadian crude oil and refining markets have become increasingly integrated as
Canadian crude oil from Western and Eastern Canada has flowed south to refining markets in
every region of the United States, and as U.S. crude oil from the Gulf Coast and Bakken regions
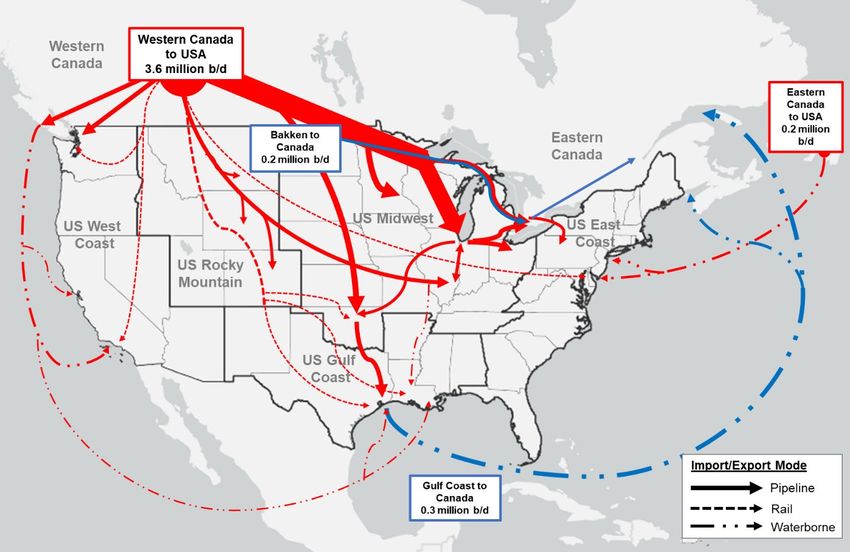
have flowed north and east, respectively, to the refining markets in Eastern Canada. Exhibit 5
summarizes cross-border crude oil trade patterns between the two countries and identifies
major trade flows by pipeline, rail, and marine vessel. In 2019, U.S. refineries imported
approximately 3.8 million b/d of crude oil from Canada, with approximately 3.6 million b/d
originating in Western Canada and 0.2 million b/d in Eastern Canada. Imports from Western
Canada primarily moved by pipeline and rail, although there were occasional marine shipments
via Canada’s West Coast export terminals. Meanwhile, U.S. crude exports to Canada, which
totaled approximately 0.5 million b/d, primarily moved by marine vessel from the U.S. Gulf Coast
or via cross-border pipeline systems through the U.S. Midwest.
Exhibit 5. U.S. and Canadian Crude Oil Trade Patterns, 2019
Source: ICF analysis of data from EIA and Statistics Canada
U.S.-Canada Oil Trade Reduces North American Dependence on Overseas
Crude Oil Imports
Over the past decade, growth in crude oil production on both sides of the border, along with the
development of new cross-border pipeline infrastructure and other transportation pathways, has
promoted further integration of U.S. and Canadian crude oil production and refining markets.
These developments have allowed both countries to reduce their dependence on crude oil
imports from overseas suppliers, including members of OPEC.
10U.S.-Canada Cross-Border Petroleum Trade: An Assessment of Energy Security and Economic Benefits
U.S. Refineries
As shown in Exhibit 6, U.S. imports of Canadian crude oil have nearly doubled, growing from 2
million b/d in 2010 (13% of total U.S. refinery inputs) to 3.8 million b/d (22% of total inputs) in
2019. Increased Canadian imports along with growth in domestic U.S. production have allowed
U.S. refiners to increase utilization of crude oil from North America (United States, Canada, or
Mexico) from 57% in 2010 to 82% in 2019. Over the same period, imports from OPEC suppliers
were reduced by 70%—from 5.1 million b/d in 2010 to 1.5 million b/d in 2019. Further integration
of the U.S. and Canadian oil markets through the expansion of cross-border pipeline
infrastructure could further reduce dependence on OPEC and other overseas imports.
Exhibit 6. U.S. Total Refinery Inputs by Source, 2010–2019
18 100%
16 1.5 90%
2.6
2.7 3.2 3.1 0.9
Refinery Inputs, Million b/d
3.0 80%
14 0.8
3.5
4.1 0.8 0.9 0.8
5.1 4.6 0.7 3.8 70%
12 3.7
0.7
2.9 3.2 3.2 3.4 60%
1.0 0.6
10 2.6
1.3 0.7
1.4 0.8 0.7 0.6 0.6 50%
2.4
8 2.2 0.8
2.0 40%
1.0
6 1.1 1.1
9.5 30%
8.5 8.4 8.3 8.9
8.2
4 7.2
6.3 20%
4.9 5.1
2 10%
0 0%
2010 2011 2012 2013 2014 2015 2016 2017 2018 2019
Non-Crude Inputs USA
Mexico Canada
Other Countries OPEC
Canada % of Total (Rt. Axis) N. America % of Total (Rt. Axis)
Note: “Non-Crude Inputs” includes the unfinished oils and natural gas plant liquids directly input into atmospheric
crude distillation units.
Source: ICF analysis of EIA data
Dependence on overseas oil imports is not uniform across U.S. refining markets. Exhibit 7
shows 2019 refinery inputs broken out by origin for the five U.S. Petroleum Administration for
Defense Districts (PADDs). The crude origins shown are U.S. domestic, imports from Canada,
and imports from other countries. Imports from Canada are further broken out between
Canadian heavy crude oil imports and other Canadian crude oil imports.
11U.S.-Canada Cross-Border Petroleum Trade: An Assessment of Energy Security and Economic Benefits
Exhibit 7. U.S. Refinery Inputs by Region and Source, 2019
Source: ICF analysis of EIA data
Exhibit 7 shows that inland regions of the United States are the most integrated with Canadian
oil markets, with Canadian crude oil representing 66% (2.51 million b/d) of refinery inputs in the
U.S. Midwest (PADD 2) region and 49% (0.31 million b/d) of refinery inputs in the Rocky
Mountain (PADD 4) region. Both regions utilize 100% North American crude oil supply with no
overseas imports. The coastal regions of the United States—PADDs 1, 3, and 5—are less
integrated with the Canadian oil market due to limited pipeline capacity for Western Canadian oil
to access each region and due to limited ability to export Western Canadian crude via marine
vessel.
The Gulf Coast (PADD 5) region is by far the largest U.S. refining market. Although this region
relied on North American (U.S., Canadian, or Mexican) crude oil for approximately 90% of its
crude oil supply in 2019, it still imported nearly 900,000 b/d of crude oil from OPEC and other
countries outside North America. Much of this volume—approximately 520,000 b/d—was heavy
crude oil that could not be replaced by U.S. domestic light oil, which is in abundant supply in the
Gulf Coast region. These heavy oil imports—from places such as Venezuela, Iraq, and Saudi
Arabia—could be reduced by completion of new pipeline capacity to ship heavy oil from
Western Canada to the U.S. Gulf Coast. The dynamics of U.S. heavy oil supply and demand
are discussed in greater detail in Section V.
Eastern Canadian Refineries
Refineries in Eastern Canada (Ontario, Quebec, and the Atlantic provinces) have been
historically dependent upon overseas crude oil imports from outside North America. Exhibit 8
shows crude inputs by origin at Eastern Canadian refineries from 2010 through 2019. In 2010,
12U.S.-Canada Cross-Border Petroleum Trade: An Assessment of Energy Security and Economic Benefits
overseas imports averaged 770,000 b/d, or more than 60% of total refinery crude inputs. Since
2010, crude oil imports from the United States to Eastern Canada have increased tenfold,
climbing to approximately 0.5 million b/d in 2019, or 46% of total refinery inputs. This increase
largely displaced imports from other countries, which shrank to just 0.2 million b/d, or
approximately 18% of refinery inputs, in 2019. Imports from OPEC members declined
approximately 68% over the decade, from 410,000 b/d in 2010 to 130,000 b/d in 2019. In
addition to direct imports from the United States, much of the domestic Canadian crude
processed in Eastern Canadian refineries is shipped from Western Canada on pipeline systems
that pass through the United States before entering Eastern Canada. Altogether, it is estimated
that more than 75% of all oil refined in Eastern Canada comes from or passes through the
United States.
Exhibit 8. Eastern Canadian Refinery Inputs by Source, 2010–2019
1.4 90%
80%
1.2
70%
Refinery Inputs (million b/d)
1.0 0.18 0.13
0.41 0.32 0.19 0.15
0.43 0.20 60%
0.42 0.25 0.06
0.09 0.14 0.08
0.8 0.10 50%
0.10
0.24
0.29 0.49
0.6 0.36 0.27 0.30 0.35 0.39 40%
0.29 0.25
0.12
30%
0.4
20%
0.43 0.46 0.45 0.45 0.48
0.2 0.42 0.39 0.43 0.43 0.40
10%
0.0 0%
2010 2011 2012 2013 2014 2015 2016 2017 2018 2019
Canada USA
Other Countries OPEC
U.S. % of Total (Right Axis) N. America % of Total (Right Axis)
Note: Imports from the United States are based on Statistics Canada data and may differ slightly from U.S. EIA data.
Sources: Imports from Statistics Canada, Canadian International Merchandise Trade Database; Refinery inputs from
Canadian Energy Regulator’s Weekly Crude Run Summary and Data
Eastern Canadian oil refineries receive U.S. crude oil from multiple U.S. production areas.
According to export data from the U.S. Census Bureau, in 2019, more than half of the crude oil
exported from the United States to Canada—approximately 300,000 b/d—originated in the U.S.
Gulf Coast region and was delivered to Eastern Canada by marine vessel. In addition,
approximately 170,000 b/d of crude oil was exported via cross-border pipelines from the U.S.
Midwest to Canada. Another 4,000 b/d was primarily exported from the rail-to-marine export
terminals in Albany, NY, which receive Bakken Shale oil by rail from the Midwest. Note that total
13U.S.-Canada Cross-Border Petroleum Trade: An Assessment of Energy Security and Economic Benefits
export volumes reported by the U.S. Census Bureau in 2019 were about 20,000 b/d lower than
total import volumes from the United States reported in the Canadian International Merchandise
Trade database.
Cross-Border Pipelines Facilitate U.S.-Canada Oil Market Integration
Exhibit 9 breaks out U.S. imports of Canadian crude oil by mode of transport used to enter the
United States. After entering the United States, imported Canadian crude oil may be
transloaded onto other transportation modes for ultimate delivery to destination refineries. As
shown in Exhibit 9, cross-border pipelines are the primary mode by which Canadian crude oil is
imported into the United States. In 2019, more than 80% of U.S. crude oil imports from Canada
crossed the border by pipeline, with the remaining volumes primarily transported by rail and
marine vessel. Furthermore, since 2010, most of the increase in crude import volumes from
Canada—1.6 million out of 1.8 million b/d—has moved via cross-border pipelines, facilitated by
the development of new cross-border systems and the expansion and increased utilization of
existing cross-border systems out of Western Canada. Pipelines are generally the preferred
mode of transport for oil importers. Despite pipelines having higher upfront costs for
construction and permitting, they often offer the lowest per barrel costs for transporting oil over
long distances and are the safest and most reliable mode of liquids transportation. 8
Exhibit 9. U.S. Imports of Canadian Crude Oil by Cross-Border Transport Mode, 2010–2019
4.0
Pipeline 0.2
0.2
3.5 Rail 0.2 0.3
0.2
0.2 0.1
Marine 0.2 0.1
3.0
0.1
0.2
Volume, (Million b/d)
2.5 0.2 0.1
0.2
0.2
2.0
0.2
3.3 3.3
1.5 3.0 3.1
2.8
2.5
2.2 2.3
1.0 2.0
1.7
0.5
0.0
2010 2011 2012 2013 2014 2015 2016 2017 2018 2019
Note: Volumes represent the mode of transportation used to cross the border into the United States. After initial
receipt into the United States, crude may be transloaded onto other modes of transportation before ultimate delivery.
Source: ICF analysis of EIA Company Level Imports, EIA U.S. Movements of Crude Oil by Rail, and U.S. Census
Bureau (USA Trade Online) data
Movement of oil imports by rail have also increased over the past decade. Due to constraints on
pipeline systems out of Western Canada, oil importers have increasingly turned to crude-by-rail
delivery methods, which have gradually increased since 2012, reaching approximately 300,000
b/d in 2019. Shipping crude by rail is typically very expensive, and importers must absorb sharp
discounts on Canadian crude oil to offset the higher shipping costs. In 2019, more than half of
all Canadian crude-by-rail imports consisted of discounted heavy oil from Western Canada
moving to refineries in the U.S. Gulf Coast region. 9
14U.S.-Canada Cross-Border Petroleum Trade: An Assessment of Energy Security and Economic Benefits
A significant volume of Canadian crude oil—approximately 200,000 b/d in 2019—is imported by
marine vessel. These movements primarily consist of light and medium crude oils produced in
Eastern Canada moving to refineries in the U.S. East Coast region. In addition, there are some
imports of heavy oil to the U.S. Gulf Coast and West Coast regions out of oil export terminals on
Canada’s West Coast.
Exhibit 10 shows regional imports of Canadian crude oil by area of processing broken out by
cross-border mode of transportation. As noted earlier, after entering the United States, imported
Canadian crude oil may be transloaded onto other transportation modes for ultimate delivery to
destination refineries. For example, some Canadian crude oil imported into the U.S. Midwest via
cross-border pipeline and rail routes is transloaded onto barges on the Mississippi River for
ultimate delivery to refineries in the U.S. Gulf Coast region. It is estimated that only around
2,000 b/d of crude moved in this manner in 2019, although pipeline- and rail-to-barge
movements of Canadian crude were higher earlier in the decade, prior to the extension of cross-
border pipelines to the U.S. Gulf Coast region.
Exhibit 10. Share of Crude Oil Imports from Canada by Cross-Border Transport Mode and Region, 2019
100%
5% 5%
12%
90% 8%
19%
80%
48%
70% 33%
60%
50% 98% 100%
21% 87%
40% 76%
30%
54%
20%
31%
10%
0%
PADD 1 PADD 2 PADD 3 PADD 4 PADD 5 U.S. Total
Pipeline Rail Marine
Note: Percentages represent the mode of transportation used to enter into the United States. After initial receipt into
the United States, crude may be transloaded onto other modes of transportation before ultimate delivery.
Source: ICF analysis of data from EIA and the U.S. Census Bureau
The United States Is a Natural Market for Western Canadian Oil Exports
U.S. refineries are a natural market for landlocked Western Canadian heavy oil production
because many refineries in the U.S. Midwest and Pacific Northwest can be easily accessed by
pipeline and are—in some cases—hundreds of miles closer than refineries in the more
populous Eastern Canada. Furthermore, Western Canada’s heavy, high-sulfur crude oil requires
additional processing in order to refine, and many U.S. refiners have specifically configured their
facilities to process Canadian heavy oil (see Refining Heavy Crude Oil on page 17). Exhibit 11
shows total Canadian oil production broken out by destination market from 2010 through 2019.
The exhibit shows that total Canadian oil production grew 66% from 3.0 million to 5.0 million b/d
over the 10-year period, while consumption of Canadian crude oil in Canadian refineries
increased only 10%—from 1.0 million to 1.1 million b/d. The clear majority of the growth in
Canadian oil production during this period was exported, with virtually all the increase in
15U.S.-Canada Cross-Border Petroleum Trade: An Assessment of Energy Security and Economic Benefits
exports—about 1.8 million b/d—going to refineries in the United States. In 2019, Canadian
crude exports to the United States accounted for more than 75% of Canada’s total crude oil
production and approximately 98% of the country’s total crude exports.
Exhibit 11. Canadian Crude Oil Production by Destination Market, 2010–2019
6.0 80%
70%
5.0
60%
4.0
50%
Volume, Million b/d
3.0 3.7 3.8 40%
3.4
3.2 3.2
2.9
2.4 2.6 30%
2.0 2.0 2.2
20%
1.0
10%
1.0 1.0 1.0 1.1 1.1 1.1 1.0 1.2 1.1 1.1
0.0 0%
2010 2011 2012 2013 2014 2015 2016 2017 2018 2019
Canadian Oil Exported to Other Countries
Canadian Oil Exported to USA
Canadian Oil Consumed Domestically
Exports to USA as % of Total Canadian Oil Output (Right Axis)
Note: Total production volume includes crude oil and lease condensate, as well as lighter hydrocarbons (diluent)
blended with oil sands bitumen to lower its viscosity to meet pipeline and rail specifications for transport. In 2019,
diluent blending accounted for an estimated 0.6 million b/d of Canada’s oil production.
Source: ICF analysis of EIA and Statistics Canada data
16U.S.-Canada Cross-Border Petroleum Trade: An Assessment of Energy Security and Economic Benefits
V. The Importance of Canadian Heavy Crude Oil to
U.S. Refiners
The importance of Canadian heavy crude oil to the United States has increased over the past
20 years as Canadian heavy oil production has ramped up and U.S. refiners have increasingly
configured their facilities to take advantage of discounted heavy crudes, particularly in the
Midwest and Gulf Coast regions.
Refining Heavy Crude Oil Requires Additional Processing
Not all crude oils are the same. There are several factors that vary across crude grades;
however, two key characteristics that refiners evaluate when making crude purchases are
density (or “gravity”) and sulfur content. Gravity is typically measured on the API scale, which is
an inverse measure of the density of a petroleum liquid relative to water, with higher numbers
indicating “lighter” crude grades and lower numbers indicating “heavier” crude grades. Heavier
crude oils typically (although not always) contain more sulfur and more heavy metal
contaminants than lighter crude grades. There is significant variation in how crude oils are
classified; however, for the purposes of this report, “heavy” crude oil will be defined as crude oil
testing less than 25 degrees API. The majority of the heavy crude oil imported to the United
States from Canada is in the 15 to 25 API gravity range, although a small percentage (less than
3%) is “extra heavy” crude oil testing less than 15 degrees API. For comparison, WTI—the
benchmark crude oil grade in the United States—has an API gravity range of 40 to 44
degrees.10 Exhibit 12 plots the average API gravity and sulfur content of select crude grades in
the United States, Canada, and other countries. The Western Canadian Select (WCS) grade in
the top left corner of the exhibit (21.4 degrees AP and 3.6% sulfur) is the benchmark crude
grade for Canadian heavy oil.
Exhibit 12. API Gravity and Sulfur Content of Select U.S., Canadian, and Other Crude Grades
4.0%
Western Canadian
Select (Hardisty), US
3.5% 21.4, 3.6% Canada
Maya (Mexico),
21.7, 3.3% Other
3.0%
Arab Heavy (Saudi
Sulfur Content (%)
2.5% Arabia), 28, 2.8%
Mars, 29.4, 2.0%
2.0% West Texas
West Texas Sour, Intermediate
33.4, 1.4% (Cushing), 41.4,
1.5% 0.4%
Alaska North Slope
(Long Beach), 29.5, Bakken, 42.3, 0.1%
1.0% 1.0% Brent (U.K.), 37.5,
0.4%
Hibernia, 34.1, 0.5% Eagle Ford Crude,
0.5% Syncrude Sweet 44.9, 0.1%
Premium, 32.9,
0.0% 0.2%
10 15 20 25 30 35 40 45 50
API Gravity
Source: ICF analysis of Platts Crude Oil Specifications Guide
17U.S.-Canada Cross-Border Petroleum Trade: An Assessment of Energy Security and Economic Benefits
All else being equal, refiners will typically value heavy, high-sulfur crude oils less than lighter,
lower sulfur grades because they produce higher yields of low-value products, including heavy
products such as petroleum coke, asphalt, and residual fuel oil, and lower yields of higher value
products, such as gasoline, diesel fuel, and jet fuel. However, because of this, heavy, high-
sulfur crude grades are often priced at a discount to light, low-sulfur grades, creating an
opportunity for refiners to reduce crude costs and increase refining margins (the difference
between product sales and crude costs) if they have the ability to process heavier crude oils and
upgrade the lower value product streams (primarily heavy gasoil and residual hydrocarbon) into
higher value products.
Refineries that are configured to process heavy crude oil are typically “high complexity”
refineries that utilize multiple upgrading and treatment processes after initial atmospheric
distillation. Exhibit 13 presents a generic diagram of a high-complexity, heavy oil refinery and
highlights key processes associated with processing heavy crude oils: vacuum distillation,
coking, and cracking.
Exhibit 13. Generic Refinery Schematic with Heavy Oil Conversion Units Highlighted
Source: ICF analysis
Although most refineries have vacuum distillation units (VDUs), heavy oil refineries typically
have relatively higher capacity VDUs (as a percentage of atmospheric distillation capacity) in
order to handle higher yields of heavy gasoil and residual hydrocarbon. After vacuum distillation,
refiners further process the vacuum gasoils by adding hydrogen, via hydrotreating, followed by
catalytic cracking or hydrocracking. Refiners further process the residual hydrocarbon (oil that
boils at more than 1,000 degrees Farenheit from the VDU using carbon rejection, via coking,
visbreaking, or thermal/catalytic cracking. Refiners that process heavy crude oils also may
employ additional processing 11 to remove impurities—particularly sulfur, but also metals such as
vanadium, salt, and so forth—that can contaminate the refined product and impair the
expensive catalyst used in refining processes. Although many refineries that primarily process
18U.S.-Canada Cross-Border Petroleum Trade: An Assessment of Energy Security and Economic Benefits
light- and medium-gravity crudes also have upgrading units, these units are usually much
smaller in size relative to crude capacity than refineries equipped for heavy oil processing, and
are unable to process high percentages of heavy, higher sulfur crudes. Coking units are
specifically associated with refineries configured to process heavy crude oils.
Refiners that are configured for heavy crude do so to increase refinery margins and generally
find it less profitable to process lighter, more expensive crude grades. Furthermore, refiners that
have invested in processing high percentages of heavy crude may have difficulty adapting their
operation to process lighter crudes. Increasing rates of light versus heavy crudes in a heavy oil
refinery can impact the atmospheric distillation operation and may also jeopardize the vacuum
distillation operation by reducing heavy gasoil/residuum yield to below VDU minimum
throughput levels. Consequently, when a refinery does not have access to its normal design
crude slate, the refiner may have less crude oil capacity than when running their optimal slate.
The flexibility of a refinery to switch from heavy to light crude slates with or without the loss of
crude throughput volume varies based on the refinery’s specific configuration.
U.S. Refineries Have Added Heavy Oil Processing Capabilities
Regional differences in U.S. refinery configurations are a function of the types of crude oils
historically available to the refiners in each region. East Coast refiners historically had access to
imported sweet and medium crudes traded in the Atlantic Basin; California refineries were
designed to process very heavy, highly metal-contaminated crude from California’s San Joaquin
Valley; Midwest refiners processed light and medium crudes from the U.S. Midcontinent region,
as well as Canadian crudes; and Gulf Coast refiners had access to light and medium crudes
produced domestically in Texas, Louisiana, and offshore the Gulf of Mexico, or imported from
international markets; however, they also had access to nearby heavy crudes from Mexico and
Venezuela. Over time, regional refinery configurations have evolved in response to the changes
in the crude grades available, government regulations, and product demands.
Over the past 20 years, refineries in the U.S. Midwest and Gulf Coast regions have invested in
configuring their refineries to optimize processing Canadian heavy crude oil, the supply of which
steadily increased due to technological advancements in extracting oil from Alberta’s oil sands.
Exhibit 14 shows refinery coking capacity—the primary indicator of heavy oil processing
capability—at U.S. refineries over a 20-year period from 2000–2019, broken out by region. The
exhibit shows a steady increase in U.S. refinery coking capacity from 2.1 million to 2.8 million
barrels per calendar day (b/cd)—an increase of approximately 33%. Most of the growth has
been in the U.S. Gulf Coast and Midwest regions, which both saw coking capacity increases of
approximately 50% over the 20-year period. This growth in coking capacity was driven by the
availability and proximity of Western Canadian heavy oil, as well as the lower prices for heavy
oil versus lighter grades. The black line in Exhibit 14 shows that since 2011, the cost of
Canadian heavy crude oil delivered to Cushing, OK, has ranged from $8 to $20 per barrel below
the U.S. benchmark WTI crude oil spot price on an annual basis. These large and sustained
discounts for Canadian heavy oil spurred investments in cokers and other units to process
heavy crude oil, which require substantial capital expenses and significant lead time for
engineering, procurement, and construction.
19U.S.-Canada Cross-Border Petroleum Trade: An Assessment of Energy Security and Economic Benefits
Exhibit 14. U.S. Refinery Coking Capacity by Region vs. WTI-Heavy Canadian Oil Spread (2000–2019)
3.0 30
WTI-Heavy Canadian Oil Spread at Cushing ($/bbl)
2.5 0.6 25
Coking Capacity, Million b/cd
$18.65
2.0 $19.76 20
0.6
1.5 $16.51 15
$12.17 1.5
$14.16
$12.60 $12.53
1.0 1.0 10
$10.97
$7.88
0.5 5
0.6
0.4
0.0 0
PADD 1 PADD 2
PADD 3 PADD 4
PADD 5 WTI-Heavy Canadian Oil Spread at Cushing
Notes: Coking capacity added is reflected in the year it is commissioned, although that capacity may not have been
online for the full year. The WTI-WCS Cushing spread is calculated by subtracting the Canadian heavy oil price using
delivered cost data from the U.S. Census Bureau from the WTI-Cushing price from Bloomberg Finance L.P..
Source: ICF analysis of data from EIA, Bloomberg, and the U.S. Census Bureau
Exhibit 14 shows that coking capacity is located in every U.S. region, although as of 2019,
approximately 1.53 million b/cd of U.S. coking capacity—more than 50% of the U.S. total—was
located along the Gulf Coast, with most of the remaining capacity located in the Midwest and
West Coast regions. Exhibit 15 presents a map of total refining capacity at individual U.S.
refineries with and without cokers in 2019. This map highlights the concentrations of refineries
with coking capacity and provides a rough indication of the number and size of refineries that
have the ability to process at least some volume of heavy crude oil, although it should be noted
that even refineries with coking units will typically run a mixed slate of crude oil, including
varying portions of heavy, medium, and light crude grades based on their configuration, access
to crude, and relative crude costs.
20U.S.-Canada Cross-Border Petroleum Trade: An Assessment of Energy Security and Economic Benefits
Exhibit 15. Map of U.S. Refineries With and Without Coking Capacity, 2019
Source: ICF adaptation of map from EIA Today in Energy (January 15, 2015) using EIA Refinery Capacity Report
data as of January 1, 2020
U.S. Heavy Crude Oil Supply Relies on Imports from Canada
Exhibit 16 shows U.S. heavy oil supply by source—U.S. production, imports from Canada, and
imports from other countries—from 2010–2019. Total heavy oil supply over the period remained
largely constant at between 4.5 million and 5.2 million b/d on an annual basis. Most of the U.S.
domestic heavy oil production is produced in California, and this output is largely all refined in
California due to logistics constraints and the prohibitive costs of shipping to other U.S.
destinations. U.S. heavy oil production has steadily declined over the past 5 years from about
0.7 million b/d to 0.5 million b/d. Meanwhile, over the past decade, U.S. imports of Canadian
heavy oil—primarily from the Alberta oil sands—increased 1.6 million b/d (from about 1 million
b/d to more than 2.6 million b/d), increasing from 25% of total U.S. heavy crude oil supply in
2010 to nearly 60% by the end of 2019. Canadian heavy imports were down slightly in 2019
compared to 2018, due in large part to the implementation of production limits by the Canadian
government starting in January 2019. The growth in heavy Canadian imports has offset the U.S.
declines, but also crowded out other foreign imports—primarily from the Americas—which fell by
1.3 million b/d over the 10-year period. Part of this decline was a result of U.S. trade sanctions
on Venezuela, which went into effect in early 2019, and effectively eliminated all Venezuelan oil
imports, which averaged about 0.5 million b/d prior to the imposition of sanctions.
21U.S.-Canada Cross-Border Petroleum Trade: An Assessment of Energy Security and Economic Benefits
Exhibit 16. U.S. Reliance on Canadian Heavy Oil Supply, 2010–2019
6.0 70%
5.0 60%
2.05 2.14 50%
Heavy Oil Supply, Million b/d
4.0 1.08 1.21
1.36 1.5 1.76 2.42 2.71
40%
2.65
3.0
30%
2.0 2.78 2.73 2.45 2.27 2.11 2.12 2.25 20%
2.08 1.99
1.46
1.0 10%
0.70 0.69 0.69 0.70 0.72 0.70 0.57 0.53 0.50 0.49
0.0 0%
2010 2011 2012 2013 2014 2015 2016 2017 2018 2019
Heavy Crude Imports from Canada
Heavy Crude Imports from Other Countries
U.S. Heavy Crude Production
Imports from Canada as % of Total Heavy Oil Supply (Rt.Axis)
Source: ICF analysis of EIA data
The reliance of U.S. refiners on Canadian heavy oil supply is underscored by the limited
availability of supply alternatives. According to data from Stratas Advisors, the global heavy oil
market totaled 11.4 million b/d in 2019. 12 This means that U.S. refinery demand at
approximately 4.6 million b/d represented approximately 40% of the global heavy oil market,
and Canadian production at 3.0 million b/d represented more than one-quarter of the total
market. Furthermore, the global heavy oil market has grown more competitive as oil production
declined approximately 7% to 8% from 2016 to 2019. 13 The inability of U.S. refiners to replace
Venezuelan heavy oil barrels following the implementation of sanctions in 2019 is an indicator of
the market’s competitiveness and the difficulty of finding alternative heavy oil supply sources.
22U.S.-Canada Cross-Border Petroleum Trade: An Assessment of Energy Security and Economic Benefits
VI. Economic Benefits of Refining Heavy Canadian
Crude Oil
The refining of heavy Canadian crude oil contributes significantly to the economies of several
states. To assess these contributions, ICF calculated the impact on refining margins of refining
Canadian heavy crude oil versus available replacement crude oils over a 5-year period from
2015 through 2019. For this analysis, ICF focused on refinery variable cash margins, which
represent the value of the refinery’s revenue from product sales minus the cost of the refinery’s
primary input (crude oil inputs), and also subtracts variable operating expenses, such as energy,
chemicals, and catalysts. The economic analysis in this section is not a “shutdown” analysis in
that it does not project the complex set of reactions that would occur if Canadian oil trade were
to stop suddenly. Under a shutdown scenario, the demand for replacement crudes would
increase, resulting in increases in the price of replacement crudes and delivery constraints/
bottlenecks on pipelines and other transportation modes delivering replacement crudes. In
contrast, the economic analysis in this study estimates the refinery margin impact that a refiner
experiences from choosing to process a single barrel of heavy Canadian crude versus
processing a single barrel of replacement crude under static conditions. This per barrel refinery
margin is then scaled up based on the number of Canadian heavy oil barrels processed in the
region or in the country as a whole. Increases in refinery margins contribute directly to value
added in the industrial sector, which is a primary component of gross state product (GSP) and
gross domestic product (GDP) calculations.
ICF’s analysis involved several steps, which are further outlined in the sections below:
1. Assessment of Heavy Canadian Crude Oil Costs
2. Assessment of Replacement Crude Oil Costs
3. Estimation of Per Barrel Refinery Margin Impacts
4. Estimation of Total Benefits
5. Economic Benefits by State
Assessment of Heavy Canadian Crude Oil Costs
ICF developed representative per barrel acquisition costs for heavy Canadian crude oil
(inclusive of cost, insurance, and freight) for several representative delivery points across the
United States based on crude oil import cost and quantity data obtained from the U.S. Census
Bureau’s USA Trade Online system. These data are available in monthly time intervals at the
Customs District level. Delivery points assessed included Minneapolis, Cushing, Chicago, Wood
River (IL), Toledo, and Detroit in the Midwest (PADD 2) region; Montana in the Rocky Mountain
(PADD 4) region; Port Arthur, Houston, and New Orleans in the Gulf Coast (PADD 3) region;
Philadelphia and New York City in the East Coast (PADD 1) region; and Washington State, San
Francisco, and Los Angeles in the West Coast (PADD 5) region.
Cost data to these delivery locations include the origin cost of the commodity (the crude oil), as
well as the cost of transportation, including pipeline tariffs on cross-border pipelines and/or
marine shipping costs for coastal deliveries to coastal delivery locations. Costs for crude-by-rail
shipments are more difficult to isolate based on U.S. Census Bureau data and were separately
estimated using the spot price of WCS crude oil and ICF’s estimates of crude-by-rail
transportation costs. ICF’s -crude-by-rail transport costs include freight rates for crude oil unit
trains, diesel fuel surcharges, crude oil (diluted bitumen) tank car lease rates, loading terminal
fees, and (if relevant) additional unloading terminal and destination pipeline delivery fees.
23U.S.-Canada Cross-Border Petroleum Trade: An Assessment of Energy Security and Economic Benefits
Exhibit 17 presents 2019 average delivered costs for heavy oil to select delivery locations
broken out by transport mode. The differences between delivered costs are primarily driven by
the differences in transportation costs by pipeline, rail, and marine vessel from Alberta to each
delivery location, but also reflect the differences in commodity costs stemming from the
differences in crude qualities and/or discounts or premiums associated with term contracts.
Exhibit 17. Average 2019 Delivered Costs of Heavy Canadian Crude Oil for Select Delivery Locations and
Transport Modes ($/barrel)
Gulf Coast Rail 57.67
California Rail 55.48
East Coast Rail 55.25
TX Gulf Coast Pipe/Marine 55.08
Washington State Rail 51.16
Chicago Pipeline 47.17
Minnesota Pipeline 45.95
Montana Pipeline 45.57
- 10 20 30 40 50 60 70
Pipeline Rail
Source: ICF analysis of data from the U.S. Customs Bureau and Bloomberg; ICF estimates of rail transport costs
Assessment of Replacement Crude Oil Costs
ICF assessed the costs of replacement crudes by selecting available alternative crude grades in
each refining market and estimating the cost of delivery to each delivery location. While refiners
may vary in what crude they chose to use as a substitute, the crudes ICF chose are a
reasonable approximation of the cost increases associated with the average refiner’s response.
For refineries in the coastal regions (East Coast, Gulf Coast, and West Coast), ICF assumed
that Canadian crude would be replaced by Arab Heavy—a high-sulfur, 28 API crude grade 14
from Saudi Arabia available for purchase in the global market—delivered by marine tanker. For
most refineries in the Midwest, ICF assumed that Canadian crude would be replaced by West
Texas Sour (WTS)—a medium-gravity and medium-sulfur crude produced in the Permian Basin
in West Texas and New Mexico. WTS crude oil can be delivered by pipeline to the storage hub
in Cushing, OK, from which connecting pipelines can deliver it to virtually any refinery in the
Midwest region, except for refineries in Minnesota and Wisconsin. In those states, ICF assumed
that Canadian heavy crude oil would be replaced by Bakken crude oil from North Dakota.
Finally, in the Rocky Mountain (PADD 4) region, ICF assumed that Canadian heavy crude
would be replaced by locally produced crude oils. ICF assessed the delivered costs for Arab
Heavy, WTS, and Bakken crude oils by obtaining spot market data from Bloomberg and adding
estimated marine tanker or pipeline delivery costs using current pipeline tariffs. Delivered costs
for local PADD 4 crudes were estimated using the U.S. Energy Information Administration’s
(EIA) average domestic refinery acquisition crude cost (RACC) for the region. 15
24U.S.-Canada Cross-Border Petroleum Trade: An Assessment of Energy Security and Economic Benefits
Exhibit 18. Estimated Average 2019 Delivered Costs of Replacement Crude Oils for Select Locations and
Transport Modes ($/barrel)
West Coast (Arab Heavy) 62.22
Gulf Coast (Arab Heavy) 60.92
East Coast (Arab Heavy) 60.76
Chicago (WTS) 58.65
Minnesota (Bakken) 55.16
Montana (local PADD 4) 53.62
0 10 20 30 40 50 60 70
Pipeline Marine
Source: ICF analysis of data from Bloomberg and EIA
Estimation of Per Barrel Refinery Margin Impacts
After assessing the delivered costs for heavy Canadian and replacement crude oils, ICF
subtracted the former from the latter for each refinery processing heavy Canadian crude oil to
estimate the gross cost savings. The cost savings were then adjusted to account for differences
in the “refining value” of the heavy Canadian and replacement crudes to estimate the net impact
on refinery margins. A crude oil’s refining value is a measure of the dollar value of all products
produced by each barrel processed at the refinery less the variable operating costs for
processing each barrel of crude at the refinery, such as energy, chemicals, and catalysts. Each
refinery will value crude oils differently based on the refinery’s specific configuration (the mix of
downstream processing units that a refinery utilizes to transform the crude oil into high-value
products) and the price for petroleum products in the markets supplied by the refinery. As noted
previously (see Refining Heavy Crude Oil), heavy crude oils typically have lower refining values
because they yield a higher share of lower value products than lighter crude oils after initial
distillation, and because processing heavy crude oil involves higher variable operating costs due
to the additional processing required.
ICF assessed the refining value of Canadian heavy crude oil and the associated replacement
crudes using data on refinery yields at coking refineries as calculated by Turner, Mason &
Company and published weekly in Platts Oilgram Price Report. This data is available on a
regional basis—Gulf Coast, Atlantic Coast, Midcontinent, and West Coast. In general, refining
value differentials versus heavy Canadian crude were higher in the Midwest and Rocky
Mountain regions due to lighter, lower sulfur replacement crude oils (WTS, Bakken, and PADD
4 local crudes) than in the coastal regions where Arab Heavy was used as a replacement.
Exhibit 19 presents a sample refinery margin impact calculation for a Chicago area refinery
processing 100,000 b/d of heavy Canadian crude oil in December 2019. According to U.S.
Census Bureau data, the average delivered price of heavy Canadian crude oil to the Chicago
Customs District was $45.90 per barrel in December 2019. In that same month, ICF estimated
that buying one barrel of WTS crude oil in Midland, TX, and delivering it by pipeline to the
Chicago area would cost approximately $59.54 per barrel. This yields a gross per-barrel cost
savings at the refinery gate of $13.64 for purchasing heavy Canadian crude oil. However,
25U.S.-Canada Cross-Border Petroleum Trade: An Assessment of Energy Security and Economic Benefits
because WTS has a greater yield of higher refining value products, ICF subtracted $4.21 per
barrel from the estimated savings to yield a net per-barrel refinery margin impact of $9.43. The
total refinery margin impact is then calculated by multiplying this per-barrel impact by the total
barrels of heavy Canadian crude oil processed over the month—3.1 million barrels for a refinery
importing 100,000 b/d. This yields a total refinery margin impact of approximately $29.2 million
for the refinery in the month.
Exhibit 19. Sample Refinery Margin Impact Calculation for a Chicago Area Refinery, December 2019
Line Item Unit Value
A. Canadian Heavy Oil Delivered to the Chicago Area $/barrel $45.90
B. WTS Oil Delivered to the Chicago Area (estimated) $/barrel $59.54
C. Gross Per-Barrel Crude Cost Differential (B minus $/barrel $13.64
A)
D. Refining Value Adjustment $/barrel -$4.21
E. Net Per-Barrel Refinery Margin Impact (C plus D) $/barrel $9.43
F. Total Canadian Heavy Oil Imports barrels 3,100,000
Total Refinery Margin Impact (E x F) $ $29,233,000
Exhibit 20 summarizes ICF’s crude oil cost and refinery margin impact analysis for six select
delivery locations from 2015 through 2019. For each location, the exhibit shows the delivered
costs of Canadian heavy crude oil, the delivered costs for replacement crudes, the gross
differential between the two costs, and the net refinery margin impact after adjusting for refining
value differentials. The exhibit shows generally strong refinery margin impacts in the regions
that have historically relied on Canadian heavy crudes (Chicago, Minnesota, Montana, and
Washington State) and smaller, but mostly positive, margin impacts on the Texas Gulf Coast
and East Coast. These results are largely due to the higher transportation costs for moving
Canadian heavy crude oil to the East Coast and Gulf Coast regions because these regions rely
more heavily on crude by rail.
26You can also read


