U.S. Foreign-Trade Zones: Background and Issues for Congress
←
→
Page content transcription
If your browser does not render page correctly, please read the page content below
U.S. Foreign-Trade Zones: Background and
Issues for Congress

Mary Jane Bolle
Specialist in International Trade and Finance

Brock R. Williams
Analyst in International Trade and Finance

August 28, 2012

                                                  Congressional Research Service
                                                                        7-5700
                                                                   www.crs.gov
                                                                         R42686
CRS Report for Congress
Prepared for Members and Committees of Congress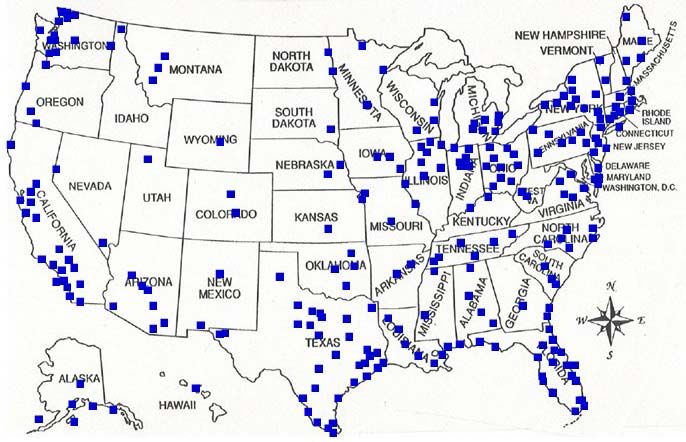
U.S. Foreign-Trade Zones: Background and Issues for Congress

Summary
U.S. foreign-trade zones (FTZs) are geographic areas declared to be outside the normal customs
territory of the United States. This means that, for foreign merchandise entering FTZs and re-
exported as different products, customs procedures are streamlined and tariffs do not apply. For
products intended for U.S. consumption, full customs procedures are applied and duties are
payable when they exit the FTZ.

In 1934, in the midst of the Great Depression, Congress passed the U.S. Foreign-Trade Zones
Act. It was designed to expedite and encourage international trade while promoting domestic
activity and investment. The U.S. FTZ program offers a variety of customs benefits to businesses
which combine foreign and domestic merchandise in FTZs. Similar types of “zones” exist in 135
countries, employing about 66 million workers worldwide. Though some aspects differ, all have
streamlined customs procedures and no duties applicable on components and raw materials
combined in zones and then exported. Use of the zones can facilitate cooperative international
production for a substantial share of the global supply chain.

U.S. FTZs can affect the competitiveness of U.S. companies by allowing savings through (1) duty
reduction on “inverted tariff structures” (where tariffs are higher on imported components than on
finished products); (2) customs and inventory efficiencies; and (3) duty exemption on goods
exported from, or consumed, scrapped, or destroyed in, a zone. Though difficult to achieve, other
possible alternatives, such as broad-based tariff reductions through multilateral negotiations, and
overall customs reform might provide some of the same competitive advantages as zone use in a
more efficient manner, while also ensuring that all importers have equal access.

Zone activity represents a significant share of U.S. trade. In 2011, over 12% of foreign goods
entered the United States through FTZs—75% of them as crude oil. Most shipments arriving
through FTZs were consumed in the United States; the rest were exported. Crude oil byproducts
such as gasoline, diesel, jet fuel, kerosene, and petrochemicals dominate FTZ output. Other key
products include autos, consumer electronics, and machinery. U.S. zone activity occurs primarily
in FTZ manufacturing “subzones.”

Administration of the U.S. FTZ system is overseen by the Secretaries of Commerce and the
Treasury, who constitute the U.S. FTZ Board. The Board is responsible for the establishment of
zones, the authorization of specific production activity, and the general oversight of zones. It also
appoints an Executive Secretary, who oversees the Board’s staff. Homeland Security’s Customs
and Border Protection (CBP) directly oversees FTZs. It activates the zones and secures and
controls dutiable merchandise moving into and out of them. CBP oversight also includes both
protection of U.S. tariff revenue and protection from illegal activity through screening, targeting,
and inspections.

In 2012, the U.S. FTZ Board issued new regulations. They focused primarily on streamlining the
application procedures and shortening, generally from a year to four months, the time for FTZ
approval for manufacturing in FTZs and subzones.

Congressional Interest

Congress has demonstrated a continuing interest in U.S. Foreign Trade Zones (FTZs), as they (1)
may help to maintain U.S. employment opportunities and the competitiveness of U.S. producers;
(2) encompass a portion of U.S. trade; and (3) affect U.S. tariff revenue. U.S. FTZs account for

Congressional Research Service
U.S. Foreign-Trade Zones: Background and Issues for Congress

less than one-half of one percent of all world zone workers and a small share of the U.S.
workforce. However, most of this employment is in manufacturing, which has lost a significant
share of its workers over the past several decades. Today, every state has at least one FTZ, and
many have numerous manufacturing subzones.

Current issues for Congress relating to the U.S. FTZ program may include (1) whether U.S. FTZs
encourage a misallocation of U.S. resources; (2) data availability issues; (3) security concerns;
and (4) the U.S. employment and global competitiveness impact of FTZs. Broader considerations
relating to the world zone network include (5) the effectiveness of trade zones worldwide as a
tool for economic development; and (6) trade zones worldwide and worker rights.

Congressional Research Service
U.S. Foreign-Trade Zones: Background and Issues for Congress
Contents
Introduction...................................................................................................................................... 1
Background on Free Trade Zones.................................................................................................... 1
Free Trade Zones Around the World ......................................................................................... 1
Similarities and Differences Among Free Trade Zones Worldwide .......................................... 3
Growth of Free Trade Zones Worldwide ................................................................................... 4
The U.S. Foreign-Trade Zone Program ........................................................................................... 6
History ....................................................................................................................................... 6
The FTZ System Today ............................................................................................................. 7
Growth in FTZ Usage and Industry Concentration ................................................................... 8
Overall Economic Benefits and Costs of FTZs ....................................................................... 10
Business Benefits and Costs of FTZ Status............................................................................. 11
Benefits ............................................................................................................................. 11
Costs.................................................................................................................................. 13
The Administrative Mechanism Behind FTZs ........................................................................ 13
Application for FTZ Status...................................................................................................... 14
Current FTZ and Worldwide Zone-Related Issues for Congress................................................... 16
Do U.S. FTZs Encourage a Misallocation of U.S. Resources? ............................................... 16
Data Availability Issues Relating to FTZs ............................................................................... 17
Security Issues Relating to FTZs............................................................................................. 19
U.S. Employment and Global Competitiveness Impact of FTZs ............................................ 20
Effectiveness of World Trade Zones as a Tool for Economic Development ........................... 21
Trade Zones Worldwide and Worker Rights............................................................................ 22
Outlook: Future of U.S. FTZs and Zones Worldwide?.................................................................. 23
Figures
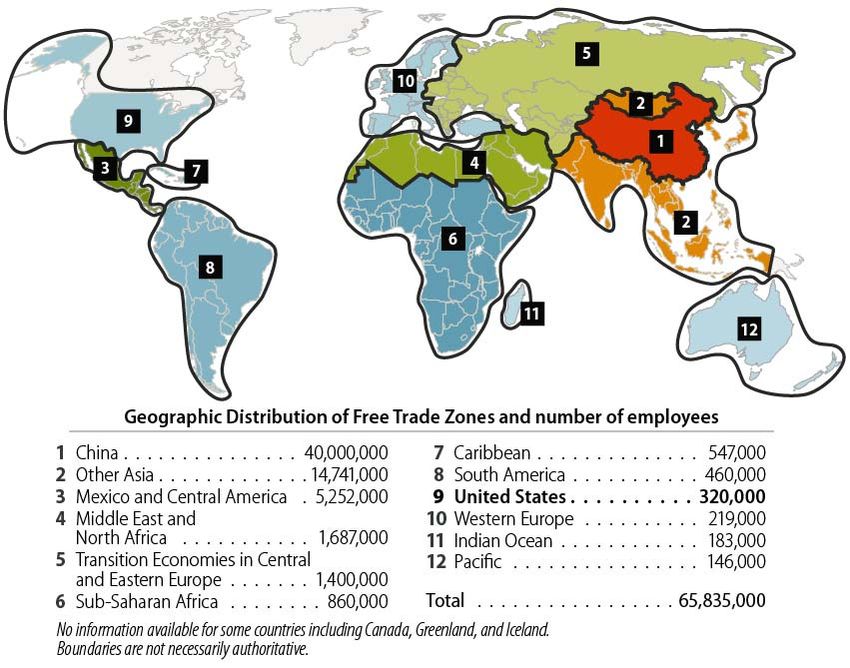
Figure 1. World Geographic Distribution of Employment in Free Trade Zones, 2006 ................... 3
Figure 2. Elements of Modern Trade Zones .................................................................................... 4
Figure 3. Growth of the World Free Trade Zone System: 1959-2006 ............................................. 5
Figure 4. U.S. Foreign-Trade Zones, by State ................................................................................. 7
Figure 5. FTZ Input: Foreign and Domestic Components, and Employment Levels, 1993-
2010 .............................................................................................................................................. 9
Figure 6. FTZ Output: Shipment to the U.S. Market, and Exports, 1993-2010 ............................. 9
Figure 7. FTZ Foreign Input Shares, 2011..................................................................................... 10
Figure 8. FTZ Foreign Input Levels, 1993 & 2011 ....................................................................... 10
Tables
Table 1. FTZ and Census Data Reported on Merchandise Entering or Leaving FTZs.................. 18
Table A-1. U.S. FTZ Activity by Zone Type, 2010........................................................................ 25
Congressional Research Service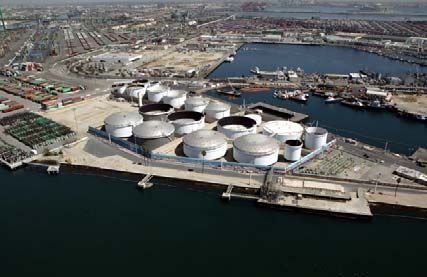
U.S. Foreign-Trade Zones: Background and Issues for Congress

Table A-2. Duty Payments on Imports Through Foreign-Trade Zones ......................................... 26
Table A-3. Key Data on U.S. FTZs, 1993, 1997, and 2010 ........................................................... 26

Appendixes
Appendix........................................................................................................................................ 25

Contacts
Author Contact Information........................................................................................................... 27
Acknowledgments ......................................................................................................................... 27

Congressional Research Service
U.S. Foreign-Trade Zones: Background and Issues for Congress

Introduction
Members of Congress have demonstrated their interest in the U.S. Foreign-Trade Zone (FTZ)
system through hearings and legislation over the past seven decades. The program may enhance
the competitiveness of U.S. businesses, support employment opportunities, and impact U.S. tariff
revenues. Balancing these potential gains, others argue that the program may also be trade
distorting, and may play a role in misallocating resources in the economy as a whole.

This report provides a general perspective on the U.S. FTZ system. It is divided into three parts.
As background, the first section discusses free trade zones worldwide. The second section focuses
on the U.S. FTZ program—its history, administrative mechanism, structure, growth and industry
concentration, and benefits and costs. The third section focuses on current issues for Congress
relating to the U.S. FTZ program.

Background on Free Trade Zones

Free Trade Zones Around the World
Foreign-trade zones (FTZs)1 are the U.S. version of free trade zones scattered around the world.
Zones elsewhere are called by many different names (See Text Box 1.)

        Many Names: Variations on a Theme                        Free trade zones are a specific type of
                         (Text Box 1)                            restricted access (e.g., fenced-in) industrial
Free trade zones around the world are called by a                park housing concentrations of production
number of different names, depending on the country in
which they are located and the particular type of zone. In
                                                                 facilities and related infrastructure. They are
the United States, they are referred to as foreign-trade         typically located at or near sea, air, or land
zones. Those in developing countries producing                   ports.
specifically for export are typically called export processing
zones. They are also called special economic zones in
                                                 Free trade zones have become a substantial
China, industrial free zones or export free zones in Ireland,
                                                 part of the structure underpinning the global
Qualifying Industrial Zones (QIZs) in Jordan and Egypt, free
                                                 supply chain. Together, these roughly 3,500
zones in the United Arab Emirates, and duty free export
processing zones in the Republic of Korea.       zones in 135 countries, including the United
                                                 States2 (see Figure 1), form a web that frees
producers from most customs procedures and offer duty savings, thus facilitating intricate
international co-production operations.

1
  For general information on foreign-trade zones see the Department of Commerce, International Trade
Administration’s Frequently Asked Questions section of the Foreign-Trade Zones Board website at
http://ia.ita.doc.gov/ftzpage/info/ftzstart.html.
2
 International Labor Organization (ILO), ILO Database on Export Processing Zones (Revised), by Jean-Pierre Singa
Boyenge, Working Paper, April 2007, Geneva; database developed by the World Bank in conjunction with the World
Economic Processing Zones Association (WEPZA), and included in the Multi-donor Investment Climate Advisory
Service of the World Bank Group, Special Economic Zones: Performance, Lessons Learned, and Implications for Zone
Development, 2008.

Congressional Research Service                                                                                     1
U.S. Foreign-Trade Zones: Background and Issues for Congress
Although the rules vary by country, the general mechanism that makes them function together in
international co-production is that while zones are located inside the geographic boundaries of
countries, they are generally declared to be outside of these countries for customs purposes. Thus,
components may be shipped into a zone—and sometimes shifted around the world from zone to
zone on their way to becoming a finished
Examples of How the World Zone Network
product—without concern for tariffs, quotas, Functions
and detailed customs procedures, until they (Text Box 2)
finally exit the zone system. Only then are 1) Suppose buttons from Indonesia and fabric from India
tariffs payable, quotas honored, and full are sent to a trade zone in the Philippines for assembly
customs procedures applicable. (See Text Box 2 into a shirt which is then exported to the United States.
for examples of the use of one or more zones No tariffs are payable in the Philippines, and all customs
procedures are streamlined until the completed shirt
in a production chain.) enters the United States for consumption.
Some analysts argue that free trade zones, in If, when shipped to the United States, the shirt first
enters a U.S. FTZ, taxes and tariffs are only payable if the
bypassing many of the complexities of shirt is eventually imported for consumption—that is,
individual country tariff assessments and when it exits the FTZ into the customs territory of the
customs procedures, have been one factor United States. It might enter an FTZ for purposes of cost
facilitating global supply chains. Today, free savings, for example, if more work is required (e.g.,
trade zones employ at least 66 million workers laundry labels); if some of the shirts were damaged in
shipment and will be discarded; or if a company wants to
worldwide, including 320,000 in the United store them for later use (e.g., Christmas sales) and
States. Most zones are located in developing postpone tariff payment.
countries, and most, but not all, of their
2) Similarly, for the production of gasoline, imported
workers are in manufacturing. Although these crude oil is entered into a refinery which has applied for
workers represent a substantial percentage of and received status as an FTZ subzone (i.e., a site
the worldwide manufacturing population, their approved for a specific company or use). The tariff
exact share is difficult to estimate.3 Figure 1 structure on refined oil products varies, such that some,
like gasoline, have much higher tariffs than crude oil,
shows worldwide employment apportionment
while others, including certain petrochemicals, have a
across zones by geographic region in 2006, the zero tariff, and hence an inverted tariff structure. If the
most recent data available. It shows that China refined products exit the zone and are imported into
accounted for more than 60% (40 million) of U.S. customs territory, the company can choose to pay
world employment in zones; the rest of Asia tariffs on the crude oil that initially entered the zone, or
the tariffs (if any) on the refined goods. In addition,
accounted for 22% (15 million); Mexico and chemicals distilled from the crude may stay in the zone
Central America for 8% (5.3 million); and the or be transferred to a chemical manufacturing facility
Middle East/North Africa for 3% (1.7 which is in a nearby subzone for further refining. In the
million); while the United States accounted for refinery process, as in other production processes in
0.5% (320,000).4 FTZs, tariffs are not payable on any waste products.
Source: Examples were constructed by CRS to illustrate
possible scenarios.
3
The ILO estimated a number of years ago that there are about 160 million manufacturing workers worldwide. Source:
G Betcherman, An Overview of Labor Markets World-Wide, 2001. Another difficulty in estimating total world
manufacturing employment is that data reports from many countries lag the current year by as much as 10 years.
4
This number represents about 3% of all U.S. manufacturing employment for 2006 as well as for 2011.
Congressional Research Service 2U.S. Foreign-Trade Zones: Background and Issues for Congress
Figure 1. World Geographic Distribution of Employment in Free Trade Zones, 2006
Source: ILO Database on Export Processing Zones (Revised), by Jean-Pierre Singa Boyenge, Working Paper
251, 2007. The database lists no zones for Canada, although some FTZ-like programs exist. See Virtuosity
Consulting, Canada/US Comparison of Foreign Trade Zone (FTZ) Related Programs and Policies, March 31, 2009.
Similarities and Differences Among Free Trade Zones Worldwide
Free trade zones around the world are similar in the way they function to facilitate trade. They
differ, however, in size, economic development purposes, physical characteristics, government
incentives, and the final dispensation of their products. They may represent large shares of the
country’s manufacturing employment and occupy huge geographic areas, as with special
economic zones in China; or they may be small enclaves housing a few businesses. In developing
countries with little infrastructure, they may be self-sufficient city-like industrial complexes with
housing, dining, and banking, as well as production and/or transport. In developed countries, on
the other hand, with extensive infrastructure and modern facilities, they are more narrowly
limited to production and/or transport. In the United States, instead of being tied to a specific
physical location near port facilities, FTZ designation can quickly and simply be brought to a
company, wherever it may be located. All zones typically include streamlined customs procedures
and exemption or deferral of tariffs and quotas on stored inventory. Those in developing countries
are more likely to have additional incentives such as subsidies, more flexible labor market
regulations, and additional tax exemptions.5 While developing countries typically produce for
export, as countries develop, they are increasingly likely to consume (“import”) substantial shares
of products made in their free trade zones.
5
Subsidies may conflict with some World Trade Organization (WTO) rules, and more flexible labor market regulations
may conflict with “best practices” as outlined by the International Labor Organization and the OECD. See, for
example, OECD. Export Processing Zones: Past and Future Role in Trade and Development, by Michael Engman,
Osamu Onodera, and Enrico Pinali, Trade Policy Working Paper No. 53, 2007, p. 8.
Congressional Research Service 3U.S. Foreign-Trade Zones: Background and Issues for Congress
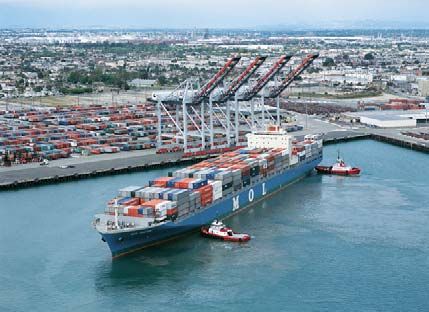
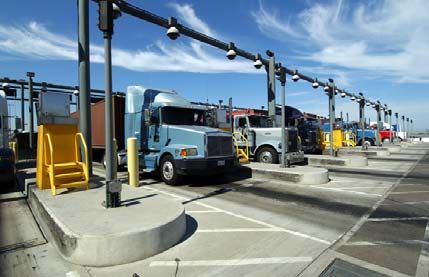
Elements common to many free trade zones can be seen in Figure 2, below. They include
container ships, which can often hold 1,000 to 1,500 containers each, and their automated loading
operations; liquid storage tanks (for oil or chemicals, for example); and facilities for transferring
individual containers to trucks or to railroad cars.
Figure 2. Elements of Modern Trade Zones
Container Ship Being Loaded Ship Arriving at Terminal
Liquid Bulk Terminals Trucks Loaded with Containers
Source: Stock photos from the “LA the Port of Los Angeles” newsroom at http://www.portoflosangeles.org/
newsroom.
Growth of Free Trade Zones Worldwide
The growth of zone use over time has resulted from a combination of factors including an initial
conceptual design that has stood the test of time; an international mechanism for teaching
governments how to establish zones that would attract foreign investors; and major advancements
in technology that have supported the globalization of production. Figure 3 shows the rate at
which these factors combined to explode zone use in the past 20 years.
Modern day zone growth began with an “experiment” in 1959, for reuse of the Shannon, Ireland,
airport.6 Designed as a job creation program, it proved so successful that an entrepreneur from the
6
Free trade zones had been used in the Roman Empire and during the Middle Ages, primarily for storage, trans-
shipment, and re-export of goods produced elsewhere. ILO, Economic and Social Effects of Multinational Enterprises
in Export Processing Zones, 1988, p. 1-3.
Congressional Research Service 4U.S. Foreign-Trade Zones: Background and Issues for Congress
Shannon project was asked to help promote the concept through the United Nations. As an
advisor to the UN Industrial Development Organization (UNIDO), he reportedly both prepared a
manual on zone creation and took part in a number of zone-establishing missions in various
countries.7 The United States government reportedly helped spread the concept of world
processing zones when, between 1983 and 1995, five U.S. agencies provided loans and
investment support for zone development: the U.S. Agency for International Development
(USAID); the Overseas Private Investment Corporation (OPIC); the Export-Import Bank; the
Department of State; and the Department of Commerce.8 Technological developments, including
a worldwide telephone/computer/data processing network and advancements in container
shipping and other types of transportation encouraged and supported the growth of zones
worldwide. Other forces responsible for the proliferation of free trade zones, as identified by the
OECD, include the increasing emphasis on both export-oriented and foreign direct investment-
oriented growth, the transfer of production of labor intensive industries from developed to
developing countries, and the growing international division of labor and incidence of global
production networks.9
Figure 3. Growth of the World Free Trade Zone System: 1959-2006
Source: United Nations and ILO data. See “Africa, Industrial Policy, and Export Processing Zones: Lessons from
Asia,” by Howard Stein, Center for Afroamerican and African Studies, University of Michigan, July 2008; and ILO,
Economic and Social Effects of Multinational Enterprises in Export Processing Zones, 1988, p. 1-2.
Notes: The two countries with zones in 1959 were the United States and Ireland. This ILO zone count excludes
early numbers of U.S. zones, which numbered 3 in 1959, 6 in 1965, and 9 in 19970.
7
Ibid., p. 1-3. Later, the World Export Processing Zones Association (WEPZA), originally established by UNIDO, was
spun off to become a U.S.-run private, non-profit organization dedicated to assisting the successful development of
export processing zones throughout the world. Source: WEPZA website at WEPZA.org.
8
Walter H. and Dorothy B. Diamond, Tax-Free Trade Zones of the World, Unz & Co., 1997, Introduction, p. 33.
Between 1977 and 1997, this continually updated three-volume set provided technical information for each country.
9
OECD, Export Processing Zones: Past and Future Role in Trade and Development, by Michael Engman, Osamu
Onodera, and Enrico Pinali, OECD Trade Policy Working Paper, No. 53, 2007, p. 8
Congressional Research Service 5U.S. Foreign-Trade Zones: Background and Issues for Congress The U.S. Foreign-Trade Zone Program History The U.S. FTZ Program was created by the U.S. Foreign-Trade Zones Act in 1934 (P.L. 73-397, 19 U.S.C. 81[a]-81[u]),10 in the midst of the Great Depression. It was designed to accelerate U.S. trade in the wake of the restrictive impact of the Smoot-Hawley Tariff Act of 1930, which raised U.S. tariffs on imported goods as high as 53%.11 It created the FTZ Board, which was given the power to approve applications for zone status. The act, fewer than six pages in length, also entitled each U.S. port of entry to at least one zone, and prescribed physical conditions and standards for each zone, activities permissible in zones, the applicability of all U.S. laws to zones, and requirements for zone operation and recordkeeping. The FTZ program started slowly. By the time the Shannon experiment was underway 25 years later in 1959, it was still quite small. Gradually, several factors accelerated zone use, including both internal changes to the program itself and external world factors. Internally, four major things happened. The first and likely the most significant of these factors was changing the program to allow for manufacturing. When the FTZ Act was passed in 1934, it prohibited manufacturing in zones because some feared it would promote imports of cheaper components to be used in the U.S. manufacturing process. At the time, it was argued that U.S. manufacturers of domestic components would be put at risk. That model, however, failed to attract many users. Then, in 1950, Congress amended the FTZ Act to permit manufacturing in zones. Two years later, in 1952, the FTZ Board took that amendment one step further. By issuing new regulations, it created the concept of subzones, administratively linked to zones, but physically separated. It was a way to take zones to the businesses. Additional FTZ growth was encouraged by two U.S. Treasury Department administrative decisions in 1980 and 1982. These clarified that manufacturers need not pay duty on either value-added or brokerage or transportation fees connected with imported goods.12 External factors that accelerated FTZ use by U.S and foreign multinational corporations included (1) increased international price competition that led U.S. businesses to seek new ways of saving costs13; (2) greater education of businesses in the ways in which they could save money through zone use; and (3) advancements in technology which made cooperative global production possible. 10 Regulations issued by the U.S. Foreign-Trade Zones Board for establishing and maintaining a foreign-trade zone can be found at 15 CFR 400. 11 Beth V. and Robert M. Yarbrough, The World Economy: Trade and Finance (Harcourt Brace, 1991), p. 368. 12 GAO, Foreign-Trade Zones Growth Primarily Benefits Users Who Import for Domestic Commerce, GAO/GGD 84- 52, March 2, 1984, p. 12. 13 U.S. Congress, House, Committee on Government Operations, Foreign-Trade Zones (FTZ) Program Needs Restructuring, House Report 101-363, November 16, 1989, p. 11. Congressional Research Service 6
U.S. Foreign-Trade Zones: Background and Issues for Congress

The FTZ System Today
Today, the bulk of U.S. FTZ activity occurs in subzones. Subzones, which carry all zone benefits,
consist of a site or sites that are designed for a specific company or use for either warehousing or
manufacturing. They account for 85% of all merchandise received in zones and 74% of all zone
exports. Across the United States there are 132 active zones, which support an additional 263
subzones. See Table A-1 for a comparison of zone and subzone activity

All states have at least one zone and 45 states have at least one subzone.14 Hence, every state has
some involvement in the zone system in which foreign and domestic status inputs are combined
to make other products. The majority of inputs into zones are of domestic origin (58% or $311
billion) with the remaining inputs (42% or $223 billion) coming from foreign sources. The zone
system accounts for 12% of all foreign goods entering the United States and employs roughly
320,000 workers, representing about 3% of U.S. manufacturing workers in 2010—most but not
all FTZ employees are in manufacturing. See Text Box A-1 for details on how FTZs function in
terms of moving goods into and out of zones.

                              Figure 4. U.S. Foreign-Trade Zones, by State
                                               (Approximate Location)

       Source: International Trade Administration, Department of Commerce.
       Notes: The map is not to scale. The purpose is to show the approximate location and number of Foreign-Trade
       Zones in each state.

14
     All states except Montana, Rhode, Island, South Dakota, Utah, and Wyoming have at least one subzone.

Congressional Research Service                                                                                   7
U.S. Foreign-Trade Zones: Background and Issues for Congress
Growth in FTZ Usage and Industry Concentration
Between 1993 and 2008, total foreign and domestic zone inputs increased seven-fold. Much of
that increase was due to inflation in the price of crude oil over those 15 years. Figures 5, 6, 7,
and 8 examine the contributions of foreign and domestic inputs to zone output. From these
graphs, several additional observations can be made about zone usage and industry concentration
between 1993 and 2011.
• More U.S. FTZ inputs are produced in the United States than are imported. Figure 5
shows that FTZs are primarily places where smaller shares of foreign inputs (light blue
bars) are combined with larger shares of domestic inputs (dark blue bars).
• Most U.S. FTZ outputs are consumed in the United States. This is in contrast to
export processing zones which predominate in developing countries, and from which
most outputs are exported. Figure 6 shows that most of zone output enters the U.S.
domestic market (dark blue bars). Only a small share of it is exported (light blue bars).15
• U.S. employment in zones (Figure 5, orange line) has remained relatively steady
since 1993. It rose somewhat during the early 1990s when substantial numbers of labor-
intensive auto production companies moved into zones, and has leveled off since then for
several reasons, including the following: First, since 1996 and 1997, FTZs have been
used increasingly by petrochemical companies making capital-intensive gasoline, diesel,
kerosene, and jet fuels (which benefit from tariff-free storage) and petrochemicals (which
benefit from the inverted tariff structure).16 Second, high levels of inflation in crude oil
prices, combined with some increase in productivity, have helped to raise the current
value of zone output, while decreasing employment slightly.
• The major foreign input into zones is crude oil.17 Figure 7 shows the current shares of
inputs in 2011, by major sector. It shows that crude oil accounts for 75% of all foreign
products brought into zones; auto components account for 6%; and other industries, led
by consumer electronics and machinery, account for the remaining 19%.18 The incentive
for importing crude oil into zones is to save money on the inverted tariff structure
applying to the small share (16%) of petrochemicals refined from the crude oil. There are
no inverted tariff benefits from the refining of gasoline, diesel, kerosene, and jet fuel,
which account for most of the output (84%) from crude oil.
• When oil inputs are deflated19 to constant dollars, the real (as compared with
current) dollar value of foreign inputs into zones shrinks dramatically. Figure 8
compares the value of foreign inputs into zones in current 1993 dollars, in current 2011
15
These data exclude value added, for which no figures are available.
16
Thus, importers can pay the duty-free rate on the final chemicals, instead of the 5.25 or 10.5 cents per barrel that
applies to the imported crude oil. However, import tariffs on gasoline and other oil refinements are higher than the
tariffs on crude oil, and hence for the share of crude oil used to produce such products, refineries can pay the tariff on
the crude rather than the refined products. For auto parts imported from non-free trade agreement countries, the tariffs
are typically higher on the imported components than on the completed vehicle.
17
If the oil component is removed from both FTZ imports and total imports, then remaining non-oil FTZ imports
account for just 0.4% of total non-oil U.S. imports.
18
Oil companies dominate FTZs because petrochemicals (products other than gasoline, diesel, jet fuel, and kerosene)
benefit from the inverted tariff structure.
19
Data for each sector were deflated using the Commerce Department’s National Income and Product Accounts Table
4.2.4 Price Indexes for Exports and Imports of Goods and Services by Type of Product.
Congressional Research Service 8U.S. Foreign-Trade Zones: Background and Issues for Congress
dollars, and in 2011 data deflated to constant 1993 dollars. It shows that in 1993, $27
billion in foreign inputs entered FTZs (first bar). In 2011, the value of those inputs into
FTZs was $302 billion. However, once the effect of rising crude oil prices has been
netted out, that figure falls to $96 billion in constant 1993 dollars. In addition, Figure 8
shows that the apparent dominance of crude oil is primarily due to inflation in the cost of
crude oil between 1993 and 2011.20
Figure 5. FTZ Input: Figure 6. FTZ Output:
Foreign and Domestic Components, and Shipment to the U.S. Market, and Exports,
Employment Levels, 1993-2010 1993-2010
(Current $; right axis for Employment) (Current $)
700 600 700
Domestic Inputs
600 600 For U.S. Market
Foreign Inputs 500
Exports
Employment
500 500
E m p lo y e e s (T h o u s a n d s )
400
400
$ B illio n s
400
$ B illio n s
300
300 300
200
200 200
100
100 100
0 0 0
19 3
19 4
19 5
19 6
19 7
19 8
20 9
20 0
20 1
20 2
20 3
20 4
20 5
06
20 7
20 8
20 9
10
19 3
94
19 5
19 6
19 7
19 8
20 9
20 0
20 1
20 2
20 3
20 4
20 5
06
20 7
20 8
09
10
9
9
9
9
9
9
9
0
0
0
0
0
0
0
0
0
9
9
9
9
9
9
0
0
0
0
0
0
0
0
19
20
19
19
20
20
Year Year
Source: U.S. FTZ Board, Annual Reports to Congress.
Note: Value added and adjustments for “waste” are not included in these figures.
20
For the third bar, each of the three major inputs was deflated using the Commerce Department’s National Income and
Product Accounts Table 4.2.4 Price Indexes for Exports and Imports of Goods and Services by type of Product. While
there are no comparable data for the relative importance of these commodities among “domestic inputs,” some level of
foreign oil is included in this group along with domestically produced oil. Foreign oil is included because crude oil
imports may be entered into zones as “domestic” inputs if they are brought into the United States tariff free under a free
trade agreement or other trade preference program.
Congressional Research Service 9U.S. Foreign-Trade Zones: Background and Issues for Congress
Figure 7. FTZ Foreign Input Shares, Figure 8. FTZ Foreign Input Levels,
2011 1993 & 2011
($302 Billion in Current $) (Current & Constant 1993 $ in Billions)
350
302
Other 300
19%
250 Other
Oil
Autos 200 Autos
6%
150
96
100
Oil
75% 50
27
0
1993 Current $ 2011 Current $ 2011 in 1993 $
Source: USITC Dataweb and FTZ Annual Reports.
Notes: Data for each sector were deflated using the Commerce Department’s National income and Product Accounts
Table 4.2.4 Price Indexes for Exports and Imports of Goods and Services by Type of Product.
Overall Economic Benefits and Costs of FTZs
FTZs primarily benefit some manufacturing firms and potentially could benefit the economy as a
whole with their savings possibilities. Savings from tariff reduction, administrative efficiencies,
tax benefits, and duty deferral may help U.S. corporations maintain operations in the United
States, and may attract foreign producers to establish manufacturing facilities in the United States.
In turn, this could help communities hold onto their manufacturing bases and secondary service
sector support systems and the jobs that go with them. Consumers may benefit from any cost
savings that may be passed along. Federal, state, and local tax revenues may benefit from
increased activity that the FTZs may generate.
Balancing these benefits of zone use are four potential costs to the U.S. economy. First, granting
tariff reductions on imported components might disadvantage domestic producers of competing
components whose products would otherwise be somewhat protected by the tariffs. Second, if
certain producers in an industry obtain zone status to save production costs, this could put other
domestic producers of the final products in the same industry at a competitive disadvantage.
Third, the tariff benefits companies enjoy by operating in FTZs can also result in some loss or
deferral of tariff revenue for the United States, although U.S. tariffs are generally low and
represent a very small share of government revenue.21 Finally, some economists might argue that
21
No estimates are available on the value of tarrifs foregone each year because of FTZ use. However, tariffs are still
payable on the share of FTZ imports that is ultimately entered into the United States for consumption. In FY2010,
according to the U.S. Customs and Border Protection, the duties payable on $209 billion dollars worth of imports
through U.S. FTZs was $1.1 billion.
Congressional Research Service 10U.S. Foreign-Trade Zones: Background and Issues for Congress
FTZs result in a market distortion—a misallocation of resources to benefit a small number of
businesses, especially oil companies. This issue is explored in greater detail in the “Current FTZ
and Worldwide Zone-Related Issues for Congress” section.
FTZ regulations try to avoid potential “costs” of the FTZ program through the FTZ application
procedures. The application process, administered by the FTZ Board, is explained in greater
detail later in this section.
Business Benefits and Costs of FTZ Status
Specific benefits of zones for individual
corporations producing in zones come Sources of Cost Savings for U.S. Foreign-Trade
from the law itself and the regulations Zone Users
implementing it. Costs come from (Text Box 3)
administrative requirements involved in Duty reduction on Inverted Tariff Situations: With specific
applying for and achieving zone status, authority, zone users may choose the lower duty rate when a
monitoring of zones by the Customs product is entered into customs territory (for importation) in
inverted tariff situations (when the tariff rate on foreign inputs is
and Border Protection, and reporting higher than the tariff rate applied to the finished product
requirements by the U.S. FTZ Board. produced in the zone).
There are no precise estimates of the Duty Deferral: Cash flow savings can result because customs
actual market value of the potential duties are paid only when and if the goods are transferred from
costs and benefits of FTZs in the the zone to U.S. customs territory for consumption.
United States or trade zones worldwide. Duty Exemption on Exports: No duty is payable on goods
which are exported from a zone or which are scrapped or
destroyed in a zone.
Benefits
Duty Drawback Elimination: Zones eliminate the need for
Text Box 3 describes seven potential duty drawback. That is, the refunding of duties previously paid on
imported and then re-exported merchandise.
benefits for companies using FTZs.
Most of the financial benefits come Tax Savings: Goods stored in zones and goods exported are
from three of the seven sources: duty not subject to state and local ad valorem taxes, such as personal
property taxes, where applicable.
reduction on inverted tariff situations,
customs inventory control efficiencies, Zone-to-Zone Transfer: Zones can transfer merchandise “in-
bond” (i.e., insured) from one zone to another. Customs duties
and duty exemption on exports. Other
may be deferred until the product’s eventual entry into U.S.
benefits include duty deferral, customs territory.
drawback elimination, tax savings,
Customs Inventory Control Efficiencies: Cost savings
quota storage, and zone-to-zone (especially cash-flow savings) can occur from zone efficiencies
transfer. Overall profits from FTZ use affecting inventory control. These efficiencies include customs
result from the combination of tiny procedures such as direct delivery and weekly entries.
savings per unit and high volume Source: U.S. Foreign-Trade Zones Board.
production.
Duty Reduction on Inverted Tariff Situations. Of all FTZ benefits, “duty reduction on inverted
tariff situations” is generally the one most heavily used by businesses. It likely accounts for more
than 50% of the total money saved from zone use, according to the FTZ Board.22 Duty reduction
on imports results because FTZ users can typically choose to pay either the tariff level that
22
This estimate is made by the FTZ Board based on information contained in new zone and subzone applications.
Calculating actual savings would require more extensive reporting on the part of zone users.
Congressional Research Service 11U.S. Foreign-Trade Zones: Background and Issues for Congress applies to the imported components, or that which applies to the finished goods.23 Savings can be considerable. A new Volkswagen production plant in Chattanooga, TN, that recently won FTZ status estimated that it could save $1.9 million, or $13 per car in inverted tariff savings, on producing 150,000 cars annually.24 In the oil industry, most inverted tariff benefits accrue to just a small sector—the petrochemical industry, which accounts for about 15% to 17% of total refinery yield.25 Due to the potential impact on domestic suppliers, prior FTZ Board authorization is required for these types of savings. There are no independent estimates of the cost savings derived from the FTZs. Customs and Inventory Efficiencies. Customs and inventory efficiencies, especially those obtained through “bundling” of entries (which are reports of individual shipments of goods entering or leaving zones), are another significant source of savings for FTZ users. In addition to time and paperwork savings, “bundling” allows an importer to file an entry for an entire week and pay a single merchandise processing fee (up to $485) instead of a separate entry and merchandise processing fee for each shipment. In this way, large-operation zone users can cut their processing fees by about 90%.26 The National Association of Foreign Trade Zones (NAFTZ) estimates that FTZs handle more than 10% of U.S. imports each year in terms of dollar value, but account for less than 1% of the actual number of import filings made with Customs and Border Protection (CBP), because of “bundling.” For a large company with 10 warehouses across the United States, each with several hundred deliveries per week, for example, bundling efficiencies could mean a reduction in processing fees from roughly “$2 million a year to about $25,000 per year.”27 Duty Exemption. Merchandise can be re-exported from a zone without the payment of duties, providing another significant source of savings to U.S. exporters. In addition, no duty is payable on goods that are imported into zones and ultimately consumed, scrapped, or destroyed in the 23 If the importer elects to pay the tariff rate as it would apply to the imported component, he claims “privileged” status; If he elects to pay the tariff rate as it would apply to the finished product, he claims “non-privileged” status. Example: If an importer claims “privileged status” on carburetors and fan belts entered into zones for incorporation into cars, then he would pay the “carburetors” and “fan belt,” tariff rates, respectively, on the imported value of these components when the auto actually leaves the zone. If he claims “non-privileged status,” he would pay the tariff rate applicable to the finished auto on the combined value of the carburetor and the belts when the finished auto exits the zone. 24 Volkswagen Could Save Nearly $2 million a Year in Tariffs, Timesfreepress.com, March 19, 2011. 25 Tariffs on crude oil depend on whether it is refined inside or outside FTZs, and whether or not it enters the United States under a free trade agreement or applicable trade preference program: If crude oil is refined in the United States, but not in FTZs, producers would pay the applicable tariff on the total value of the crude oil when it enters the United States (10.5 cents or 5.25 cents per barrel, depending on the crude oil), and then refine it to make the products— gasoline, diesel, kerosene, jet fuel, and petrochemicals. If crude oil is refined in the United States, but not in FTZs, and enters under a free trade agreement or trade preference program which exempts crude oil from tariffs, such as the Africa under the African Growth and Opportunity Act, no tariffs are payable. If, instead, crude oil is brought into the United States through FTZs, producers would first make gasoline, diesel, kerosene, and jet fuel from it and then pay the tariff on that share of the crude oil that went into these final products. They would not need to pay any tariff on the part of the crude oil that became petrochemicals, since no tariffs are payable on petrochemicals. 26 Merchandise processing fees (MPFs) are a percentage of the value of imported goods (0.21%), but cannot exceed $485. Thus, the single weekly entry reduces MPFs for companies whose weekly imports are valued at greater than $230,952.40—the amount required to get charged the maximum fee. The U.S. Department of Homeland Security, Customs and Border Protection, Foreign-Trade Zones Manual, Publication Number 0000-0559A, 2011, p. 34. 27 This estimate is based on CRS calculations of possible configurations that could lead to the savings quoted. The quote is from a spokesperson for Hillwood Properties, a real estate developer known for its FTZ development and management work around the Fort Worth Texas, in American Shipper, op. cit, p. 44. Congressional Research Service 12
U.S. Foreign-Trade Zones: Background and Issues for Congress

zone. For example, damaged packages or broken bottles can be removed from shipments of
packaged or bottled goods.28

Costs
According to the FTZ Board, the costs of FTZ use, and the “red tape” involved in order to take
advantage of zone opportunities, can be substantial. Therefore, companies need to weigh carefully
potential costs and benefits of zone use before applying for FTZ status. There are startup costs
and maintenance costs. Because of this, according to an FTZ trade interest group, FTZs work best
when a company can potentially see a return of 100% to 200% on investment in zone use. If the
investment return is smaller, it may not be worth the startup and continuing costs.29

Startup costs include (1) the application process (detailed in the next section);30 (2) background
checks for importers; (3) a physical security system—usually a fenced-in system with locks,
guards, and cameras; (4) an inventory control system and related software to track the movement
of products (which must be in place before CBP officially activates the operation); and (5)
consultants, for those who prefer their assistance in setting up and managing a zone.

Maintenance costs after full zone status is in effect include (1) greater oversight by CBP
officials;31 (2) at least one full-time person to manage a zone; (3) a “bond” payment, which is held
by the government as a guarantee against potential tariffs owed on products in FTZs,32 and (4)
annual fees by grantees for zone use. The FTZ Act requires zone grantees to operate zones as
public utilities, but grantees are able to charge zone users for costs associated with managing the
zone. Fees for zone users range from several thousand dollars up to $10,000 or more a year.33

The Administrative Mechanism Behind FTZs34
Several U.S. agencies are involved in administering the FTZ program. The FTZ Board is
responsible for the establishment, maintenance, and administration of zones under the FTZ Act.
The FTZ Board consists of two members: the Secretary of Commerce and the Secretary of the
Treasury. The Secretary of Commerce is the chairman and executive officer, and appoints the
28
   U.S. Department of Homeland Security, Customs and Border Protection, Importing into the United States; A Guide
for Commercial Importers, p. 153.
29
   American Shipper, IT in FTZ, op. cit., p. 44.
30
   Recent regulations have shortened the process for manufacturing authorizations from 1 year to 4 months, if no issues
are raised. In such cases, FTZ sites can be designated in as little as 30 days. The FTZ Board is available to help
applicants with the complexities of applying.
31
   Without zone status, the product is initially cleared when the entry and customs documents are filed. However, for
products entered into zones, there is a constant opportunity for CBP monitoring, especially when items enter or leave a
zone. Even if the product is not in an FTZ, however, companies may still be liable for CBP audits, and may have to pay
additional duties (i.e., anti-dumping or countervailing duties) well after a product has been imported. What is different
in an FTZ is that there is an extra layer of CBP oversight to make sure, for example, that the components or the finished
products do not enter the commerce of the United States before applicable duties are paid. All importers also have to
pay single or continuous bonds to ensure payment of customs duties.
32
   The cost of bond can be as high as $100,000 on large or high value operations.
33
   A grantee is typically a city, county, or economic development authority operating the zone in the public interest. A
grantee is responsible for uniform treatment for zone users.
34
   U.S. Department of Homeland Security, U.S. Customs and Border Protection, Foreign-Trade Zones Manual, various
pages.

Congressional Research Service                                                                                        13
U.S. Foreign-Trade Zones: Background and Issues for Congress

executive secretary (chief operating officer) of the FTZ Board, who is supported by a professional
staff of seven. The Secretary of the Treasury’s responsibilities relate to the protection of the
revenue as well as tariff and trade policy considerations.

The Department of Homeland Security’s Customs and Border Protection (CBP) acts as an advisor
to the FTZ Board and is responsible for direct oversight of zone activity and ensuring compliance
with the FTZ Act and all laws and regulations pertaining to zone use. CBP is responsible for
activating FTZs, securing them, controlling dutiable merchandise moving into and out of them,
and protecting and collecting the revenue. CBP is also responsible for ensuring that there is no
evasion or violation of U.S. laws and regulations governing imported and exported merchandise,
and ensuring that the zones program is free from terrorist activity. To this end, CBP, which is not
normally onsite at the zones, must sign off on every shipment into and out of a zone. CBP also
provides audits and compliance reviews of zone activity, including oversight of safeguards for
checking container seals and other security measures. Homeland Security’s Bureau of
Immigration and Customs Enforcement (ICE) is involved in a voluntary partnership with
companies in FTZs to combat unlawful employment, although the same immigration and labor
laws apply in FTZs as in any other U.S. location.35

Other agencies involved in the oversight of zone shipments include the Department of Agriculture
and the U.S. Food and Drug Administration.

Application for FTZ Status
The FTZ Board does not own or operate any zones. Rather, it provides grants of authority to
applicants to establish, operate, and maintain zones and subzones. Once a zone has been
established, the organization that applied for the zone is known as the “grantee.” Grantees are
public or private corporations that manage a zone locally. They provide and maintain facilities in
connection with the zone according to regulations established by the FTZ Board. Under FTZ
regulations, they are required to operate the zones as public utilities, with fair and reasonable
rates, make annual reports to the FTZ Board on their activities, and provide uniform treatment
under like conditions to zone users.

On February 28, 2012, the U.S. FTZ Board published in the Federal Register36 the first major set
of revisions to U.S. FTZ regulations since 1991. They were issued in part as a continuing
response to congressional oversight and issues identified by the House Ways and Means
Committee in 1989.37

While the new regulations address a variety of issues, they were designed primarily to streamline
the application process for manufacturers and distributors who want to operate in an FTZ or
establish a subzone. Currently, a company can obtain FTZ designation for its facility in as little as
30 days, although up to a five-month process may be required in certain circumstances. The five-
month process is still a significant reduction from the 10 to 12 months that would have been
required in the past. The revised regulations also reduce the timeline for applications for

35
   U.S. Department of Homeland Security, FTZ Manual, op. cit., various pages.
36
   15 CFR Part 400.
37
   For previous discussion on issues raised, see archived CRS Report RL30268, U.S. Foreign-Trade Zones: Current
Issues, by Mary Jane Bolle, p. 9.

Congressional Research Service                                                                                    14
U.S. Foreign-Trade Zones: Background and Issues for Congress

production authority from 12 months to 4 months (120 days), in part by reducing the amount of
information required in many instances. If issues are raised by concerned parties during the 120-
day application process, the applicant must then follow a lengthier in-depth procedure, similar to
what was required in the past. Major differences between old and new procedures are summarized
in Text Box 4 (below).

            Old and New Simplified Procedures for FTZ Production Authority
                                      (Text Box 4)
New Procedures
New, simplified regulations set up a 120-day (approximately four-month) timeline for all new applications to set up
manufacturing operations inside FTZs and Subzones. Under the new procedures, fewer types of information are
required to be submitted. Required information includes
   (1) the name of the company;
   (2) a summary of the activity; and
   (3) a list of imported components and finished products.
After the application is submitted to the FTZ Board, the executive secretary appoints an examiner who checks the
application, posts it on the FTZ Board website, and opens a comment period so all interested parties (government,
industry specialists, and other non-governmental organizations) can respond to any “public interest” issues. That is,
any concerns that the FTZ would not be in the public interest could be raised at this time. Because the FTZ Board is
small, the comments received are very important in the review process. To supplement this information, the
examiner may also consult industry specialists in government and consider the result of prior application in the
industry. The examiner prepares a report with recommendations to the FTZ Board. Approval may be subject to
specific restrictions to allow or limit certain activities to avoid a negative impact on domestic suppliers or
competitors. If issues are raised, applications can be subject to the more stringent 12-month process (below).
Old Procedures (Still Used If Issues are Raised in the 120-Day Production Review Process)
These procedures (which take about one year to conclude) require the applying company to show how the proposed
manufacturing activity would contribute to the U.S. economy through job creation or other means. Applicants would
be required to provide information on “economic factors” including:
   (1) employment impact;
   (2) exports and re-exports;
   (3) retention or creation of manufacturing or processing activity;
   (4) extent of value-added activity;
   (5) effect on import levels of relevant products;
   (6) foreign competition in relevant products;
   (7) impact on related domestic industry; and
   (8) technology transfers and investment effects (15 CFR §400.31(b)(2)).
The FTZ Board would then undertake a detailed analysis to determine whether allowing a manufacturing activity
would displace or cause harm to an existing U.S. company.
Source: Summarized from material included on the FTZ Board website.

Congressional Research Service                                                                                        15
U.S. Foreign-Trade Zones: Background and Issues for Congress Current FTZ and Worldwide Zone-Related Issues for Congress38 Current zone-related issues for Congress reflect the supply-chain role of free trade zones in a complex, increasingly integrated world. Congressional issues have both U.S. and worldwide aspects. Domestic issues include whether FTZs represent a misallocation of U.S. resources; whether data relating to zone use are sufficient; and the extent to which U.S. FTZ zone use affects U.S. employment and the competitiveness of U.S. firms. Internationally, congressional issues relate to the effectiveness of trade zones worldwide as a tool for economic development and global competitiveness and U.S. influence on worker rights issues in zones around the world through trade policy. Do U.S. FTZs Encourage a Misallocation of U.S. Resources? As noted above, the U.S. FTZ system was established in the 1930s with the goal of spurring U.S. commerce in the wake of the Great Depression and the high tariff regime established by the Smoot-Hawley Tariff Act. Today, U.S. tariff levels are among the lowest in the world and U.S. commerce is highly connected with the global economy. Given the changes that have occurred since its passage, Congress may choose to consider whether the FTZ system today still fulfills the original intent of the FTZ Act and furthermore, if it remains the best vehicle through which to do so. From a theoretical standpoint, efficiencies that reduce the cost of production increase productivity and benefit the overall economy—more is produced with less. When the FTZ system provides such gains in productivity to U.S. firms, the U.S. economy benefits. A problem may arise, however, to the extent that these FTZ benefits are not available to all U.S. producers. As with any system that confers specific benefits to some but not all producers in an economy, the FTZ system may cause a misallocation of productive resources. These potential distortions could be avoided by simply providing FTZ benefits to all U.S. firms. Though only a fraction of U.S. firms utilize the FTZ system, no firms are excluded from applying for FTZ status and hence the benefits are technically available to all U.S. firms. In reality, this may not be the case. As mentioned above, given the high startup costs associated with FTZ use, the system is most likely to benefit large firms with a high volume of production. The FTZ Board has tried to address some of these concerns regarding the accessibility of the program by simplifying its application procedure. If the ultimate goal is a greater reduction in U.S. tariffs, FTZs provide one, if not the most efficient, way to do so. Tariffs themselves can cause a misallocation of resources, and though economic theory would suggest the U.S. economy benefits when tariffs are eliminated, such action may be politically infeasible. Companies in import-sensitive industries may be negatively 38 Historical material in this and the following two sections is drawn from: U .S. General Accounting Office, Foreign- Trade Zone Growth Primarily Benefits Users Who Import For Domestic Commerce; GAO/GGD 84-52, March 2, 1984, and Foreign-Trade Zones Program Needs Clarified Criteria, GAO/NSIAD 899-85; U.S. International Trade Commission, The Implications of Foreign-Trade Zones for U.S. Industries and for Competitive Conditions Between U.S. and Foreign Firms, USITC Publication 1496, February, 1984; The Implications of Foreign-Trade Zones for U.S. Industries and for Competitive Conditions Between U.S. and Foreign Firms, USITC Publication 2059, February, 1988; and U.S. Foreign-Trade Zones Act, 19 U.S.C. 812-81u. Congressional Research Service 16
You can also read