UK Home Broadband Performance - The performance of fixed-line broadband delivered to UK residential consumers - Ofcom
←
→
Page content transcription
If your browser does not render page correctly, please read the page content below
UK Home Broadband Performance
The performance of fixed-line broadband delivered to
UK residential consumers

Research Report:
Publication Date: 9 May 2018
About this document
The report contains data and analysis regarding the performance of UK fixed-line broadband
services delivered to residential consumers in November 2017.

Specifically, it provides information on the average performance of ADSL, cable and fibre-to-the-
cabinet broadband packages, presented at a national level, as well as separately for a number of the
UK’s most popular ISP packages.

We have produced this report to provide consumers with useful information on the performance of
broadband services. We have also published a short consumer guide to home broadband, which
includes high-level summaries of some of the analysis in this report, and an interactive data
visualisation tool.

We publish this report in accordance with Ofcom’s duty to carry out and publish research on the
experience of consumers.
Contents
Section
Dashboard                                                1
Executive summary                                        2
Background                                               5
Overview of fixed broadband speeds                       7
Single-stream Netflix streaming performance              27
Disconnections                                           29
Performance by internet service provider (ISP) package   30
Other metrics affecting performance                      48

Annexes
Annex 1: Technical methodology                           69
Annex 2: Statistical methodology                         74
Annex 3: Glossary                                        89
UK fixed-line broadband performance, November 2017: Research Report

Dashboard

                                                                      1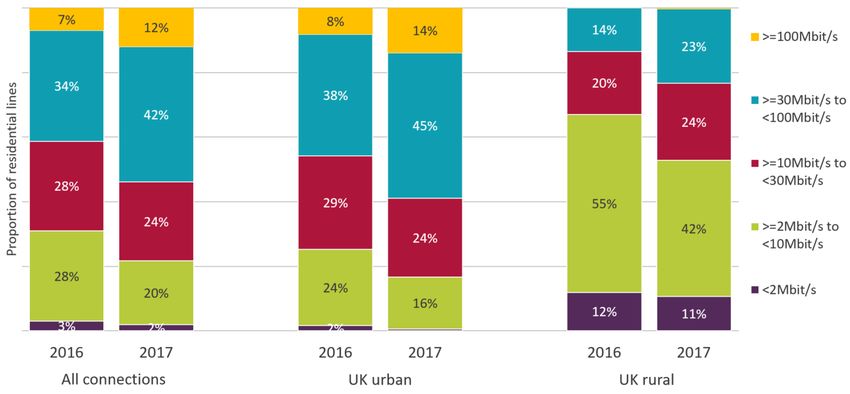
UK fixed-line broadband performance, November 2017: Research Report

Executive summary
More than four in five UK households1 have a fixed broadband service and they are putting ever-
increasing demands on their connections, with mean monthly data use per residential fixed
broadband connection increasing to 190GB, in the year to June 2017.2 The main driver of this
increase is growing take-up of over-the-top (OTT) video-on-demand TV services, including
subscription services which are used in over ten million UK homes.3
The availability of higher-speed fixed broadband services continues to improve. In our Connected
Nations Spring 2018 update,4 we reported that superfast broadband services offering predicted
download speeds of 30Mbit/s or higher were available to 93% of UK premises by January 2018.
However, many consumers continue to receive a poor fixed broadband user experience, due to the
technological limitations of the copper networks used to provide most fixed broadband services.
This is particularly true for consumers in rural areas, where there is lower availability (and take-up)
of superfast broadband than in urban areas.
We commission research to gain insight into the overall performance delivered by UK residential
broadband providers, and how this varies by a range of factors including geography, time of day,
technology and service provider.
This report is based on research undertaken in November 2017 in conjunction with our technical
partner, SamKnows Ltd. Data are collected from monitoring units connected to panellists’ routers
and this enables us to make robust assessments of the performance delivered to UK households.
However, care is required when interpreting the results, and they may not be wholly reflective of
the consumer experience, as performance is also determined by a number of factors that are not
captured by our research. These include signal degradation over wifi, in-home contention when
multiple devices are connected at the same time, device limitations and the performance of the
servers delivering content consumed over the connection.
Average actual fixed broadband speeds continue to improve
The average actual fixed broadband download speed delivered to UK homes continued to improve
and increased by 10.0Mbit/s (28%) to 46.2Mbit/s in the year to November 2017. Over the same
period, average upload speeds increased from 4.3Mbit/s to 6.2Mbit/s. The main driver for both
increases was the growing take-up of superfast fibre and cable broadband products, and the
proportion of lines receiving an average peak-time speed of 30Mbit/s or more increased from 41%
to 54% in the year to November 2017. Although superfast broadband is available to 93% of UK
premises, around two in five UK broadband connections are delivered using ADSL (i.e. over the
copper telephone wire between the telephone exchange and the end-user).

Differences in performance between urban and rural areas remain significant
Actual download speeds are typically lower than advertised speeds, and while only 3% of lines had
an advertised speed of less than 10Mbit/s in November 2017, 21% of UK home broadband
connections delivered an average download speed of less than 10Mbit/s. This is largely due to the
limitations of the technologies that deliver last-mile connectivity over the copper local loop, such as

1 https://www.ofcom.org.uk/__data/assets/pdf_file/0017/105443/uk-communications-market.pdf
2 https://www.ofcom.org.uk/__data/assets/pdf_file/0017/108512/connected-nations-fixed-broadband-2017.pdf
3 BARB Establishment Survey: Q4 2017
4 https://www.ofcom.org.uk/research-and-data/multi-sector-research/infrastructure-research/connected-nations-update-

spring-2018.
                                                                                                                   2
UK fixed-line broadband performance, November 2017: Research Report
ADSL and superfast fibre-to-the-cabinet (FTTC), although network congestion can also reduce the
speed of all connection types at busy times.
The proportion of lines receiving an average download speed of more than 30Mbit/s at peak times
was significantly lower for connections in rural areas of the UK (23%) than in urban areas (59%) and
while 17% of urban connections had an average peak-time speed of under 10Mbit/s, the proportion
was much higher in rural areas (53%).
The primary reason for these differences is the lower availability and take-up of superfast cable and
fibre services in rural areas, and our Connected Nations 2017 report shows that superfast broadband
was available to 95% of urban premises in May 2017,5 compared to 66% in rural areas. In addition,
longer average copper line lengths in rural areas mean that the speed of ADSL broadband tends to
be lower than in urban areas.
A download sync speed of at least 10Mbit/s and an upload sync speed of at least 1Mbit/s are the
specification for the Government’s proposed broadband universal service obligation (USO).
Responsibility for implementing the USO has now passed from Government to Ofcom. Ofcom
expects this implementation process to take two years.
Our research also shows differences in performance across the UK nations, with average actual
download speeds ranging from 33.4Mbit/s in Wales to 47.8Mbit/s in England (in Northern Ireland
the average was 39.2Mbit/s, while in Scotland it was 43.6Mbit/s).
Actual download speed varies by ISP services and technology
Our report also compares the performance of different ISP packages. We find that although
consumers can receive better performance by switching to a different technology or upgrading to a
service with a higher advertised speed, it is unlikely that they will experience a significant
improvement by switching from one ADSL or FTTC package to another at the same advertised speed
(as services will be provided over the same copper line).
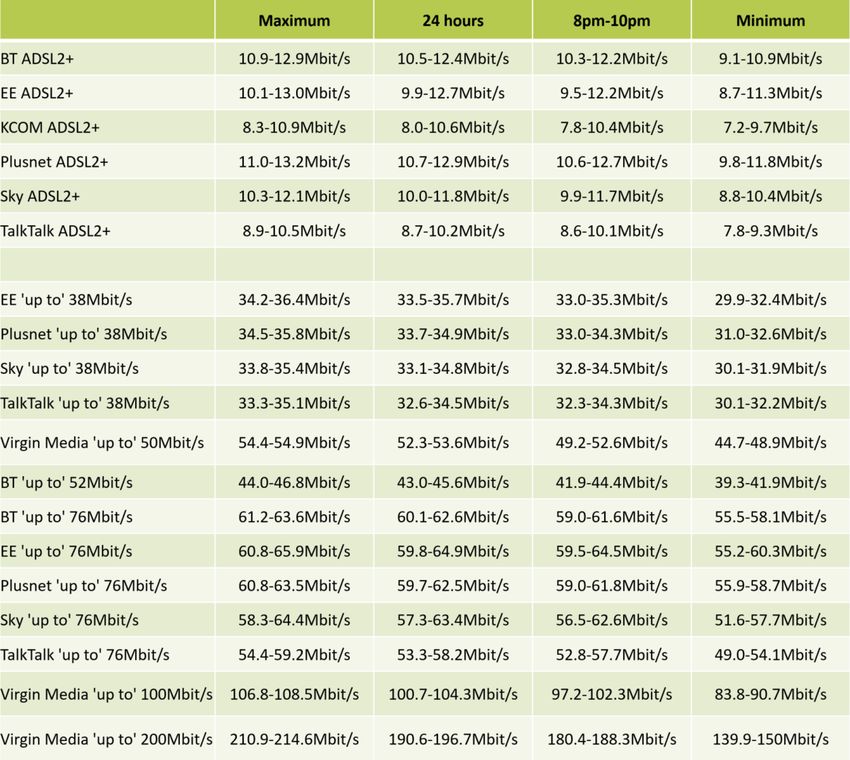
Virgin Media’s ‘up to’ 200Mbit/s cable service provided the fastest average download speed of the
packages included in the report,6 both over the whole day (193.6Mbit/s) and during the peak 8-
10pm period (184.3Mbit/s). Our analysis also indicates that average 24-hour ADSL download speeds
increased by 4% to 9.8Mbit/s in the year to November 2017, while ‘up to’ 38Mbit/s, 52Mbit/s and
76Mbit/s FTTC services had average speeds of 33.9Mbit/s, 44.3Mbit/s and 59.3Mbit/s respectively.
The average download speed of ‘up to’ 50Mbit/s cable connections was 52.9Mbit/s, while for ‘up to’
100Mbit/s cable services it was 102.5Mbit/s.
While cable connections had the highest downstream bandwidth, the highest average upload
speeds over 24 hours and during the 8-10pm peak-time period were recorded for ‘up to’ 76Mbit/s
FTTC services (both were over 16Mbit/s).
There was a notable improvement in cable connection performance at busy times
Average download speeds tend to fall during busy periods when broadband networks suffer the
effects of contention (network congestion). Across all connections, average 8-10pm peak-time
download speeds (44.9Mbit/s) were 92% of the average maximum speed (48.7Mbit/s). The
proportion of the maximum speed delivered during peak times varied by connection type, ranging
from 87% for ‘up to’ 200Mbit/s cable services (equivalent to 92% of the advertised speed) to 97% for
‘up to’ 38Mbit/s FTTC services.
5https://www.ofcom.org.uk/__data/assets/pdf_file/0017/108512/connected-nations-fixed-broadband-2017.pdf
6We did not have sufficient panellists to include Virgin Media’s ‘up to’ 300Mbit/s cable service, or any full-fibre FTTP ISP
packages, in this report.
3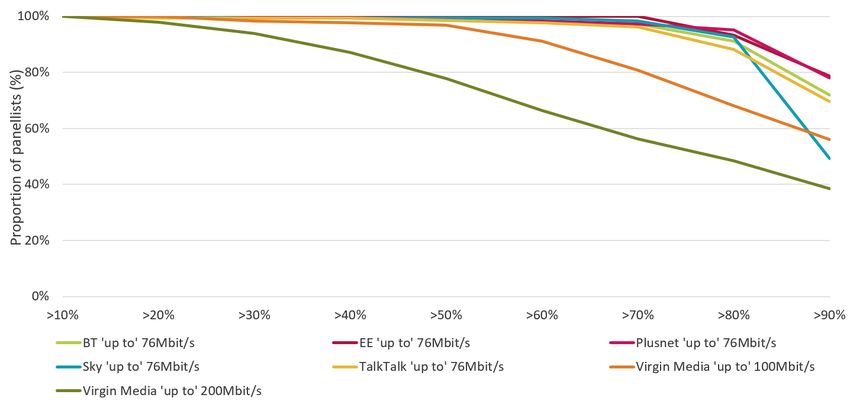
UK fixed-line broadband performance, November 2017: Research Report

In last year’s report, we highlighted that, despite average cable download speeds being higher than
those of ADSL and FTTC connections, a significant minority of cable connections received severely
degraded speeds at peak times. We attributed this to localised network congestion, as cable
network topology means than contention occurs closer to the end-user, making it more difficult to
add additional capacity. Our research shows an improvement in peak-time cable performance in
2017, suggesting that Virgin Media, the UK’s largest cable provider, has been investing in additional
network capacity.
In most cases, superfast products can stream Netflix videos at UHD resolution
The streaming of video content is one of the most bandwidth-hungry online activities for which
home broadband users regularly use their connection, and we ran tests to investigate the capability
of delivering Netflix video content. We found that more than 97% of single Netflix video streams
delivered over superfast FTTC and cable products were reliably delivered in ultra-high definition
(UHD) resolution during the 8pm-10pm peak-time period. For ADSL2+ services, 18% of streams were
delivered at UHD, and over three-quarters (76%) were delivered in high-definition (HD). It should be
noted that the streaming quality that can be reliably achieved may drop when multiple users are
simultaneously using the same connection.
Ofcom is committed to improving the availability and quality of fixed broadband services
Ofcom recently published a package of measures to further increase investment in full-fibre
broadband, following a range of recent commitments by broadband companies that could see up to
six million premises covered by full-fibre by 2020.7 According to these new rules, BT has a duty to
make its telegraph poles and underground tunnels open to rival providers, making it quicker and
easier for them to build their own full-fibre networks. In addition, Openreach, BT’s infrastructure
division, will have to repair faulty infrastructure and provide a ‘digital map’ of its duct and poles
network, so that other providers can plan where to lay fibre.
The UK’s largest ISPs are signatories to the voluntary Code on Broadband Speeds, which requires
that speed estimates are provided ahead of sale and gives consumers the right to exit their contract
penalty-free if speeds fall below a minimum guaranteed level. A new version of the code was
approved in March 2018, including changes such as the provision of a minimum guaranteed
download speed at the point of sale, and improving the process of the right to exit.8

7 https://www.ofcom.org.uk/about-ofcom/latest/media/media-releases/2018/new-rules-boost-full-fibre
8 The codes of practice can be accessed at https://www.ofcom.org.uk/phones-telecoms-and-internet/information-for-
industry/codes-of-practice
                                                                                                                    4
UK fixed-line broadband performance, November 2017: Research Report

Background
Introduction
Ofcom’s principal duty under the Communications Act 2003 (the Act) in carrying out its functions is
to further the interests of UK citizens and consumers, where appropriate by promoting competition.
In doing so, we are required to secure several things, including the availability of a wide range of
electronic communications services, which includes fixed broadband services. We must also have
regard to the desirability of encouraging investment and innovation in relevant markets, the
availability and use of high-speed data services throughout the UK, and the interests of consumers in
respect of choice, price, quality of service and value for money.

The Act also requires us to make arrangements to find out about consumers’ experience in their use
of, and access to, electronic communications services, and we do this by carrying out research.
Subject to certain exceptions, we have a duty to publish the results of our research and to take
account of it in carrying out our functions.

To understand the performance of UK fixed-line residential broadband connections, we commission
research to measure and report on the consumer experience of using these services. Ofcom has
undertaken this research since 2008, using data collected by our research partner SamKnows
Limited (SamKnows) from a volunteer panel of UK residential broadband users. We believe that our
technical methodology (see Annex 1), combined with the scale of data collection and the
sophistication of the statistical analysis (see Annex 2), makes this a robust presentation of UK fixed-
line broadband performance, however, there are other ways in which broadband performance can
be measured.

For example, our Connected Nations reports, include analysis of broadband speeds based on
information on the ‘sync speed’ or ‘configured speed’ of each active line, which is provided to Ofcom
by ISPs. This approach gives a measure of the maximum connection speed achieved between the
ISP’s access network and the consumer’s premises, which does not vary significantly during the day
and is usually slightly higher than the ‘end-to-end’ line speed measurements we present here.

There are a number of limitations to the research that we present here. While our research
accurately represents the performance delivered to our panellists’ routers, it does not capture
certain important factors other than broadband network performance that can affect the end user’s
experience, such as wifi router performance. Similarly, there may be steps that consumers can take
to improve their user experience, such as replacing in-home wiring and moving their router to a
more suitable location.

BT free speed upgrades
From September to October 2017, BT rolled out speed upgrades to some of its ‘up to’ 38Mbit/s and
52Mbit/s BT Infinity 1 fibre-to-the-cabinet (FTTC) customers. Under the upgrade programme,
existing Infinity 1 customers whose lines were capable of supporting sync speeds greater than
55Mbit/s had their upload and download speeds upgraded to those offered by BT’s Infinity 2 ‘up to’
76Mbit/s service, free of charge. More than a million BT customers benefitted from this upgrade.

                                                                                                      5
UK fixed-line broadband performance, November 2017: Research Report
In this report, BT Infinity 1 panellists whose speeds were upgraded under the programme are
included in the “BT ‘up to’ 76Mbit/s FTTC” category. While the upgrades are positive for those who
received them, they are likely to have a number of knock-on effects on the reported results:
• As BT Infinity 1 panellists with higher-quality lines are likely to have been upgraded to its ‘up
to’ 76Mbit/s service, the remaining panellists on these packages are likely to have lower-
than-average-quality lines. As a result, the data in this report are likely to slightly understate
the performance that we would expect new customers signing up to BT’s ‘up to’ 52Mbit/s
FTTC service to receive.
• The upgrades also mean that BT ‘up to’ 76Mbit/s FTTC panellists are likely to have higher-
than-average-quality lines, resulting in an overstatement of the performance that we would
expect new customers buying this service would receive.
Likewise, upgraded customers may have experienced performance fluctuations and/or outages
following their upgrade as their router adjusted to optimise performance. For some BT ‘up to’
76Mbit/s panellists, this period of stabilisation will have occurred during the measurement period,
meaning that they may have experienced more variation in performance than usual. The metrics
that are likely to be affected by this stabilisation are:
• upload and download speeds;
• packet loss;
• disconnections; and
• minimum speed as a proportion of maximum speed.
Analysis undertaken by SamKnows shows that the results for upgraded BT ‘up to’ 76Mbit/s FTTC
panellists were consistent through the month, suggesting that any stabilisation period following the
upgrade has not had a material effect on our results.
Having undertaken comparisons of the average upload and download speeds of BT’s ‘up to’
52Mbit/s and ‘up to’ 76Mbit/s FTTC packages in November 2016 and November 2017, we have
found that:
• the average download and upload speeds of BT’s ‘up to’ 52Mbit/s FTTC service were lower
in November 2017 than in November 2016;
• the average download and upload speeds of BT’s ‘up to’ 76Mbit/s FTTC service were higher
in November 2017 than in November 2016; and
While these changes are in line with those that we might expect to result from changes in the mixes
in line quality for these services, following the recent upgrades, we are unable to conclude that they
are due to the upgrades rather than other service provision factors.
6UK fixed-line broadband performance, November 2017: Research Report
Overview of fixed broadband speeds
More than half of UK home broadband connections were superfast
products, or higher, in November 2017
• Continuing the trend from previous years, customers are upgrading (or being upgraded) to
higher-speed broadband packages, including cable and fibre superfast products.
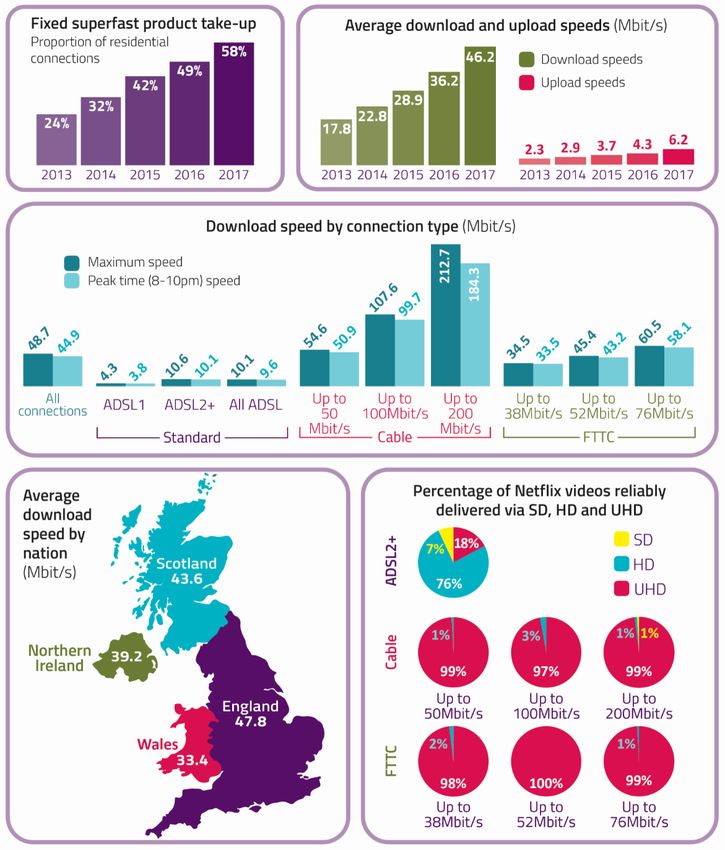
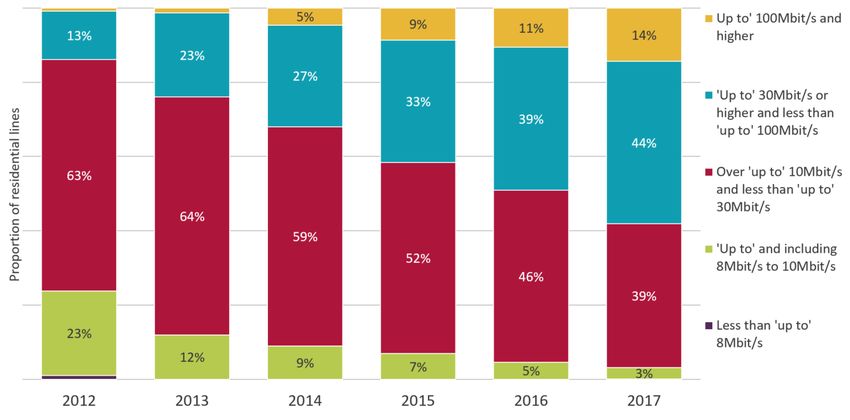
• In November 2017, 58% of UK home broadband connections were superfast products with
an advertised speed of ‘up to’ 30Mbit/s or higher, a 9pp increase since 2016
• Similarly, the proportion of home broadband connections with that had an advertised speed
of ‘up to’ 100Mbit/s or higher increased by 4pp to 14% during the year.
Figure 1: UK residential broadband lines, by advertised speed
Source: Ofcom / operators; see note [2] in the sources section
Growing take-up of higher-bandwidth services resulted in a 28%
increase in average download speeds during the year
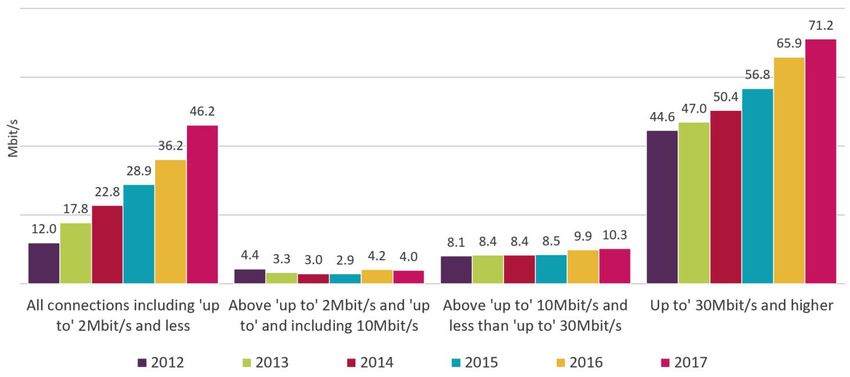
• The average actual speed of UK residential fixed broadband services recorded over the 24-
hour period increased by 28% to 46.2Mbit/s in the year to November 2017.
• This was a similar rate of increase to that recorded in the year to November 2016 (25%), but
this rate of increase may not be sustainable, as migration to superfast services may slow if
some households decide that standard broadband services are sufficient for their needs.
7UK fixed-line broadband performance, November 2017: Research Report
Figure 2: Average actual broadband speeds: November 2012 to November 2017
Source: Ofcom, using data provided by SamKnows; see note [1] in the sources section
Cable connections had the fastest average download speeds in
November 2017
• Our analysis indicates that the average download speeds of ADSL, cable and FTTC
connections all increased in the year to November 2017.
• The increase in the average download speeds delivered by FTTC connections (up 1.1Mbit/s
to 46.0Mbit/s) was partly due to an increase during the year in the proportion of
connections that were higher-tier ‘up to’ 76Mbit/s products.
• Cable services experienced the largest proportional increase during the year, up 23% to
115.6Mbit/s, partly due to the introduction of a new ‘up to’ 300Mbit/s service, the UK’s first
widely available ultrafast product, in early 2017.
• The average speed of an ADSL connection increased by 0.4Mbit/s (4%) to 9.8Mbit/s during
the year.
8UK fixed-line broadband performance, November 2017: Research Report
Figure 3: Average download speeds for fixed broadband connections, all connections including ‘up
to’ 2 Mbit/s and less, by technology
Source: Ofcom, using data provided by SamKnows; see note [3] in the sources section
Longer line lengths result in lower rural speeds for copper-based
technologies…
• The copper-based technologies used to deliver ADSL and FTTC connections suffer from
speed degradation as the length of copper over which data is transmitted increases, and due
to issues with the quality of some copper lines.
• In ADSL deployments, data travels over copper which runs all the way from the local
exchange to the end user’s premises, whereas in FTTC, copper is only used from the street
cabinet to the end-user.
• As a result, ADSL copper line lengths tend to be significantly longer in rural areas, where
population density is lower, than in urban areas. These variations are not as evident for
FTTC.
• The effects of these differences are evident when comparing ADSL performance in urban
and rural areas of the UK. For ADSL connections, the average 24-hour download speed in
urban areas (10.7Mbit/s) was 56% higher than the 6.9Mbit/s average in rural areas.
• There were no differences between average urban and rural FTTC download speeds.
• Most rural ADSL customers who are able to upgrade to FTTC will experience a significant
increase in performance when doing so (FTTC, on average, is more than six times as fast as
ADSL).
9UK fixed-line broadband performance, November 2017: Research Report
Figure 4: Average ADSL and fibre download speeds, by rurality: November 2017 (Mbit/s)
Source: Ofcom, using data provided by SamKnows; see note [4] in the sources section
Note: The chart bars show that there is a 95% probability that the actual average speed for all
consumers (i.e. not just the consumer panellists within our sample) falls within the ranges shown
…which, combined with lower superfast availability, results in
lower actual speeds
• Our research shows that over half (54%) of UK home broadband connections had an 8-10pm
peak-time average actual download speed of 30Mbit/s or higher in November 2017, up from
41% in November 2016.
• Similarly, 22% of home broadband connections had a peak-time average actual speed of less
than 10Mbit/s in November 2017.
• However, lower download speeds over copper broadband technologies and lower superfast
broadband availability in rural areas9 resulted in significant variations in performance
between urban and rural areas of the UK.
• Fifty-nine per cent of panellists in urban areas received an average 8-10pm peak-time speed
of 30Mbit/s or higher in November 2017, compared to 23% in rural areas, while 17%
received peak-time speeds of less than 10Mbit/s, compared to 53% in rural areas (down
from 67% in 2016).
9Our Connected Nations 2017 report (https://www.ofcom.org.uk/__data/assets/pdf_file/0017/108512/connected-
nations-fixed-broadband-2017.pdf) shows that superfast broadband was available to 95% of urban premises in May 2017,
compared to 66% in rural areas
10UK fixed-line broadband performance, November 2017: Research Report
Figure 5: Distribution of average peak-time, 8-10pm, fixed broadband download speeds, by
rurality: November 2016 and 2017
Source: Ofcom, using data provided by SamKnows; see note [5] in the sources section
Many rural consumers do not receive download speeds of 10Mbit/s
or higher
• Our research shows that, in November 2017, over half (53%) of panellists in rural areas of
the UK received an average 24-hour download speed of less than 10Mbit/s, which we
consider to be the speed which enables full participation in a digital society.
• This proportion was much higher than for the UK as a whole (21%) and the proportion in
urban areas (16%).
• However, many rural and urban consumers would be able to achieve higher speeds by
switching to fibre or cable services.
• In our Connected Nations Spring 2018 update,10 we reported that, by January 2018,
superfast broadband services offering predicted download speeds of 30Mbit/s or higher
were available to 93% of UK premises.
10 https://www.ofcom.org.uk/__data/assets/pdf_file/0017/113543/Connected-Nations-update-Spring-2018.pdf
11UK fixed-line broadband performance, November 2017: Research Report
Figure 6: Distribution of average fixed broadband download speeds, by rurality, November 2017
Source: Ofcom, using data provided by SamKnows; see note [5] in the sources section
Broadband performance varies across the UK nations
• Our research also compared average actual download speeds in England, Scotland and
Wales in November 2017 (rural and urban performance in Northern Ireland is not included
in this analysis as we were unable to recruit sufficient panellists to enable us to report
robustly on these areas).
• Our research showed that across England, Scotland and Wales overall, England had the
highest average fixed broadband download speed in November 2017, at 47.8Mbit/s.
• England also had the highest average urban and rural download speeds, at 51.3Mbit/s and
23.7Mbit/s respectively.
• Wales had the lowest overall and average urban download speeds in November 2017, at
33.4Mbit/s and 37.9Mbit/s respectively.
• The overall average download speed was 43.6Mbit/s in Scotland, while in urban and rural
Scotland it was 49.6Mbit/s and 16.0Mbit/s, respectively. This was the lowest average rural
download speed recorded among the nations).
• The overall average download speed in Northern Ireland was 39.2Mbit/s.
12UK fixed-line broadband performance, November 2017: Research Report
Figure 7: Average download speeds, by UK nation, and significant differences to a 95% level of
confidence: November 2017
All lines Urban Rural
Country Was faster than Was faster than Was faster than
England Wales Wales Scotland*
Scotland Wales* - -
Source: Ofcom, using data provided by SamKnows; see note [6] in the sources section
Note: The additional weights used to calculate these figures means that they are not directly
comparable to the UK average figures included elsewhere in this report; the chart bars show that
there is a 95% probability that the actual average speed for all consumers (i.e. not just the consumer
panellists in our sample) falls within the ranges shown; the table shows significant differences to a
95% confidence level; an asterisk (*) denotes that a difference is not significant to a (higher) 99%
level of confidence.
Three-in-ten connections in Wales had an average speed of less
than 10Mbit/s
• Northern Ireland had the highest proportion of connections receiving an average speed of
30Mbit/s or higher in November 2017 (52%), compared to 51% in England, 44% in Scotland
and 43% in Wales.
• Northern Ireland also had the highest proportion of connections receiving an average
download speed of less than 10Mbit/s in November 2017, at 30%, compared to 25% of
connections in Wales and 20% in England and Scotland.
13UK fixed-line broadband performance, November 2017: Research Report
Figure 8: Distribution of average fixed broadband download speeds, by nation: November 2017
Source: Ofcom, using data provided by SamKnows; see note [6] in the sources section
Note: The additional weights used to calculate these figures means that they are not directly
comparable to the UK average figures included elsewhere in this report.
Actual download speeds vary significantly throughout the day
• The performance of broadband services varies by time of day, with speeds slowing down
during busy periods when traffic volumes are highest.
• Across all connections, the average minimum speed (38.5Mbit/s) was 79% of the average
maximum speed (48.7Mbit/s).
• The average download speed recorded during the 8-10pm peak-time period was
44.9Mbit/s, 92% of the average maximum speed.
Figure 9: Average UK broadband speeds, by time of day: November 2017 (Mbit/s)
Source: Ofcom, using data provided by SamKnows; see note [1] in the sources section
14UK fixed-line broadband performance, November 2017: Research Report
Network slowdown affects all connection types
• Our research shows that all connection types recorded their lowest average speeds
between 8pm and 10pm in the evening.
• The average across all connections was lowest between 8pm and 8.59pm, at 96.1% of the
highest speed, which was recorded between 6am and 11.59am.
• The lowest speed over ADSL connections also occurred between 8pm and 8.59pm, at 96.7%
of the highest speed, which was recorded between 12am and 5.59am.
• For cable and FTTC lines, the effects of contention were most pronounced between 9pm
and 9.59pm, and the highest speeds occurred between 6am and 11.59am.
• For cable, the 9pm and 9.59pm average was 94.5% of the 6am to 11.59am average,
whereas for FTTC it was 97.4% of the 6am to 11.59am average.
Figure 10: Proportion of maximum speed delivered through the day: November 2017 (Mbit/s)
Source: Ofcom, using data provided by SamKnows; see note [3] in the sources section
Cable connection performance during busy times has improved
There are two main reasons why the majority of home broadband connections do not provide their
headline (advertised) speed throughout the day:
• For copper-based technologies such as ADSL and FTTC, the maximum speed that a line can
support is dependent on the length and quality of the line from the end-user’s home to the
local exchange (for ADSL) or street cabinet (for FTTC). Current Advertising Standards
Authority (ASA) guidelines require that the advertised speed is the maximum speed
available to at least 10% of the customer base for a broadband service. While at least 10%
of customers on a package must be able to receive its advertised speed, this means that,
potentially, up to 90% of customers might never be able to receive it.
15UK fixed-line broadband performance, November 2017: Research Report
• New ASA broadband advertising guidelines, which take effect on 23 May 2018, say that any
speed claims used in advertising should be based on the download speed available to at
least 50% of customers at peak times.
• Additionally, the actual speeds of all connection types tend to fall at busy times, when ISPs’
networks are busy. The variation in speeds at busy times is more notable for cable
connections, due to cable network topologies, which mean that network congestion occurs
closer to the customer (in the access network rather than the backhaul network) making it
more difficult (and expensive) to add the additional capacity required to alleviate the
effects of congestion.
Our research shows that 24-hour, peak-time and minimum download speeds were lower than the
average maximum and advertised speeds for all ADSL2+ and FTTC connections in November 2017.
There was more variation for the cable connections, with the 24-hour download speeds higher than
the advertised speeds for the ‘up to’ 50Mbit/s and 100Mbit/s cable services.
• During the 8pm-10pm peak-time period, ‘up to’ 38Mbit/s FTTC lines delivered an average of
97% of their maximum speed in November 2017, while for ‘up to’ 76Mbit/s FTTC lines this
proportion was 96% and for ‘up to’ 52Mbit/s FTTC connections it was 95%.
• This compared to 93% for ‘up to’ 50Mbit/s and 100Mbit/s cable connections and 87% for
‘up to’ 200Mbit/s cable services, equivalent to 102%, 100% and 92% of their respective
advertised speeds.
• All three cable services included in the report have shown an improvement in peak-time
download speeds since November 2016. For ‘up to’ 50Mbit/s cable services, the average
peak-time download speed increased by 22% to 50.9Mbit/s in the year to November 2017,
while for ‘up to’ 100Mbit/s and 200Mbit/s services the increases were 26% and 23%
respectively.
• ADSL2+ services, on average, achieved 96% of the maximum speed during peak times,
equivalent to 59% of their advertised speeds.
Figure 11: Variations in download speeds, by time of day: November 2017 (Mbit/s)
16UK fixed-line broadband performance, November 2017: Research Report
Source: Ofcom, using data provided by SamKnows; see note [7] in the sources section.
Note: Where a service’s average maximum speed is higher than the advertised speed of their service,
the advertised speed has been used to calculate the figures above the chart.
Contention varies by network technology
• We measure network slowdown during busy periods (contention) by comparing ISP
packages’ average minimum and maximum speeds, our assumption being that the primary
reason for any differences between the two is network congestion.
• For ‘up to’ 50Mbit/s, 100Mbit/s and 200Mbit/s cable services, minimum download speeds
represented 94%, 87% and 72% of their respective advertised speeds.
• For ‘up to’ 38Mbit/s and 76Mbit/s FTTC services, minimum download speeds were 90% of
their maximum download speeds respectively, while for ‘up to’ 52Mbit/s FTTC and ADSL2+
services these proportions were slightly lower, at 89% and 86% respectively.
Figure 12: Minimum speed as proportion of maximum speed (%): November 2017
Source: Ofcom, using data provided by SamKnows; see note [8] in the sources section
Notes: The chart bars show that there is a 95% probability that the actual average speed for all
consumers (i.e. not just the consumer panellists in our sample) falls within the ranges shown; where a
panellist’s maximum speed is higher than the advertised speed of their service, the advertised speed
has been used to calculate the figures above.
There is no variation between urban and rural connection in
slowdown during busy periods
• Across all UK residential fixed broadband connections, we found that there were no
statistically significant differences in contention between urban and rural areas of the UK in
November 2017.
• There were no differences between contention in urban and rural areas of the UK for
ADSL2+ and ‘up to’ 38Mbit/s FTTC connections: we did not have sufficient panellists to
allow us to compare urban and rural cable contention for the other package types.
17UK fixed-line broadband performance, November 2017: Research Report
Figure 13: Minimum speeds as a proportion of maximum speed, by rurality (%): November 2017
Source: Ofcom, using data provided by SamKnows; see note [9] in the sources section
Note: The chart bars show that there is a 95% probability that the actual average speed for all
consumers (i.e. not just the consumer panellists in our sample) falls within the ranges shown; where a
panellist’s maximum speed is higher than the advertised speed of their service, the advertised speed
has been used to calculate the figures above.
The effects of contention are equally evident across England,
Scotland and Wales
• Our analysis finds that there were no statistically significant differences in the levels of
contention between the UK nations in November 2017.
• This was the case overall, and when comparing contention in urban and rural areas in each
nation.
18UK fixed-line broadband performance, November 2017: Research Report
Figure 14: Minimum speeds as a proportion of maximum speed, by UK nation: November 2017
Source: Ofcom, using data provided by SamKnows; see note [10] in the sources section
Note: The chart bars show that there is a 95% probability that the actual average speed for all
consumers (i.e. not just the consumer panellists in our sample) falls within the ranges shown.
Upload speeds
Upload speeds are important to users who use real-time video communication services, or who
need to upload or share files.
The UK average upload speed increased by 21% in the year to
November 2017
• The average upload speed of UK residential fixed broadband services increased by
2.0Mbit/s to 6.2Mbit/s in the year to November 2017.
• The main drivers of this increase were growing superfast take-up and a 24% increase in the
average superfast product upload speed, from 8.1Mbit/s to 10.1Mbit/s.
• This was due to a higher proportion of FTTC lines being ‘up to’ 76Mbit/s connections, which
have a headline upload speed of 19.5Mbit/s, rather than the 9.5Mbit/s for lower-tier
services; the 2Mbit/s upload speeds of some legacy FTTC lines being upgraded to 9.5Mbit/s;
and growing take-up of Virgin Media’s 20Mbit/s upload ‘gamer’ services.
• The average upload speeds for ‘above ‘up to’ 2Mbit/s and up to and including 10Mbit/s’
and ‘above ‘up to’ 10Mbit/s and up to and less than 30Mbit/s’ were unchanged during the
year, at 0.5Mbit/s and 0.8Mbit/s respectively.
19UK fixed-line broadband performance, November 2017: Research Report
Figure 15: Average UK fixed broadband upload speeds
Source: Ofcom, using data provided by SamKnows; see note [11] in the sources section
Upload speeds vary widely by technology and speed tier
• There is significant variation in upload speeds between technology and service tiers.
• ‘Up to’ 76Mbit/s FTTC services recorded the highest average upload speeds in both the 24-
hour and 8-10pm peak-time periods (both 16.4Mbit/s), followed by ‘up to’ 200Mbit/s cable
services, at 12.6Mbit/s over 24 hours and 12.5Mbit/s in the 8-10pm peak-time period.
• The 24-hour and 8-10pm peak-time average upload speeds of ‘up to’ 38Mbit/s FTTC services
were both 8.0Mbit/s, while for ‘up to’ 52Mbit/s FTTC connections they were both 8.3Mbit/s.
• The 24-hour and peak-time averages for ADSL2+services were both 0.8Mbit/s.
20UK fixed-line broadband performance, November 2017: Research Report
Figure 16: Maximum, average, peak-time and minimum upload speeds by technology and service
tier: November 2017
Source: Ofcom, using data provided by SamKnows; see note [12] in the sources section
Note: The chart bars show that there is a 95% probability that the actual average speed for all
consumers (i.e. not just the consumer panellists in our sample) falls within the ranges shown.
Distribution of download speeds
The broadband speed received is determined by the underlying
technology of the service
• For ADSL2+ packages, just under half of the panellists (47%) received an average maximum
speed of less than 10Mbit/s in November 2017.
• Fifty-six per cent of ADSL2+ panellists received a minimum download speed below 10Mbit/s,
while 48% had an average 8pm-10pm peak-time download speed of less than 10Mbit/s.
21UK fixed-line broadband performance, November 2017: Research Report
Figure 17: Distribution of maximum, 8-10 pm, peak-time and minimum download speeds for
ADSL2+ packages (Mbit/s)
Source: Ofcom, using data provided by SamKnows; see note [13] in the sources section
Distribution of ‘up to’ 50Mbit/s cable connections’ maximum, peak-
time and minimum speeds
• For ‘up to’ 50Mbit/s cable connections, all panellists achieved a maximum speed of 45Mbit/s
or higher, and 79% received a similar minimum speed.
• No ‘up to’ 50Mbit/s cable lines received an average minimum speed of less than 10Mbit/s -
an improvement since November 2016, when 11% of lines did.
Figure 18: Distribution of maximum, peak-time and minimum download speeds for ‘up to’
50Mbit/s cable connections
22UK fixed-line broadband performance, November 2017: Research Report
Source: Ofcom, using data provided by SamKnows; see note [14] in the sources section
Distribution of ‘up to’ 100Mbit/s cable connections’ maximum,
peak-time and minimum speeds
• For ‘up to’ 100Mbit/s cable connections, 97% of the panellists achieved maximum speed of
90Mbit/s or higher.
• None of the ‘up to’ 100Mbit/s cable panellists received a minimum or average 8-10pm peak-
time speed of less than 10Mbit/s, down from 7% in November 2016.
• Fifty-six per cent of ‘up to’ 100Mbit/s cable panellists received a minimum speed of
90Mbit/s or higher.
Figure 19: Distribution of maximum, peak-time and minimum download speeds for ‘up to’
100Mbit/s cable connections
Source: Ofcom, using data provided by SamKnows; see note [15] in the sources section
Distribution of ‘up to’ 200Mbit/s cable connections’ maximum,
peak-time and minimum speeds
• For ‘up to’ 200Mbit/s cable connections, 99% of panellists achieved an average maximum
speed of 180Mbit/s or higher.
• Twenty-two per cent of ‘up to’ 200Mbit/s cable panellists received minimum speeds of
180Mbit/s or higher, and no panellists had an average minimum speed of less than
10Mbit/s.
23UK fixed-line broadband performance, November 2017: Research Report
Figure 20: Distribution of maximum, peak-time and minimum download speeds for ‘up to’
200Mbit/s cable connections
Source: Ofcom, using data provided by SamKnows; see note [16] in the sources section
Distribution of ‘up to’ 38Mbit/s FTTC connections’ maximum, peak-
time and minimum speeds
• For ‘up to’ 38Mbit/s FTTC connections, 72% of panellists achieved a maximum speed of
more than 35Mbit/s.
• No ‘up to’ 38Mbit/s FTTC panellists received a minimum speed of less than 10Mbit/s, and
34% received a minimum speed higher than 35Mbit/s.
24UK fixed-line broadband performance, November 2017: Research Report
Figure 21: Distribution of maximum, peak-time and minimum download speeds for ‘up to’
38Mbit/s FTTC connections
Source: Ofcom, using data provided by SamKnows; see note [17] in the sources section
Distribution of ‘up to’ 52Mbit/s FTTC connections’ maximum, peak-
time and minimum speeds
• For ‘up to’ 52Mbit/s FTTC connections, 23% of panellists achieved a maximum speed of
more than 50Mbit/s.
• No panellists received a minimum speed of less than 10Mbit/s, and 6% received a minimum
speed greater than 50Mbit/s.
Figure 22: Distribution of maximum, peak-time and minimum download speeds for ‘up to’
52Mbit/s FTTC connections
Source: Ofcom, using data provided by SamKnows; see note [18] in the sources section
25UK fixed-line broadband performance, November 2017: Research Report
Distribution of ‘up to’ 76Mbit/s FTTC connections’ maximum, peak-
time and minimum speeds
• For ‘up to’ 76Mbit/s FTTC connections, 39% of panellists achieved a maximum speed more
than 70Mbit/s.
• No panellists received a minimum speed of less than 10Mbit/s, and 17% of the panellists
received a minimum speed greater than 70Mbit/s.
Figure 23: Distribution of maximum, peak-time and minimum download speeds for ‘up to’
76Mbit/s FTTC connections
Source: Ofcom, using data provided by SamKnows; see note [19] in the sources section
26UK fixed-line broadband performance, November 2017: Research Report
Single-stream Netflix streaming performance
Video streaming services have become increasingly popular over the last few years, and the
streaming of video content is one of the most capacity-hungry activities for which consumers use
their broadband connection. To understand how well various fixed broadband connections handle
the streaming of video content, we measure the streaming performance of broadband connections
when accessing content from Netflix.
The charts below show the proportion of Netflix video streams that were delivered in the most
commonly available resolutions: standard definition (SD), high definition (HD) and ultra-high
definition (UHD) for each connection type.
It should be noted that these results represent the case where only one user is streaming on a
broadband connection, and the streaming quality that can be reliably achieved may drop when
multiple users are simultaneously using the same connection.
In most cases, superfast products can stream Netflix videos at UHD
resolution
• More than 97% per cent of FTTC and cable Netflix video streams were delivered at UHD
resolution during the 8pm-10pm peak-time period.
• For ADSL2+ services, around three-quarters of Netflix videos were streamed at HD
resolution during the 24-hour and 8-10pm peak-time period, while 18% of streams were
delivered in UHD (ADSL1 is not capable of supporting the speeds required for UHD).
• This suggests that ADSL2+ may currently be sufficient to meet the current broadband
requirements of some smaller households, as video streaming is one of the most data-
hungry uses of a broadband connection.
Figure 24: Proportion of Netflix videos reliably delivered at the given video quality, over 24 hours
and at peak times, by technology
27UK fixed-line broadband performance, November 2017: Research Report
Source: Ofcom, using data provided by SamKnows; see note [20] in the sources section
28UK fixed-line broadband performance, November 2017: Research Report
Disconnections
The average daily disconnections metric measures the frequency of broadband service
disconnections lasting longer than 30 seconds.
Users cannot undertake any online activities when their service loses internet connectivity, and
interruptions to the fixed broadband service can be inconvenient and frustrating for users.
It should be noted that that all not all disconnections are due to network performance: for example,
a panellist rebooting their router would be classified as a disconnection event by our test.
Superfast products tend to suffer from fewer disconnections than
standard services
• Our research shows that ADSL services tend to suffer from disconnections of 30 seconds or
longer more frequently than cable and FTTC services.
• In November 2017, ADSL connections had an average of 1.3 disconnections of 30 seconds or
longer per day (1.7 for ADSL1 and 1.3 for ADSL2+).
• This compared to averages of 0.2 or 0.3 across all of the cable and FTTC connection types
included in the analysis.
Figure 25: Average daily disconnections (30 seconds or longer). (Lower values indicate better
performance)
Source: Ofcom, using data provided by SamKnows; see note [21] in the sources section
Note: The chart bars show that there is a 95% probability that the actual average speed for all
consumers (i.e. not just the consumer panellists in our sample) falls within the ranges shown.
29UK fixed-line broadband performance, November 2017: Research Report
Performance by internet service provider
(ISP) package
Background
This section sets out the performance of individual ISP packages in terms of their connection speed,
comparing the average maximum, peak-time, 24-hour and minimum download and upload speeds
of ADSL2+, cable and fibre-to-the-cabinet (FTTC) ISP packages.
Panellist recruitment
We undertook additional panellist recruitment prior to the November 2017 measurement period;
one of the main purposes of this was to enable us to include one or more FTTP packages in the ISP
package comparisons in this section of the report. Unfortunately, we were unable to recruit
sufficient panellists to enable us to do this, including for KCOM, which has deployed FTTP to many of
its customers in Kingston-upon-Hull and the surrounding areas.
As such, the only KCOM package where we had sufficient panellist size to report was its ADSL2+
service, and the performance of these connections should not be taken as representative for KCOM
customers as a whole. FTTP services are available to over 75% of premises in the Hull area with the
highest speed residential packages advertised at ‘up to’ 400Mbit/s. Around half of KCOM’s
customers take fibre-based services.
We are also unable to include Virgin Media’s ‘up to’ 300Mbit/s cable service, the UK’s first widely
available ultrafast broadband service, in this report, due to not having enough panellists in
November 2017.
Other than connections provided by KCOM, the incumbent provider in Kingston-upon-Hull, all of the
ADSL2+ and fibre broadband packages included in the report are provided over the Openreach
copper line from the local exchange/street cabinet to the end user’s home.
This means it is unlikely that consumers will experience a substantial increase in the performance of
their service by switching from an ADSL or FTTC package to another with the same advertised speed,
unless the performance of their existing service is being limited by factors within their ISP’s control,
such as network congestion or the ADSL line configurations in their systems. This is because any such
services will be provided over the same copper line, whose characteristics will be a key determining
factor of the performance of any ADSL or FTTC broadband service delivered over it.
As mentioned previously, there are a number of limitations to our research, and it does not capture
certain important factors that help determine the end-user’s experience, such as wifi router
performance, and there may be steps that consumers can take to improve their user experience,
such as replacing in-home wiring and moving their router to a more suitable location.
Presentation of results
We present our findings in terms of bars showing the 95% confidence interval. This means that there
is a 95% probability that the actual average performance for all consumers (i.e. not just the
consumer panellists in our sample) falls within the ranges shown.
30UK fixed-line broadband performance, November 2017: Research Report
The sample size for each group, and the variation of performance among panellists within the same
group, combine to determine the size of the bars. We must emphasise that these bars indicate the
average (mean) performance rather than the range of performance delivered.
We have designed the sampling and statistical methodologies to allow us to compare ISP packages
on a like-for-like basis. For details, see the research methodology set out in Annex 1 and the
statistical methodology set out in Annex 2.
ADSL2+ connections: download speeds
The main variable affecting the speeds delivered by ADSL2+ is the distance from the exchange to the
end user’s premises, over which the ISP has no control. Therefore, when looking at fixed-line
broadband speeds, we exclude premises that are more than 5km from the local exchange, and we
normalise the test results by distance from the exchange, to enable a like-for-like comparison of ISP
packages. Further information on how we do this is in Annex 2 of this report.
Variation in performance of ADSL2+ packages
• The average actual 24-hour download speeds of the ADSL2+ ISP packages included in our
report ranged from 9.3Mbit/s for KCOM's service to 11.8Mbit/s for Plusnet’s.
• The largest drops in the 8-10pm peak-time speed were observed for BT, EE and KCOM’s
ADSL2+ services, for which the average 8-10pm peak-time speeds were 94% of the average
maximum speed.
• Sky’s ADSL2+ service had the highest average 8-10pm peak-time speed as proportion of the
maximum speed, at 97%.
31UK fixed-line broadband performance, November 2017: Research Report
Figure 26: Maximum, average, peak-time and minimum download speeds for ADSL2+ ISP packages
Maximum 24-hour average 8pm-10pm Minimum
ISP Was faster than Was faster than Was faster than Was faster than
Plusnet KCOM* & TalkTalk* KCOM* & TalkTalk* KCOM* & TalkTalk* KCOM* & TalkTalk*
BT TalkTalk* TalkTalk* TalkTalk* KCOM* & TalkTalk
Source: Ofcom, using data provided by SamKnows; see note [22] in the sources section
Note: The chart bars show that there is a 95% probability that the actual average speed for all
consumers (i.e. not just the consumer panellists in our sample) falls within the ranges shown; the
table shows significant differences to a 95% confidence level; an asterisk (*) denotes that a difference
is not significant to a (higher) 99% level of confidence.
Contention in ADSL2+ connections
• We measure contention by comparing average minimum and maximum speeds, our
assumption being that any difference between the two is due to network slowdown at busy
times.
• Plusnet’s ADSL2+ service had the lowest level of contention; average minimum speeds were
90% of the average maximum speed.
• The highest level of contention was for BT’s ADSL+ service, for which minimum speeds
averaged 84% of the maximum speed.
32UK fixed-line broadband performance, November 2017: Research Report
Figure 27: Minimum speed as a proportion of maximum speed for ADSL+ ISP packages, and
significant differences, to a 95% level of confidence: November 2017
ISP Was better than
Plusnet Sky* & BT*
Source: Ofcom, using data provided by SamKnows; see note [22] in the sources section
Note: The chart bars show that there is a 95% probability that the actual average speed for all
consumers (i.e. not just the consumer panellists in our sample) falls within the ranges shown; where a
panellist’s maximum speed is higher than the advertised speed of their service, the advertised speed
has been used to calculate the figures above; the table shows significant differences to a 95%
confidence level; an asterisk (*) denotes that a difference is not significant to a (higher) 99% level of
confidence.
Distribution of contention for ADSL2+ connections
• Among the ADSL2+ ISP packages included in our analysis, the proportion of panellists whose
connection had a minimum speed greater than 90% of its maximum speed ranged from 43%
for BT’s service to 61% for TalkTalk’s.
• The proportion of panellists whose connection had a minimum speed less than half its
maximum speed ranged from 0% for Plusnet and Sky’s ADSL2+ services to 3% for BT, KCOM
and TalkTalk.
33UK fixed-line broadband performance, November 2017: Research Report
Figure 28: Distribution of average minimum speed as a proportion of maximum speed, for ADSL2+
ISP packages
Source: Ofcom, using data provided by SamKnows; see note [23] in the sources section
Note: Where a panellist’s maximum speed is higher than the advertised speed of their service, the
advertised speed has been used to calculate the figures above.
Variation in performance of superfast broadband packages
• Our research indicates that 8-10pm peak-time average FTTC download speeds do not vary much
from their maximum speeds, and in November 2017, all of the FTTC packages included in our
research had an average peak-time download speed greater than 95% of their maximum speed.
• For the cable packages included in the research, maximum speeds were higher than for FTTC
packages in comparable service tiers, although there was more variation in peak-time speeds.
• Among the three cable packages included in our research, average peak-time speeds
represented between 87% and 93% of the average maximum speed (between 92% and 102% of
the advertised speeds).
• Peak-time connection slowdown in Virgin Media’s cable services was notably lower in November
2017 than in November 2016, suggesting that it has been investing in network upgrades.
34UK fixed-line broadband performance, November 2017: Research Report
Figure 29: Maximum, average, peak-time and minimum download speeds for ‘up to’ 30Mbit/s and
above ISP packages, and significant differences to a 95% level of confidence: November 2017
35UK fixed-line broadband performance, November 2017: Research Report
Maximum 24-hour average 8pm-10pm Minimum
ISP package Was faster than Was faster than Was faster than Was faster than
VM200 V100, EE76, BT76, V100, EE76, BT76,
V100, EE76, PN76, V100, EE76, PN76,
PN76, Sky76, TT76, PN76, Sky76, TT76,
BT76, Sky76, TT76, BT76, Sky76, TT76,
VM50, BT52, PN38, VM50, BT52, EE38,
VM50, BT52, EE38, VM50, BT52, PN38,
EE38, Sky38, TT38 PN38, Sky38, TT38
Sky38, PN38, TT38 EE38, Sky38, TT38
VM100 EE76, BT76, PN76, EE76, BT76, PN76,
EE76, PN76, BT76, EE76, PN76, BT76,
Sky76, TT76, VM50, Sky76, TT76, VM50,
Sky76, TT76, VM50, Sky76, TT76, VM50,
BT52, PN38, EE38, BT52, EE38, PN38,
BT52, EE38, Sky38, BT52, PN38, EE38,
Sky38, TT38 Sky38, TT38 PN38, TT38 Sky38, TT38
BT76 TT76*, VM50, BT52, TT76, VM50, BT52,
TT76*, VM50, BT52, TT76*, VM50, BT52,
PN38, EE38, Sky38, EE38, PN38, Sky38,
EE38, Sky38, PN38, PN38, EE38, Sky38,
TT38 TT38 TT38 TT38
EE76 TT76*, VM50, BT52, TT76*, VM50, BT52, TT76*, VM50, TT76*, VM50, BT52,
PN38, EE38, Sky38, EE38, PN38, Sky38, BT52, EE38, Sky38, PN38, EE38, Sky38,
TT38 TT38 PN38, TT38 TT38
PN76 TT76*, VM50, BT52, TT76*, VM50, BT52, TT76*, VM50, TT76*, VM50, BT52,
PN38, EE38, Sky38, EE38, PN38, Sky38, BT52, EE38, Sky38, PN38, EE38, Sky38,
TT38 TT38 PN38, TT38 TT38
Sky76 VM50, BT52, PN38, VM50, BT52, EE38, VM50, BT52, EE38, VM50*, BT52, PN38,
EE38, Sky38, TT38 PN38, Sky38, TT38 Sky38, PN38, TT38 EE38, Sky38, TT38
TT76 BT52, PN38, EE38, BT52, EE38, PN38, BT52, EE38, Sky38, VM50*, BT52, PN38,
Sky38, TT38 Sky38, TT38 PN38, TT38 EE38, Sky38, TT38
VM50 BT52, PN38, EE38, BT52, EE38, PN38, BT52, EE38, Sky38, BT52, PN38, EE38,
Sky38, TT38 Sky38, TT38 PN38, TT38 Sky38, TT38
BT52 PN38, EE38, Sky38, EE38, PN38, Sky38, EE38, Sky38, PN38, PN38, EE38, Sky38,
TT38 TT38 TT38 TT38
Source: Ofcom, using data provided by SamKnows; see note [24] & [25] in the sources section
Note: The chart bars show that there is a 95% probability that the actual average speed for all
consumers (i.e. not just the consumer panellists in our sample) falls within the ranges shown; the
table shows significant differences to a 95% confidence level; an asterisk (*) denotes that a difference
is not significant to a (higher) 99% level of confidence.
Contention in superfast broadband services
• Virgin Media’s ‘up to’ 50Mbit/s cable service had the lowest level of contention among the
superfast products included in our research, with average minimum speeds at 94% of the
advertised speed.
• Plusnet’s ‘up to’ 76Mbit/s FTTC service also performed well, with minimum speeds, on average,
representing 92% of panellists’ maximum speeds.
• The highest level of contention was observed for Virgin Media’s ‘up to’ 200Mbit/s service, with
average minimum speeds at 72% of the advertised speed.
36You can also read