UK TEA MARKET MARKET RESEARCH - Final Step Marketing
←
→
Page content transcription
If your browser does not render page correctly, please read the page content below
MARKET RESEARCH

UK TEA MARKET
Content

Introduction ……………………………………………………………………………. 3
Market Overview - Global Market …………………………………………………… 4
EU market ……………………………………………………………………………… 7
Tea Market in the UK ………………………………………………………………….      9
Supply Chain …………………………………………………………………………... 26
Trade channels …………………………………………………………………………. 31
Sustainability …………………………………………………………………………… 32
Competitors …………………………………………………………………………….. 34
Consumer Market Segmentation ……………………………………………………….. 45
Market Access Issues ………………………………………………………………….. 51
Sources ………………………………………………………………………………… 54

                                                          2
Introduction

        Tea is a very popular beverage—second only to water—and is consumed all around
the world. Millions of people are engaged in the production and processing of tea, and many
more rely on it for their livelihoods. West-European countries such as the UK and the
Netherlands have long, historical ties with the tea trade: Dutch merchants already became
familiar with tea in the 17th century during their journeys to the Far East, and the UK began
building fast ships especially to get tea from the Orient around 1840. Later, the British built
tea plantations in India and Sri Lanka (Ceylon, at the time), and the Dutch established
plantations on Java and Sumatra (KTIB website). Nowadays, the international tea trade is
largely in hands of multinational companies (MNC) with British and Dutch roots, e.g.
Unilever, Twinings and Tata Global Beverages.

        Tea in the UK is a big deal. We drink 60.2 billion cups of it every year1, and it’s a
cornerstone of British culture. Why not give it a try now?
        Now you’ve got your drink, let’s get back to the business of tea. We import
£251,889,836 worth in the stuff every year. From rich to poor, most of us enjoy it with us all
having our own methods for making it. We all have a favourite brand and Brits are famously
keen to put the kettle on in celebration, commiseration, to pass the time – and sometimes just
because we’re thirsty. Having said that, tea isn’t that big a deal economically speaking.
        The entire UK tea industry in the annual turnover of £748m, which is about 0.02% in
the entire country’s turnover. It employs 3,324 people across 27 businesses, while the fruit
juice industry has 7,071 workers across 111 companies.

    Source:https://www.crunch.co.uk/blog/freelancer-advice/2014/07/29/how-britains-tea-economy-pushed-the-
                                              world-boiling-point/

1
    http://www.tea.co.uk/tea-faqs

                                                                                                             3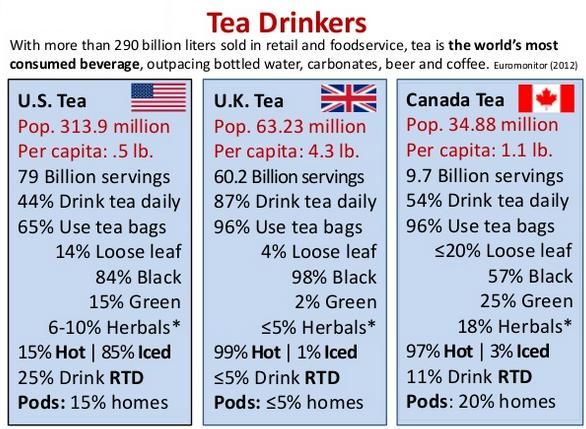
So, if the British public were to suddenly lose their taste for a good brew today, the
economy would not suffer massively. There’d be a in the people out in the job, but it’d hardly
trigger another recession. The country would go on just the same as it always had. While tea
might be ubiquitous, it’s not valuable enough to send shockwaves through the economy like a
good old bank collapse will.
        However, if in the back in time, tea was a much bigger deal to England – and the
world could have been a very different place were it not for our love of a brew.

                        Market Overview - Global Market

        Although the Camellia sinensis (the evergreen bush from which its fresh leaves and
buds tea is produced) is originally native to mainland China, South and Southeast Asia, today
the plant is cultivated across the world in tropical and subtropical regions. Global tea
production estimate of 4 million metric tons in the 2010 (ITC 2010), providing employment
for millions worldwide.

                           Source: M. Groosman: Sector overview – Tea

       In the global tea market, the two most important types of tea produced are Black Tea
and Green Tea. In 2009, 61% of global production was Black Tea (38% CTC, 23% Orthodox)
and 31% was Green Tea (ITC 2010). Black tea is predominantly produced and exported by
Kenya and Sri Lanka. Green tea is mainly grown and consumed in China (TCC 2010:4)
Although Black tea is by far the most produced and exported tea, production and exports of
green tea are rapidly increasing, as shown in the projections in Figure 4 (FAO 2011). Other
major tea types are Oolong, Jasmine and Pu’erh teas, mostly from China.

                                                                                            4
Source: M. Groosman: Sector overview – Tea

       Although tea is produced in more than 35 countries, three-quarters of global
production occurs in only a handful of these countries. China was responsible for 35% of
world production in 2009, India for 25%, Kenya for 8%, and Sri Lanka for 7% (ITC 2010).
Other important producing countries are Turkey (4%), Viet Nam (4%) and Indonesia (3,5%.

                           Source: M. Groosman: Sector overview – Tea

       Figure shows the production (in million kg) and exports in the top 5 producing and top
5 exporting countries. More than half in the tea produced by China and India - the largest
producers – is for their domestic markets (TCC). Roughly 60% in the world production is
consumed domestically in the producing countries; only 40% (1,609,700 ton) in 2010 was
exported to non-producing countries (TCC 2010, ITC 2010). The major consuming countries
are also the major producing countries—China and India, respectively accounting for 24%

                                                                                           5
and 21% of global consumption in 2009 respectively (ITC 2010). The major exporting
countries are Kenya, China and Sri Lanka, which together control almost 60% of world
exports (ITC). It must be noted however although Kenya ranks number one in quantities,
exports from Sri Lanka have a substantially higher monetary value (FAOSTAT)

       Contrary to coffee and cocoa, the affluent populations of North America, Western
Europe and Japan are not the largest markets for tea. Over 50% of global tea exports are
destined to the Middle East, North Africa and the former Soviet Union countries. Tea
consumption 6nt he non-producing countries is led by the Russian Federation (4.5%), the
United States of America (3.2%) and the United Kingdom (3%); see table 2 (ITC 2010).

                           Source: M. Groosman: Sector overview – Tea

        The tea of choice in countries like China, Viet Nam and Indonesia is green tea; in
other markets Black tea is still predominant. Premium loose tea markets, like Germany and
Japan are known to go for the leafy teas of higher quality. Tea bags are preferred 6nt he
Western consuming countries like the USA, UK and the Netherlands. There is also an
increasing trend 6nt he consumption of non-traditional tea products such as iced tea, lemon
tea, herbal infusions etc. (TCC 2010: 5). According to the American tea bord, roughly 85 –
90% 6nt he tea 6nt he6rket the USA is destined for the production of ice-tea and other ready
to drink beverages “on ice” (Northjersey.com)

                                                                                          6
EU market

        The West European market is only accounts for 6 percent in the world tea
consumption (TCC 2010: 7), and is largely dominated by a few main players. In 2010, the
combined import of tea for consumption in the UK and the Netherlands was 129,452 tons for
consumption (173,157 tons including re-exports), forming roughly 56% of EU-27’s imports,
as is shown in figure 6 below. Certified teas are becoming more popular in these markets.

                            Source: M. Groosman: Sector overview – Tea

         The United Kingdom is the largest tea consumer in Western Europe, with a market
share of 63% (TCC 2010). Tea consumption amounted to almost 122,000 ton in 2010 (ITC
2010), of which more than half the volume was sourced from Kenya, UK’s most important
supplier. Other important suppliers are India, Indonesia and China.
         In the Netherlands, less than half in the tea imports are for the domestic market—tea
consumption amounted to 7,700 ton in 2010 (ITC 2010), constituting 4% in the Western
European market. According to the Dutch Central Statistics Bureau (CBS), tea imports not
adjusted for re-exports amounted to 23,700 ton in 2009 (KNVKT 20010). The total Dutch
export of tea amounted to 11,000 ton in 2009, with Germany as its main destination (KNVKT
2010). The main suppliers are Indonesia, Malawi, Argentina and China (TCC 2010). Sara Lee
is with a market share of 65% the main player in the Dutch tea market, followed by the
retailer Albert Heijn (15%) and Unilever (5%).
         Although the Netherlands is a relatively small market, it is an absolute frontrunner in
terms of certified tea: by 2015 an estimated 80% in the available volume of tea will be
certified (TCC 2010).

                                                                                              7
Major tea importing countries worldwide in 2011 (in metric tons)

         Source: http://www.statista.com/statistics/258620/main-import-countries-for-tea-worldwide/

       This statistic shows the five major tea importing countries worldwide in metric in the
2011. The United States was ranked third among the leading importers, with a total import
amount of 127,511 tons of tea in 2011.

  Source: http://www.slideshare.net/mysticmediapublishing/innovation-in-tea-5th-global-dubai-tea-forum-by-dan-bolton

                                                                                                                       8
Source: http://www.slideshare.net/mysticmediapublishing/innovation-in-tea-5th-global-dubai-tea-forum-by-dan-bolton

                                               Tea in the UK

        While we’ve already seen how the tea industry isn’t a huge contributor to the UK’s
economy, what about the rest in the world? Here’s how our imports (minus our own exports)
stacks up against tea production around the world.

 Source: https://www.crunch.co.uk/blog/freelancer-advice/2014/07/29/how-britains-tea-economy-pushed-the-
                                            world-boiling-point/

                                                                                                                       9
Turns out we’re not even an influential force on the world trade of tea anymore. Back
in 1961 our imports accounted for 42.6% in the world’s tea. By 2011 our share had fallen to
just 7.4% as the volume of global tea exports has shot up, and our use of it has gradually
declined. Between 1961 and 2011, we brought 17.4% in the world’s tea to our shores.
        Here’s how all that comes out in US Dollars:

 Source: https://www.crunch.co.uk/blog/freelancer-advice/2014/07/29/how-britains-tea-economy-pushed-the-
                                            world-boiling-point/

        In 1961, the value of our imports was worth 47.3% in the entire world’s export values.
Come 2011 and it’s just 7%, with the three previous years being even lower.
        So, are we really the avid tea drinkers we’ve styled ourselves as? If you compare us to
other big tea-importing nations, we were dominant well into the end in the last century. It was
only in 1989 that a country overtook us for the first time:

 Source: https://www.crunch.co.uk/blog/freelancer-advice/2014/07/29/how-britains-tea-economy-pushed-the-
                                            world-boiling-point/

                                                                                                       10
Around this time the Georgia (still part in the USSR) tea industry suffered from poor
soil and equipment. They attempted to fix this using fertilisers, which ruined the taste in the
tea and turned the population off it. It’s likely the USSR would have thus increased imports to
combat this, only to see them drop with the Soviet Union collapse in 1991.
Russia finally achieved a steady lead on us in 2002. It was certainly the end in the era
when it comes to a love of tea, but bearing in mind Russia has 80 million more citizens than
us, maybe we’re not beat just yet.
Either way it’s interesting to wonder how, if Charles II hadn’t had a taste for it, or if
we’d lost the Opium Wars, the UK would have been different without tea. Would we have
held our nerve during the Blitz all jittery on coffee? How would we have consoled upset
relatives without a in the the black stuff? What would we all do at half-time during
International football matches?
The British are widely recognized as a nation of tea drinkers, and have a long history
with this natural ingredient. According to the UK Tea Council, nationwide black tea
consumption is a staggering 165 million cups per day, or 60.5 billion cups per annum, despite
a small year-on-year drop. But added to this, are the 900 million cups of fruit and herbal teas,
and 279 million cups of green tea consumed per annum. This reinforces that tea is
the UK drink of choice by a big margin, but also that in this traditional category, there are
new areas of development.
UK Retail Sales of Tea by Subsector: Volume 2004-2009 in ‘000 tonnes
2004 2005 2006 2007 2008 2009
Black Tea 117.1 115.2 114.6 116.5 115.5 111.7
Green Tea 0.5 0.6 0.7 0.8 0.8 0.9
Fruit/Herbal Tea 1.8 2.1 2.3 2.4 2.5 2.6
Instant Tea 1.3 0.9 0.9 0.7 0.6 0.5
Other Tea 0.1 0.2 0.3 0.5 0.6 0.6
Total 120.8 119 118.7 120.8 120 116.4
Euromonitor 2010
Source: http://www.ats-sea.agr.gc.ca/eur/5742-eng.htm#d
Herbal and fruit teas have been growing very strongly as a healthy drink, and green
teas are the most recent addition to this trend. Sales have declined a little in the last year, but
manufacturers believe that stronger promotion and a wider range with lower-priced options,
will help to revive the category.
11UK Retail Value Sales of Tea – Historic –US$ million – Current Prices from 2004 to 2009
2004 2005 2006 2007 2008 2009
Black Tea 895.5 880.8 873.9 890.4 898.1 933
Green Tea 13 16 20.5 23.3 24.6 25.9
Fruit/Herbal Tea 57.7 70.3 76.8 80.4 81.3 83.8
Instant Tea 24.6 16.2 14.8 12.9 11.3 10.2
Other Tea 1.7 4.6 8.6 13.3 18.5 21.2
Total 992.6 987.9 994.5 1020 1034 1074
Euromonitor 2010
Source: http://www.ats-sea.agr.gc.ca/eur/5742-eng.htm#d
The tea market is also dominated by the big, long-established brands led by PG Tips,
Tetley and Typhoo. In the current market, PG in the particular has shown strong sales.
Many 12nt he leading food retailers have developed their own private label ranges to
compete with the premium brands, and the biggest areas of growth are organic and Fair Trade
products. Despite this, private label has seen a decline in market share over the last five years
from 18.1% to 15.1% in 2009, according to Euromonitor International. Reinforcing the power
of brands in the tea category, Marks & Spencer, which traditionally offers 100% private label,
experimentally introduced branded tea in select categories such as Fair Trade, and have
recently increased their branded selection.
Company Shares (by Global Brand Owner) – Retail Value RSP - % breakdown
2004 2005 2006 2007 2008 2009
Unilever Group 24.1 23 23.6 24.2 24 25
Tata Tea Ltd 22.5 23 23.1 22.6 22.9 22.4
Associated British Foods Plc (ABF) 8.1 9.6 11.1 11.9 12 12.2
Bettys & Taylors Group Ltd 6.2 6.4 6.8 7.6 7.7 8.1
Apeejay Surrendra Group - 7.8 7.1 6.5 6.2 5.7
Clipper Teas Ltd 0.4 0.5 0.8 0.9 0.8 0.8
Redbush Tea Co Ltd 0.1 0.2 0.4 0.5 0.6 0.7
Cafédirect Ltd 0.8 0.9 1 0.8 0.7 0.7
Private Label 18.1 18.4 17.8 16.1 15.1 15.4
Others 11.5 10.2 8.4 8.9 10 9.2
Total 100 100 100 100 100 100
Euromonitor 2010
Source: http://www.ats-sea.agr.gc.ca/eur/5742-eng.htm#d
12UK Tea Brand Shares (by Global Brand Name) – Retail Value RSP - % breakdown
Brand Company name (GBO) 2004 2005 2006 2007 2008 2009
PG Tips Unilever Group 23.7 22.7 23.3 24.1 23.8 24.8
Tetley Tata Tea Ltd 21.5 22.3 22.7 22.2 22.7 22.1
Twinings Associated British Foods 7.9 9.4 10.9 11.7 11.8 12
Plc (ABF)
Yorkshire Bettys & Taylors Group 6.2 6.4 6.8 7.6 7.7 8.1
Ltd
Typhoo Apeejay Surrendra Group - 7 6.3 5.9 5.7 5.2
Clipper Clipper Teas Ltd 0.4 0.5 0.8 0.9 0.8 0.8
Redbush tea Redbush Tea Co Ltd 0.1 0.2 0.4 0.5 0.6 0.7
Teadirect Cafédirect Ltd 0.8 0.9 1 0.8 0.7 0.7
Lift Apeejay Surrendra Group - 0.5 0.4 0.4 0.4 0.3
Brooke Bond Unilever Group 0.3 0.3 0.2 0.1 0.2 0.2
Jacksons of Associated British Foods 0.2 0.2 0.2 0.2 0.2 0.2
Piccadilly Plc (ABF)
Lyons Tata Tea Ltd 0.9 0.6 0.4 0.2 0.2 0.2
Tetley Green Tea Tata Tea Ltd 0.1 0.1 0.1 0.1 0.1 0.1
London Fruit & Apeejay Surrendra Group - 0.3 0.3 0.2 0.1 0.1
Herb
Private label Private Label 18.1 18.4 17.8 16.1 15.1 15.4
Others Others 11.5 10.2 8.4 8.9 10 9.2
Total Total 100 100 100 100 100 100
Euromonitor 2010
Source: http://www.ats-sea.agr.gc.ca/eur/5742-eng.htm#d
Health-consciousness is shaping tea preferences as consumers begin to appreciate the
importance of maintaining antioxidant levels. Overall tea consumption is also increasingly
characterized by indulgence and relaxation needs, which have resulted in more sophisticated
consumer choices. This is reflected by the growth of organic, all-natural and free-from tea
categories in both foodservice and retail, as shown by bord collected by Mintel.
13Source: http://www.ats-sea.agr.gc.ca/eur/5742-eng.htm#d
According to a Mintel report, there is room for expansion in the tea market, especially
for mid-priced, mass-marketed brands such as Lipton and Nestea. Unilever, the marketer in
the Lipton-brand tea, has announced that the company will source all of its teas from
Rainforest Alliance Certified farms by 2015. While the seal guarantees environmentally-
sustainable tea farming practices, it overlooks „worker welfare“ on tea farms.
Carrying a Fair-Trade-Certified seal may actually become an attribute that most
leading companies would require to compete with private labels. Mintel is already observing a
few private labels including the seal in their premium products.
2006
The tea industry in the UK is evolving and changing to meet the ever challenging
demands of running a profitable and self sustainable business in the ever changing market
place. Many in the more traditional practices associated with the tea trade in the UK have
either adapted to meet these demands or they have disappeared over time.
With no auction taking place in London since 1998 and the reduction in Brokers to
just two from over half a in the the late 90’s the trade has been challenged to source and buy
in the different ways and to increase their ‘in house’ expertise at all points of production.
The market for tea in the UK is worth over £560 million, making it one in the biggest
grocery markets in the UK. Consumption of tea is static at best but The Food and Agricultural
Organisation (FAO) predicts a decline of 0.8% per year between now and 20102 suggesting
that domestic consumption in producing countries is more likely to absorb the overall rise in
consumption of 1.7% per year.
2
Stats from 2006.
14Source: C. Trumper: UK Tea Market Research
With these figures at hand it is predictable that the future in the UK lies in value
addition and not increased volumes. Tea is increasingly being overtaken by soft drinks and
manufacturers are having to be more innovative to keep their market share. Over the next 5
years, as consumers choose more premium products, the value will rise by 9% and the volume
will drop by 8% as the trend towards drinking less tea overall continues.
Therefore, manufacturers will be requiring increasing amounts of high quality tea and
not the lower grades of tea that are currently flooding the world market and providing a sense
of over production.
Proving resilient despite the recession, sales of hot drinks grew in 2009 and are
expected to achieve further growth. Promotional efforts by producers and manufacturers
regarding the heightened quality and flavours that can be achieved in coffee and tea
beverages, have cultivated increasingly discerning consumer demand for greater variety, and
high-end products.
The hot drinks market is expected to see positive value growth between 2010 and
2014. Key drivers are expected to arrive from the coffee sector, where coffee pod systems are
expected to grow in popularity, as well as from manufacturers that are increasingly
concentrating on launching „light‟ or reduced sugar variants.
Consumer Trends – Hot Drinks 15nt he United Kingdom
Source: http://www5.agr.gc.ca/resources/prod/Bord-Bord/MISB-DGSIM/ATS-SEA/PDF/5742-eng.pdf
15The British are widely recognized as a nation of tea drinkers, and have a long history
with this natural ingredient. According to the UK Tea Council, nationwide black tea
consumption is a staggering 165 million cups per day, or 60.5 billion cups per annum, despite
a small year-on-year drop. But added to this, are the 900 million cups of fruit and herbal teas,
and 279 million cups of green tea consumed per annum. This reinforces that tea is the UK
drink of choice by a big margin, but also that in this traditional category, there are new areas
of development.
Consumer Trends – Hot Drinks 16nt he United Kingdom
Source: http://www5.agr.gc.ca/resources/prod/Bord-Bord/MISB-DGSIM/ATS-SEA/PDF/5742-eng.pdf
Herbal and fruit teas have been growing very strongly as a healthy drink, and green
teas are the most recent addition to this trend. Sales have declined a little 16nt he last year, but
manufacturers believe that stronger promotion and a wider range with lower-priced options,
will help to revive the category.
The tea market is also dominated by the big, long-established brands led by PG Tips,
Tetley and Typhoo. In the current market, PG in the particular has shown strong sales.
Many in the leading food retailers have developed their own private label ranges to
compete with the premium brands, and the biggest areas of growth are organic and Fair Trade
products. Despite this, private label has seen a decline in market share over the last five years
from 18.1% to 15.1% in 2009, according to Euromonitor International. Reinforcing the power
of brands in the tea category, Marks & Spencer, which traditionally offers 100% private label,
experimentally introduced branded tea in select categories such as Fair Trade, and have
recently increased their branded selection.
16Consumer Trends – Hot Drinks 17nt he United Kingdom
Source: http://www5.agr.gc.ca/resources/prod/Bord-Bord/MISB-DGSIM/ATS-SEA/PDF/5742-eng.pdf
According to a Mintel report, there is room for expansion in the tea market, especially
for mid-priced, mass-marketed brands such as Lipton and Nestea. Unilever, the marketer in
the Lipton-brand tea, has announced that the company will source all of its teas from
Rainforest Alliance Certified farms by 2015. While the seal guarantees environmentally-
sustainable tea farming practices, it overlooks “worker welfare” on tea farms.
172010
Various estimates put UK tea in the range of GBP 700-800 mn (2010). The market is
estimated to have grown at a healthy 8% between 2008 and 2010, despite the economic
slowdown. Few analyst attribute this to increase in prices (because of shortage of supply)
rather than increase in consumption. UK tea market is primarily driven by high penetration of
tea among aged population, e.g. 88% of population above 65 drink tea, this percentage drops
to 73% among younger population (15-34 year old). “Breakfast tea” accounts for close to
90% of sales value is declining as younger generation moves away from tea to other
alternatives.
UK tea market3
Prices have risen due to short supply, but the overall consumption has decreased
Black tea still dominates the market but is experiencing sluggish growth.
Herbal and Green tea are gaining grounds. Herbal tea accounted for 12% of overall
tea in the 2010, and has been one in the key growth drivers of UK tea market.
Specialty tea such as Assam tea is also increasing in popularity. These types of tea are
especially liked by health conscious population.
Most in the tea sales happen through supermarkets / hypermarkets. Tea vending is
not popular in UK.
Competition in the UK tea market is high with Unilever and Tetley as key players
in the market. UK also has large number of small and unorganized players in the
market.
“Once a cup of builder’s tea was enough to drown the nation’s sorrows, but new
research from Mintel finds Brits are increasingly turning to alternative varieties, as sales of
green tea bags have shot in the impressive 83% in past two years alone.
Indeed, the strain is showing for good old-fashioned English Breakfast tea. Although
accounting for the biggest share in the tea market (70%), sales of ordinary English Breakfast
tea bags dropped by 1.5% from £470 million to £463 million between 2010 and 2011. Since
2009, the share of ordinary bags as a percentage of all in home tea sales has declined from
73% in 2009 to 70% in 2011. What is more, the number of Brits using English Breakfast tea
in the past 12 months has fallen from 87% in 2010 to 83% in 2011.
Meanwhile, other more exotic varieties have shown more positive performances,
indeed, between 2009 and 2011, sales of””Fruit and Herbal bags””(valued at £54 million in
2011) increased 10%, while””Speciality bags””(£52 million) and””Decaffeinated bags””(£36
million) grew by 8% and 16% respectively. But it was the””Green bags””sector which was
the real star performer 18nt he home tea sector. Sales of Green bags grew a sensational 83%
between 2009 and 2011, the market almost doubling from £12 million in 2009 to £22 million
in 2011. Today, as many as 12% of Brits drink Green tea on a weekly basis.
3
http://www.theresearchpedia.com/research-articles/uk-tea-market
18Alex Beckett, Senior Food Analyst at Mintel, said:4
“”While English Breakfast tea is fondly regarded, the expansion of coffee chains and
the exotic flavours of fruit, herbal and green teas are encouraging consumers to diversify their
consumption habits, prompting fewer cups of standard tea to be drunk. Though the segment
continues to play only a niche role in the market, Green tea, like Fruit and Herbal teas, has
benefited from positive associations with healthiness. Green tea extracts are increasingly
found in cosmetic beauty products, raising the profile of Green tea among women in
particular.””
Overall, retail value sales of tea in the UK jumped by 22% to £655 million between
2006 and 2011. Annual sales growth had rapidly accelerated to 11.9% in 2009 when the
market was valued at £610 million. This was largely fuelled by price inflation, which also
remained high in 2010 when the total value hit £660 million. The tea market then declined in
2011, when value fell 1% to £655 million. Today, tea is drunk by almost nine in ten (87%)
Brits.
“”When faced with adversity, Britons have historically reached for a cup of tea. And
the state in the current economic climate should in theory provide bountiful times for tea
brands, considering three quarters of users describe it as comforting. However, diversity
appears to be impacting tea consumption more than adversity these days. With usage rates
falling and value sales growth all but reliant on commodity inflation, it could be forgiven for
disregarding the long-established motto to ‘Keep calm and carry on’.””Alex continues.
Meanwhile, sales of loose leaf tea dropped by 11% between 2009 and 2011, to record
£16 million, accounting for just 2% of overall tea sales. While usage of loose leaf remained
flat over the period, with 9% of tea users choosing this format, sales have declined slightly in
recent years, with the higher price of loose tea making it more vulnerable to consumer cut
backs in the recession. Surprisingly, the biggest users of loose tea are aged between 25-34 at
12% rather than those aged 65 and over (10%) who were more likely to have grown up using
loose leaf rather than tea bags.
“”Most people would think over-55s are the biggest users of loose leaf tea, but it is
actually those aged 25-34. Tea in the increasingly cool image. With many in the nation’s
younger consumers’ having a keener in the food, as well as quality coffee, this group are more
likely to be more open to discovering the benefits of loose leaf, such as the full flavour 19nt
he larger leaves.””adds Alex.
With a strong possibility that the economy will head back into a recession, the outlook
for consumer confidence in the UK is bleak. However, as a household staple rather than a
luxury item, tea sales are unlikely to be strongly adversely affected. The overall tea market is
forecast to grow by 8% to £708 million between 2011 and 2016, as global wholesale tea
prices rebound, forcing manufacturers to pass on the costs. “5
4
http://www.mintel.com/press-centre/food-and-drink/britains-growing-appreciation-for-green-and-herbal-tea-
hits-sales-of-builders-brew
5
http://www.mintel.com/press-centre/food-and-drink/britains-growing-appreciation-for-green-and-herbal-tea-
hits-sales-of-builders-brew
19Some facts you may not know – 2010
The British have been drinking tea for nearly 400 years
Tea breaks are traditions that have been with us for approximately 200 years. Initially
when workers commenced their day at around 5 or 6am, employers allowed a break in
the morning when food and tea were served. Some employers repeated the break in the
afternoon as well
Tea costs approximately 3p per cup to make. Coffee costs 6.5p
Tea outsells coffee by 2 to 1
There are 26 tea-growing nations. The principal ones are India,China, Sri
Lanka, Kenya and Indonesia
Over 50% of our tea comes from East Africa – Kenya, Malawi,Zimbabwe
The UK imports and consumes 140 thousand tonnes of tea per year
The UK drinks 165 million cups per day – 62 billion cups per year
There are estimated to be about 1,500 different varieties of tea
In a recent study, 80% of staff claim they find out more about what's going on at work
over a cup of tea than in any other way
The UK tea market is worth circa £700 million annually
Average consumption is circa 3 cups per day (10 years old and over)
70% of population (over 10yrs) drank tea yesterday
95% of tea is consumed in tea bags
86% of tea is consumed at home, 14% out of home
93% of tea consumed is a blend – 7% speciality tea. Earl Grey 50% of speciality
market
Over 25% of milk consumed in UK is taken with tea
98% of people take milk with tea
45% of people take sugar with their tea
Source: http://www.beveragestandardsassociation.co.uk/Tea-Facts
20Number of enterprises in the processing of tea and coffee sector in the United Kingdom
(UK) from 2008 to 2012
Source: http://www.statista.com/statistics/368094/number-of-enterprises-in-the-processing-of-tea-and-coffee-
sector-in-the-uk/
This statistic shows the number of enterprises in the processing of tea and coffee
sector in the United Kingdom (UK) from 2008 to 2012. In 2012, there were 63 enterprises
processing tea and coffee in the United Kingdom.
20116
The traditional British cuppa is under attack from poncey herbal alternatives. Research
firm Mintel has found sales of English Breakfast tea have fallen, with fruit and herbal teas,
Green tea and decaffeinated tea on the surge.
Your proper builders' tea remains dominant with 70% in the market but sales fell last
year by 1.5% from £470m to £463m and it share in the tea market has dropped from 73% in
2009.
What is more, the number of Brits using English Breakfast tea in the past 12 months
has fallen from 87% in 2010 to 83% in 2011.
What were they drinking? Other more exotic varieties of teas have shown more
positive performances. Between 2009 and 2011, sales of „Fruit and Herbal bags“ (valued at
£54m in 2011) increased 10%, while „Speciality bags“ (£52m) and „Decaffeinated bags“
(£36m) grew by 8% and 16% respectively.
But it was the „Green bags“ sector that was the real star performer in the home tea
sector. Sales of Green bags grew a sensational 83% between 2009 and 2011, the market
almost doubling from £12m in 2009 to £22m in 2011. Today, as many as 12% of Brits drink
Green tea on a weekly basis.
6
http://money.aol.co.uk/2012/03/21/herbal-teas-target-the-british-cuppa/
21Alex Beckett, senior food analyst at Mintel, said: „While Engligh Breakfast tea is
fondly regarded, the expansion of coffee chains and the exotic flavours of fruit, herbal and
green teas are encouraging consumers to diversify their consumption habits, prompting fewer
cups of standard tea to be drunk.
„Though the segment continues to play only a niche role in the market, Green tea, like
Fruit and Herbal teas, has benefited from positive associations with healthiness. Green tea
extracts are increasingly found in cosmetic beauty products, raising the profile of Green tea
among women in particular.“
Overall, retail value sales of tea in the UK jumped by 22% to £655m between 2006
and 2011. Annual sales growth had rapidly accelerated to 11.9% in 2009 when the market was
valued at £610m. This was largely fuelled by price inflation, which also remained high in
2010 when the total value hit £660m. The tea market then declined in 2011, when value fell
1% to £655m.
Recession-proof? Today, tea is drunk by almost nine in ten (87%) Brits. Beckett said:
„When faced with adversity, Britons have historically reached for a cup of tea. And the state
in the current economic climate should in theory provide bountiful times for tea brands,
considering three quarters of users describe it as comforting.
„However, diversity appears to be impacting tea consumption more than adversity
these days. With usage rates falling and value sales growth all but reliant on commodity
inflation, it could be forgiven for disregarding the long-established motto to 'Keep calm and
carry on'.“
Return in the tea pot? Young people not OAPs are now biggest users of loose leaf tea,
the research found. The biggest group of users is aged between 25-34 at 12%. Users over 65
only accounted for 10%. Sales of loose leaf tea dropped by 11% between 2009 and 2011, to
£16m, accounting for just 2% of overall tea sales.
While usage of loose leaf remained flat over the period, with 9% of tea users choosing
this format, sales have declined slightly in recent years, with the higher price of loose tea
making it more vulnerable to consumer cut backs in the recession.
The overall tea market is forecast to grow by 8% to £708m between 2011 and 2016, as
global wholesale tea prices rebound, forcing manufacturers to pass on the costs.
2014
In line with the overall premiumisation in the hot drinks market, it appears that UK
consumers are buying tea less frequently but are trading up when they do purchase. Tea will
continue to be a mainstay of UK society but premiumisation remains an important factor as
consumers adapt the way they consume Britain’s favourite drink. As a result, off-trade value
sales increased by 2% in 2013 but volumes fell by 1%.
22Year-on-year value growth of tea in the United Kingdom (UK) in July 2014, by category
Source:
http://www.statista.com/statistics/310513/year-on-year-value-growth-of-tea-united-kingdom-uk-by-category/
This statistic shows the year-on year-growth in value of tea in the United Kingdom
(UK) for the 52 weeks ending July 20, 2014, by category. During that period, speciality teas
showed the biggest growth in value (6 percent), followed by fruit and herbal fushions (5
percent). Traditional mainstream tea fell in value by 5 percent.
Sales value of tea in the United Kingdom (UK) in 2014, by category (in million GBP)
Source: http://www.statista.com/statistics/382133/tea-market-sales-value-united-kingdom-uk-by-category/
This statistic shows the total sales value of tea in the United Kingdom (UK) as
reported in 2014, split by category: standard tea, green tea and fruit and herbal teas. At that
time, standard tea was worth 495 million British pounds in the UK. Fruit and herbal teas were
worth 65 million British pounds and Green Tea 30 million British pounds.
23Sales value of tea in the United Kingdom (UK) from 2010 to 2014 (in million euros)
Source: http://www.statista.com/statistics/365138/sales-value-of-tea-in-the-united-kingdom-uk/
This statistic shows the sales value of tea in the United Kingdom (UK), from 2010 to
2014. Over this period, sales of tea have shown a decline in value. In 2011, sales of tea were
worth 628 million euros.
How important are each in the following in deciding where you purchase coffee or tea
drinks?
Source: http://www.statista.com/statistics/292548/us-consumers–rating-of-factors-where-to-buy-coffee-tea-drinks/
This statistic presents the results of a survey among US consumers. The survey was
fielded online by Harris Interactive in February 2013, asking the respondents to rate the
determining factors in deciding where to purchase coffee or tea drinks. Some 94 percent of
US consumers indicated the taste in the coffee as the key buying factor.
24Market share of ready-to-drink (RTD) tea worldwide as of 2015, by company
Source: http://www.statista.com/statistics/387413/market-share-of-leading-ready-to-drink-tea-companies-worldwide/
This statistic presents the market share in the leading ready-to-drink (RTD) tea
companies worldwide as of 2015. Unilever was ranked fourth with a market share of 6.8
percent. The global market was estimated at 65.2 billion U.S. dollars.
Average weekly household expenditure on tea in the United Kingdom (UK) in 2013, by age
of household reference person* (in GBP)
Source: http://www.statista.com/statistics/285544/tea-weekly-uk-household-expenditure-by-age/
This statistic illustrates the average weekly household expenditure on tea 25nt he
United Kingdom (UK) in 2013, by the age in the household reference person. Respondents
with a household reference person aged 50 to 64 spent an average of 50 pence a week on tea.
25Wholesale tea in the US in 2012 and 2013, by market segment (in billion U.S. dollars)
Source: http://www.statista.com/statistics/258565/us-wholesale-tea-sales-by-market-segment/
The statistic displays the wholesale tea value in the US in 2012 and 2013, by market segment. The foodservice
segment captured wholesale sales of about 1.12 billion U.S. dollars in 2012. The total wholesale value in the
U.S. tea industry amounted to about 9.8 billion U.S. dollars in the year.
Supply Chain
The tea supply chain is characterized by a very strong vertical integration by just a few
multinationals. At the global level, 85% of global production is sold by multinationals (CBI
2011b). Direct links between manufacturers and producers are common. The main packers,
Unilever (12% in the global market) and Tata Tea (4% in the market) are key players in the
consumer market.
They dominate the trade, have a strong influence on transport companies, and source
part of their supplies from their own plantations.
26Source: M. Groosman: Sector overview – Tea
Figure below shows a simplified scheme in the tea sector supply chain. (TCC 2010:2).
Source: M. Groosman: Sector overview – Tea
Producers
Although it is very difficult to put an exact number on the amount of workers active in
tea production, estimates suggest there are roughly 3 million workers active in Kenya alone.
Tea production has long been dominated by large plantations, but especially since
liberalization of markets in the mid 1990s, smallholdings are on the increase. In Kenya and
Sri Lanka, about two-thirds of all tea is cultivated on smallholdings (TCC 2010). For these
27farmers, cultivating tea provides work and income throughout the year, with a low risk of
complete crop failure.
Tea is a very labor intensive crop. Plantations and small farmers employ thousands of
workers to maintain and harvest their tea fields. Work in tea gardens is usually gender
specific. Harvesting, generally referred to as plucking, absorbs the most amount of labor and
is carried out almost exclusively by female workers. There is typically a daily wage for tea
plucking, with a stipulated minimum quantum of leaves to be plucked. Male workers are
generally employed only for pruning, applying fertilizers and agrochemicals, or hauling heavy
loads. As these are largely seasonal or occasional activities, men sometimes have work only
for 10-15 days in the month (TCC 2010).
Source: M. Groosman: Sector overview – Tea
Processors
Most in the processing of tea leaves takes place in the countries of origin, as
processing the tea leaf should begin within 5-7 hours after harvesting to avoid deterioration in
quality. Processing is done in independent BLFs or estate factories (TCC 2010), through
controlled fermentation in the liquor present. The two main methods of black tea
production—the most widely produced tea—are ‘orthodox’ and ‘CTC’ (crushed-torn-curled
or cut-torn curled), where the leaves are cut and rolled in several special ways. Both types
come in different grades or qualities, based on the size in the processed and dried leaves. In
green tea production the natural fermentation process is halted by first drying (heating or
steaming) the freshly picked leaves before further processing. Tea quality and price are
determined on the basis of liquor, aroma/flavor and leaf appearance. The processed factory tea
(also known as “made tea”) is in the packets and chests.
Trade Phase
Auctions
Roughly 70% of global tea production is traded through auctions (Lines 2006).
Brokers constitute an important link between tea producers and buyers, since they
communicate information regarding supply and demand (TCC 2010). Unlike the coffee and
cocoa trade, there is no single indicator price for tea. Instead, pricing is dominated by the
auction system, where the price of tea from each estate is determined on a day-to-day basis,
according to the quality and supply and demand on the day. This is because tea quality will
vary considerably even from the same factory and region on a weekly or monthly basis. The
28average prices at the three most important auction centers (Kolkata, India; Colombo, Sri
Lanka; and Mombasa, Kenya) are a reference for the world market price (TCC). The local
auction centre is used for rapid delivery and lower costs: there are 6 auction centers in India,
and one each in Sri Lanka (Colombo), Indonesia (Jakarta), Malawi (Limbe), eastern Africa
(Mombasa) and Bangladesh (Chittagong). Chinese tea is sold at commodity fairs in
Guangzhou.
At auctions, buyers bid for one particular grade from a particular tea garden at a time,
after tasting the tea and judging its value. The auctioneer plays an important role in the tea
market. Apart from personally tasting and evaluating each individual invoice, he has to use
his knowledge in the world demand and marketing skill in judging the marketability in the
tea. He has final jurisdiction and his judgment to a certain extent determines the selling price
in the tea (Lines 2006).
Brokers
A few firms dominate in the each auction centre. The largest tea broker in the world, J.
Thomas & Co. Pvt. Ltd., handles over 155 million kg of tea a year, i.e. one-third of all tea
auctioned in India (J. Thomas & Co. Pvt. Ltd. Website). Carritt Moran and Co. Ltd., the
world’s second largest tea broker, handles 24% of auctioned in the India (Carritt Moran and
Co. Ltd. Website).
Brokers must be registered with the appropriate tea bord in order to operate, which
limits the number of auction houses where tea can be sold. 11 brokers are registered with the
Tea Bord of Kenya, while there are 4 registered brokers at Calcutta (J. Thomas & Co., Carritt
Moran & Co., Contemporary Targett and Paramount Tea Marketing). Together these brokers
sell the majority of Darjeeling tea (Lines 2006).
The concentration of buyers in most auction centers has traditionally been very high.
New buyers are inherently discriminated against for a number of reasons. Firstly, brokers
generally do not accept bids from buyers they do not know as they feel it increases their risk.
Secondly, the new buyers are disadvantaged by the fact that the tea has to go to the processing
and packaging plants most of which are owned by the other companies competing with them
nt he same auction.
Blenders
Tea is generally exported with minimal processing to importing consumer countries,
where it is blended and packaged by the tea companies. Blending is the most lucrative part
29nt he tea trade, meaning the largest proportion in the profits does not end up in the tea-
producing countries, but abroad (TCC 2010; Lines 2006). Whilst many producers try to
export pre-processed tea, the export of ‘ready-for-use’ tea is often hindered by the absence of
money for expensive marketing strategies.
The consumer markets are dominated by the popular blended brands (over 70% in the
UK market) (CBI). These blends can contain up to 36 different types of tea (TCC), in the
consuming country. They are designed to keep their taste constant despite the loss of any tea-
source due to adverse weather or high prices.
By exporting tea in bulk, developing countries are missing the opportunity for
significantly increased export earnings. Producing countries currently sell tea most often as a
29generic without branding and packaging, despite the increase this could mean in prices;
branded tea fetches prices six times higher than bulk export. Sri Lanka is an exception, and
has succeeded in capturing more value in the supply chain through value-added production
(Ceylon tea) (Lines 2006)
Retail
With the growth in Europe and North America, the character of tea buying changed
quite dramatically in the 1990s. There has been a centralization of tea buying, increased
buying by individual companies and the bypassing of wholesalers through direct links
between the tea buyers and tea packers. Leading companies spend a great deal on promotion
of their products. In Japan the advertising expenditure was 8%, compared to 4% in the US and
2.5% in the UK (Lines 2006). A great amount of money is also spent on trade promotions to
retail outlets to try to persuade them to carry their brands, particularly by smaller companies.
Retailers generally seem to add small margins on the tea but make their money from these
promotional margin allowances from the packers.
Key online UK retailers:
http://www.imperialteas.co.uk/
http://www.pekoetea.co.uk/tea.html
http://www.teapigs.co.uk/
http://www.teahouseemporium.co.uk/
http://www.whittard.co.uk/
http://www.nbtea.co.uk/
http://www.cardewoxford.co.uk/
http://www.brewteacompany.co.uk/
http://www.leafshop.co.uk/store/
http://www.etsteas.co.uk/
30Trade channels
Trade channels for tea packed at origin:
Source: http://www.cbi.eu/sites/default/files/study/tailored-study-kenyan-tea-packed-origin-europe-trade-
structure-channels-tea-2014.pdf
In the case of tea packed at origin, tea is mostly sold directly to the blender and
packers without the intervention of brokers or the Mombasa auction. Producer benefits from
direct trade are often considerable; they receive payment faster, endure less uncertainty about
sales and price, and can avoid the charges associated with auctioning tea. Likewise, the
system appeals to blenders and packers, because it guarantees faster delivery.
Compared to the conventional tea supply chain, the tea does not leave the country in
bulk packaging. Tea blenders and packers are situated in UK, whereas these would normally
be located in the destination market. As a result, the most lucrative value-adding activities of
the tea supply chain, blending and packaging, accruing up to 50% of the consumer price, are
carried out in the country of origin. On the other hand, importers profit from lower blending
and packaging costs, which outweigh the transportation and storage costs.
Brokers and auction
In the case of tea packed at origin, brokers can sometimes be a link between tea
producers and blenders or packers, since they communicate information regarding supply and
demand. As a result. the number of auction houses where tea can be sold is limited. New
buyers have limited chances of entering the system, because unknown buyers are only
marginally allowed to trade at auctions. The auction system is similar to other major global
auction centres, bringing buyers (traders, agents and importers/blenders) and sellers together,
to determine the price through interactive competitive bidding. If bidding does not reach the
price desired, the broker or producer can withdraw the tea from the auction.
Retail channels
The market for bagged tea can be divided into two retail channels:
At-home consumption,
Out-of-home consumption.
31Both retail channels have different types of brands available for the consumer, offering
well-known brands, private label brands and discount brands. Each of these brands is
presented in their own style and price segment. If you aim to be present in a foreign market
with your own brand or under a private label in these channels, be aware that you also would
have to offer a complete tea assortment. This means you would have to offer rooibos, herbal
infusions and aromatic teas next to green and black teas.
At-home consumption
This channel is becoming increasingly diverse and accounts for around 70% of tea
consumption. Next to the old-fashioned tea-for-a-pot bags, single cup tea bags (often in
tagged double chamber with envelope) are particularly prevalent, next to loose-leafed (often
premium) tea. Tea bagged in pyramid sachets are also seen more often on the market.
Moreover, the variety of brands, flavour etc. has increased tremendously the past two decades.
Consumers (but also small companies) can purchase tea in these forms at:
Supermarkets
specialty tea and coffee shops,
organic shops.
Out-of-home consumption
A proportion of the tea consumption takes place out-of-home, amongst other locations
in restaurants, coffee bars, cafes, at work etc. However, since your exports of tea packed at
origin are mostly interesting for retail channels that focus on large and continuous orders,
these smaller orders from restaurants and coffee/tea bars are not the most interesting channels
for exporters of tea packed at origin.
Consumption at work is of great importance. This market segment is partly provided
for by the same retailers as the at-home segment. However, large companies often have tea
vending machines, which is of limited interest for exporters of tea packed at origin. This
market is dominated by a limited number of companies. Your best chances are with the small
and medium-sized companies as they still buy tea at retailers, distributors or Cash& Carry
wholesalers.
Sustainability
Sustainability issues in the sector
In its current state, sufficient supply and quality of tea is not guaranteed for the sector.
Several social, economic, and environmental issues, combined with the finite nature of natural
resources and rapidly growing populations, lie at the root of this situation. Supported by a
growing public awareness in the West of social, economical and environmental issues
associated with tea cultivation, the sector has become increasingly interested in sustainability
(TCC 2011).
32Source: M. Groosman: Sector overview - Tea
Social issues
There are several social issues that influence the overall quality of the tea produced
and the productivity in general. Workers on tea estates face discrimination, harassment and
gender inequality, combined with poor living conditions, little access to healthcare and low
representation (ETP 2011). The income of tea farmers is low. This is often around their
individual country’s minimum wage levels, although this does not normally constitute a living
wage in tea-producing countries. Their wages are quickly under pressure when market prices
for tea go down, as the cost of labor represents about 55 to 73% of made tea production costs
(tea processing factory gate price not retail price). Picking makes up approximately 75% of
these costs (Lines, 2006).
Although traditionally tea is produced on estates, smallholders are on the increase.
Two thirds of all tea cultivated in Kenya and Sri Lanka is from smallholdings (TCC 2010).
However, while smallholders in Kenya are often a member of the Kenya Tea Development
Agency (KTDA, ETP 2011), most smallholders elsewhere do not have such organizations or
representation. Furthermore, poor yields and quality have led to high vulnerability of
smallholders’ livelihoods (TCC; IDH 2010).’
Environmental issues
Tea cultivation has multiple environmental effects. According to Clay, the main
harmful environmental impact of tea production is habitat conversion (Clay 2003). Large
areas of biodiversity rich forests have been replaced by monoculture in North East India (RA
website). In East Africa, forests are still being cleared in order to make way for new
plantations (McLennan 2011). Next to loss of biodiversity, land clearance also alters the
natural flow of water, leading to an increase in soil erosion, which on its turn leads to the loss
of wetland habitats and the pollution of rivers and lakes (ibid). In some countries, such as
India, Sri Lanka and Vietnam, abundant and wrong application of pesticides is also negatively
affecting the local and wider environment. As tea plants are grown in monoculture, they
provide ideal conditions for a number of pests. The result is that a number of toxic, harmful
pesticides are widely used (ibid). Lastly, energy consumption for tea processing is energy
33intensive (Asian Institute of Technology 2002). As the machinery used is often outdated,
energy use for tea processing is also very inefficient (IDH 2010).
Economic issues
Due to the remoteness of tea plantations, and the small time window the freshly
plucked tea needs to be processed, farmers lack both market information and bargaining
power. Furthermore, although tea is ‘ready to drink’ when exported by producing countries,
the downstream stages such as blending, packing and marketing are the most profitable. This
part of the value chain is controlled by a handful of multinational tea packers and brokers,
which as a result can considerably influence world prices. While real prices for tea on shop
shelves have remained stable, average real auction prices in the years 2000-2008 were
roughly half of those in the eighties (ITC 2010). As an effect of the low market price for tea,
farmers were not able to adequately invest for inputs or new planting material. This leads to
poor quality and yields, resulting in low pricing, thus creating a vicious cycle. In 2009 and
currently, prices are high due to severe droughts in several tea producing countries. A fear is
that—motivated by the high prices—farmers will produce too much tea, resulting in
oversupply and subsequently a plunging price.
Competitors
Tetley GB Ltd led tea in 2013 with a value share of over 21%, closely followed by
Unilever Bestfoods UK Ltd with 19%. Tata-owned Tetley’s top ranking is due to its strong
position in black tea, which accounted for 76% of total tea sales in 2013. Tetley is also fairly
prominent in emerging categories such as green tea, fruit/herbal tea and other tea, in which it
ranked second, fourth and first, respectively, in 2013. The company has been innovative in its
product offering, including the introduction of its ‘Blend of Both’ tea, which encompasses
both black and green tea.7
Organic tea sales in the off-trade have fallen, with black tea, for example, suffering an
11% decline in volumes over 2008-2013, with the trend expected to continue over 2013-2018
with a further 20% decline.
Tea drinking has for centuries been a proud UK tradition, leading to such coinage as
tea parties, and tea breaks. Tea is a distinctly British beverage, and more than 60 billion cups
of tea are consumed per year in the United Kingdom alone. Britons are the world's second-
largest tea drinkers per capita, with over 1,200 varieties of tea sold around the country.
The UK tea market is primarily driven by high penetration of tea among aged
population, e.g. 88% of population above 65 drink tea, this percentage drops to 73% among
younger population (15-34 year old).8
7
http://www.euromonitor.com/tea-in-the-united-kingdom/report
8
http://www.companiesandmarkets.com/News/Food-and-Drink/UK-tea-market-controlled-by-PG-Tips-and-
Tetley/NI6501
34You can also read