Unaccommodating Rental Housing Wage in Canada - David Macdonald - Canadian Centre for Policy Alternatives
←
→
Page content transcription
If your browser does not render page correctly, please read the page content below
Canadian Centre for Policy Alternatives
          July 2019

                                                      Unaccommodating
                                                      Rental Housing Wage in Canada

                                                      David Macdonald

www.policyalternatives.ca                  RESEARCH                     ANALYSIS      SOLUTIONS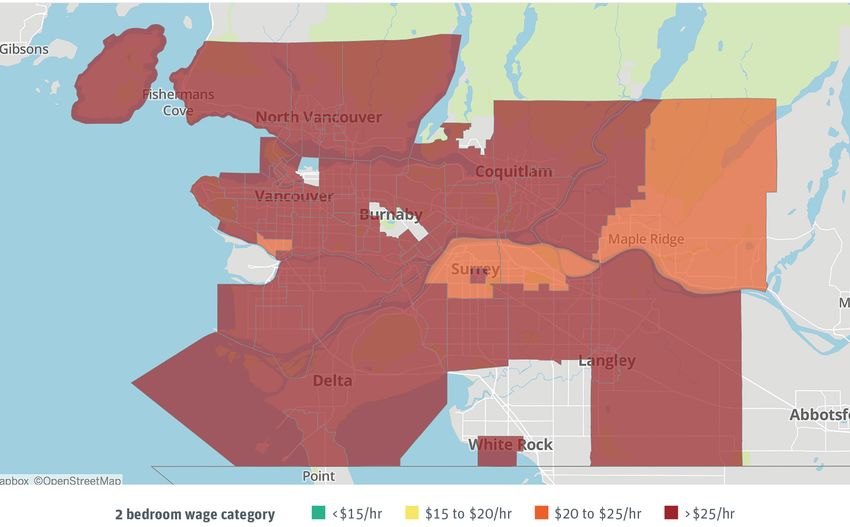
About the authors

                                                    David Macdonald is a senior economist with the
                                                    Canadian Centre for Policy Alternatives.

ISBN 978-1-77125-463-2                              Acknowledgments

This report is available free of charge at          The author would like to thank Andrew Aurand,
www.policyalternatives.ca.                          Nick Falvo, Alex Hemingway, Marc Lee and Greg
                                                    Suttor for their comments on an earlier version
Please make a donation...                           of this paper.
Help us to continue to offer our
publications free online.

With your support we can continue to produce
high quality research — and make sure it gets
into the hands of citizens, journalists, policy
makers and progressive organizations. Visit
www.policyalternatives.ca or call 613-563-1341
for more information.

The CCPA is an independent policy research
organization. This report has been subjected to
peer review and meets the research standards of
the Centre.

The opinions and recommendations in this
report, and any errors, are those of the authors,
and do not necessarily reflect the views of the
funders of this report.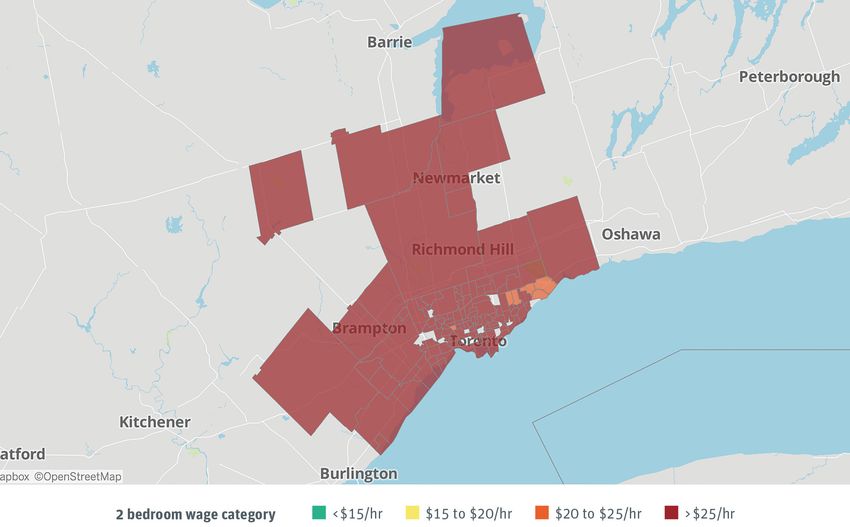
4   Executive summary
7   Introduction and methodology
10 Rental housing wages across Canada
15 Case studies
21 High housing prices, high rents
25 Federal housing policy and rental affordability
28 Rental support and the Canada Housing Benefit
31 Conclusion
33 Notes
Executive summary

When we talk about housing affordability the focus is usually on home
ownership and high housing costs. Less discussed is the affordability crisis
faced by the third of Canadian households (4.7 million families) who rent
their homes. This paper looks at the extent of the problem by determining
the hourly wage that a full-time worker must make to be able to rent an
average two-bedroom apartment using no more than 30% of their income.
We call this the rental wage.
   The average rental wage across all of Canada is $22.40/hr. Again, this is the
income you would need to bring home to be able to afford an average-priced
two-bedroom apartment. For an average-priced one-bedroom apartment,
the national average rental wage is $20.20/hr. Of course, if a worker doesn’t
have a full-time job the rental wage will be higher no matter where they live.
Importantly, because all provincial minimum wages are far lower than these
average rental wages, it is not possible for many full-time workers to afford
to live anywhere without spending more than 30% of their income on rent.
   In some cities the rental wage is much higher than the Canadian average.
For example, a full-time worker in Vancouver, BC would need to make $35.43/
hr to afford an average-priced two-bedroom apartment. A minimum-wage
worker in Vancouver would have to work 84 hours a week to afford the
average-priced one-bedroom apartment, or 112 hours a week for a two-bedroom
apartment. The next highest average rental wages are found in Toronto, ON
($33.70/hr), Victoria, BC ($28.47/hr), Calgary, AB ($26.97/hr) and Ottawa,

                         Unaccommodating: Rental Housing Wage in Canada            4
ON ($26.08/hr). A detailed, searchable map of rental wages across Canada
is available on the CCPA website (www.policyalternatives.ca/rentalwages).
For this report, we have determined the rental wage in 795 Canadian
neighbourhoods based on two-bedroom rental costs, as two-bedroom apart-
ments are the most common type, making up 50% of all units. One-bedroom
rentals make up 36% of apartments, with the bachelor and three-bedroom (or
more) categories each making up less than 10% of units. With two-bedroom
units being more common, it is easier to determine the rental wage in more
neighbourhoods outside of Canada’s biggest cities.
Everyone deserves a decent place to live. The two-bedroom apartment
therefore serves as a proxy for various family types in Canada, since it offers a
modest amount of room for multiple living arrangements. Many households
rely on only one income but contain more than one person — single-parent
families, for example, or an adult caring for a senior. A sole income earner
working full time should be able to afford a modest two-bedroom apartment
for their family in a country as rich as Canada. But in most Canadian cities,
including Canada’s largest metropolitan areas of Toronto and Vancouver,
there are no neighbourhoods where it is possible to afford a one- or two-
bedroom unit on a single minimum wage.
In fact, it is possible for a minimum-wage worker (e.g., a single parent)
to comfortably afford the average two-bedroom rental rate in only 3% of the
795 neighbourhoods where rental and income data are available. In only
9% of neighbourhoods can a minimum-wage worker afford the average-
priced one-bedroom apartment without spending more than 30% of their
income on rent. Remarkably, of the 36 metro areas in Canada, 23 have no
neighbourhoods where the average-priced one-bedroom is affordable to a
minimum-wage worker, and 31 have no neighbourhoods where a two-bedroom
apartment is affordable.
The rental wage neighbourhood maps in this report and the accompanying
online database show a common reality known to all renters, which is that it
is more expensive to live downtown — close to most jobs — than in outlying
areas that necessitate longer commutes and often the purchase of a car.
The notable exception is Montreal where more affordable neighbourhoods
continue to exist on the island itself and public transit is abundant. The
highest two-bedroom rental wages are found in Toronto’s downtown Bay
Street corridor ($73.17/hr), Vancouver’s North False Creek neighbourhood
($60.93/hr) and the Toronto waterfront and island area ($53.01/hr).
If we exclude condominium rentals, the two-bedroom rental wage
was a fairly constant $17/hr prior to 2001 when it started to go up, hitting
5 Canadian Centre for Policy Alternativesclose to $20/hour by 2018. Though the increase is a result of many factors,
some of which differ from province to province, one of the most important
contributors was the collapse of new purpose-built rental construction
(apartment buildings). In the late 1970s and early 1980s, over 100,000 new
rental apartments were being built a year. That number dropped to 10,000 in
the 1990s due in part to federal cuts to affordable housing funding. Between
1983 and 1993, 49% of all new rental builds were affordable housing units
paid for with public money. In the 1970s and 1980s, substantial federal tax
incentives also encouraged many market rental units to be built.
In the past three years, Canada Mortgage and Housing Corporation has
introduced four long-term programs devoted to new affordable units: the
National Housing Co-investment Fund, the Rental Construction Financing
Initiative, the Affordable Housing Innovation Fund, and the Federal Lands
Initiative. These programs jointly promise to deliver more than 110,500 new
units by 2027-28. Combined with other provincial and federal programs,
15,100 and 16,600 new affordable units received commitments in 2017-18
and 2018-19 respectively — three-quarters of the 20,000 affordable units built
each year between 1970 and the early 1990s.
Direct rental supports like the new Canada Housing Benefit — a cash
supplement to low-income renters — could take the edge off housing cost
increases for some renters while we wait for federally funded construction
programs to kick into gear. But the benefit’s tight budget cap will neces-
sitate the application of strict eligibility requirements that will push most
low-income renters from the queue. In the long term, rental subsidies are
no substitute for the construction of new affordable housing, which would
increase vacancy rates, cool rental prices and allow more people to live
closer to where they work.
Unaccommodating: Rental Housing Wage in Canada 6Introduction and
methodology
The 2019 federal budget placed a strong emphasis on housing affordability
and included multiple initiatives aimed at making it easier for “middle class”
families to become homeowners. While the high price of buying a home is
in the news daily, the increasing cost of renting an apartment draws less
attention. This is odd given that 4.7 million of Canada’s 14 million households
(exactly one-third) rent their homes.1 Renting is more common among lower-
income families, but also young adults, recent immigrants, and people who
have just moved to a new city.
High housing costs, having priced many millennials out of home ownership,
are also contributing to increased demand for rental units — and increased
rental costs. Rising rents alongside a shift from purpose-built rental builds
to condominiums has made living in Canada’s cities challenging for renters.
The situation has spawned more frequent renovictions, whereby landlords
kick out their current tenants claiming they need to renovate a unit — a legal
approach — only to skip the renovations, hike the rent and put it unaltered
back on the market.
This report attempts to gain a better view of the cost of renting in Canada
down to the neighbourhood level. Simply listing average rental prices is
not helpful, as the cost of living varies from province to province and city
to city. Instead, we have determined the hourly wage a person would need
to make to be able to afford a two-bedroom apartment in each of the 795
7 Canadian Centre for Policy Alternativesneighbourhoods examined here. This is the same approach taken by the
National Low Income Housing Coalition in its annual “Out of Reach” study
of affordable housing in the United States, now in its 30th year.2
The rental wage is calculated so that no more 30% of a tenant’s pre-tax
earnings are spent on rent, and assumes the tenant works a standard 40-hour
week for all 52 weeks of the year. The 30% rent-to-income threshold is one
of three criteria (alongside adequacy/state of repair, and suitability/correct
number of rooms) used by Canada Mortgage and Housing Corporation (CMHC)
to determine core housing need in Canada.3 If a tenant (or tenant family) is
spending more than 30% of their income on housing, they are said to be in
core housing need, at least based on the financial component.
As two-bedroom apartments are the most common rental type in Canada,
making up 50% of all units, it is simpler to report rental wages in more neigh-
bourhoods (i.e., outside of urban centres) based on average two-bedroom
rental rates. One-bedroom apartments make up 36% of the rental stock,
with bachelors and three-bedroom (or more) apartments both making up
under 10% each.4 Where possible, we have determined the one-bedroom
rental wage as well. Townhomes, which are less common and generally
more expensive to rent, are excluded from this study.
A two-bedroom apartment also acts as a proxy for various family types
in Canada, since it provides a modest amount of room for multiple people
to live in. Many households rely on only one income but contain more than
one person: a single parent, a single-income family or an adult caring for
a senior, to list a few examples. A sole income earner working full time
should be able to afford a modest two-bedroom apartment for their family
in a country as rich as Canada. In too many cities, this is just not the case.
Rental data in this report is derived from CMHC’s October 2018 urban
rental market survey, which covers census metropolitan areas (CMAs) with
populations above 10,000.5 Only buildings with three or more rental units
are included in the analysis.6 CMHC also conducts a secondary rental market
survey to determine average rents for condominiums.7 The condominium
and apartment datasets are rarely combined to create an average rent
for both types, but that has been done in all figures in this report unless
otherwise noted. Unfortunately, the average rent of secondary units (e.g.,
in a homeowner’s house) are excluded due to lack of data.
Average rents are for both occupied and vacant units. Since in almost all
city centres the rent for unoccupied units is much higher, this underestimates
rental costs for new renters.8 We have used provincial minimum wages at
their October 2018 levels to match the timeframe of the rental data. Several
Unaccommodating: Rental Housing Wage in Canada 8provincial minimum wages have gone up since then, but as we will see
below, these increases do not notably affect rental affordability.
Generally, median and average rental costs are quite similar in most of the
neighbourhoods studied here, with the notable exceptions of Vancouver and
Toronto where the average rent is significantly higher than the median.9 We
have attempted to overcome any shortcomings of using the average rent as
the measure of central tendency by examining trends at the neighbourhood
level. Readers can look for other trends, or simply check the rental wage in
their neighbourhood, by consulting the interactive rental wage map on the
CCPA website.
9 Canadian Centre for Policy AlternativesRental housing wages
across Canada
Nationally, the rental housing wage — the wage a full-time, full-year
worker would need to make to be able to afford an average-priced two-
bedroom apartment using no more than 30% of their income — is $22.40 an
hour. The rental housing wage for a one-bedroom apartment is slightly less
at $20.20 an hour for a full-time worker. Of course, if a worker isn’t working
full time then their hourly wage would have to be higher than this to pay for
an average apartment using 30% or less of their income.
Both of these rental wages (for a two-bedroom and one-bedroom
apartment) are several dollars higher than any provincial minimum wage,
and many people who work at or close to the minimum wage do not work
full time. As we will explore in more detail below, it is therefore very likely
that someone working within a few dollars of the minimum wage in any
province is spending more than 30% of their income on rent. A quarter of
all Canadians, less than a third of them under 25, earn within $3 of their
province’s minimum wage (see Figure 1).
Table 1 calculates the one- and two-bedroom hourly wages required to
rent an average apartment in each of Canada’s 36 census metropolitan areas
(CMAs). The highest two-bedroom rental wages for a full-time worker are found
in Vancouver, BC ($35.43/hr), Toronto, ON ($33.70/hr), Victoria, BC ($28.47/
hr), Calgary, AB ($26.97/hr) and Ottawa, ON ($26.08/hr). In all these cities,
the lower one-bedroom rental housing wage still far exceeds the provincial
Unaccommodating: Rental Housing Wage in Canada 10Figure 1 Individuals earning within $3 of the minimum wage (by family type)
Other
8%Table 1 Rental wage (hourly) by census metropolitan area, from highest to lowest two-bedroom wage
Hours worked at Hours worked at
Minimum wage One-bedroom minimum wage to afford Two-bedroom minimum wage to afford
City (Oct. 2018) wage (full time) one-bedroom apartment wage (full time) two-bedroom apartment
Vancouver $12.65 $26.72 84 $35.43 112
Toronto $14.00 $27.74 79 $33.70 96
Victoria $12.65 $21.33 67 $28.47 90
Calgary $15.00 $20.98 56 $26.97 72
Ottawa $14.00 $21.29 61 $26.08 75
Barrie $14.00 $21.94 63 $25.60 73
Edmonton $15.00 $19.89 53 $24.67 66
Oshawa $14.00 $22.46 64 $23.96 68
Kitchener-Cambridge-Waterloo $14.00 $20.21 58 $23.92 68
Kelowna $12.65 $19.29 61 $23.87 75
Kingston $14.00 $19.38 55 $23.08 66
Winnipeg $11.35 $17.84 63 $22.97 81
Hamilton $14.00 $18.99 54 $22.78 65
Regina $11.06 $17.98 65 $22.62 82
Halifax $11.55 $17.49 61 $22.57 78
Guelph $14.00 $19.88 57 $22.25 64
Saskatoon $11.06 $18.05 65 $21.63 78
London $14.00 $16.86 48 $21.06 60
Peterborough $14.00 $17.62 50 $20.71 59
Greater Sudbury $14.00 $16.44 47 $20.23 58
Thunder Bay $14.00 $15.98 46 $19.94 57
St. Catharines-Niagara $14.00 $16.75 48 $19.92 57
Belleville $14.00 $17.65 50 $19.75 56
Abbotsford-Mission $12.65 $16.00 51 $19.65 62
Brantford $14.00 $17.31 49 $19.27 55
Lethbridge $15.00 $16.81 45 $18.87 50
St. John’s $11.15 $15.21 55 $18.48 66
Windsor $14.00 $14.85 42 $17.60 50
Quebec $12.00 $14.06 47 $16.36 55
Montreal $12.00 $14.12 47 $16.09 54
Moncton $11.25 $13.42 48 $15.98 57
Gatineau $12.00 $13.77 46 $15.98 53
Saint John $11.25 $12.46 44 $14.52 52
Sherbrooke $12.00 $9.88 33 $12.29 41
Saguenay $12.00 $9.12 30 $11.69 39
Trois-Rivieres $12.00 $9.15 31 $11.56 39
Source Employment and Social Development Canada, Canada Mortgage and Housing Corporation, and author’s calculations.
Unaccommodating: Rental Housing Wage in Canada 12Table 2 shows the percentage of neighbourhoods in Canada’s big cities
in which a full-time minimum-wage worker can afford an average one- or
two-bedroom apartment. In most large cities these neighbourhoods simply
don’t exist. For example, there are 117 neighbourhoods in the Greater Toronto
Area (GTA), but in none of them could a full-time minimum-wage worker
comfortably (and in many cases uncomfortably) afford either a one- or
two-bedroom apartment. The same can be said for Metro Vancouver’s 65
neighbourhoods.
The situation is somewhat better in Montreal where a full-time minimum-
wage worker could afford the average one-bedroom apartment in a fifth of
the city’s 97 neighbourhoods. However, even here minimum-wage workers
are shut out of decent two-bedroom apartments, with no neighbourhoods
offering affordable rent in this category.
13 Canadian Centre for Policy AlternativesTable 2 Percentage of neighbourhoods with affordable rental units for a full-time minimum-wage worker
One-bedroom affordable two-bedroom affordable Number of
Census metropolitan area at minimum wage at minimum wage neighbourhoods in cma
Abbotsford-Mission 0% 0% 5
Barrie 0% 0% 4
Belleville 0% 0% 6
Brantford 0% 0% 6
Calgary 0% 0% 44
Edmonton 0% 0% 55
Guelph 0% 0% 4
Halifax 0% 0% 23
Hamilton 0% 0% 22
Kelowna 0% 0% 2
Kitchener-Cambridge-Waterloo 0% 0% 15
Lethbridge 0% 0% 11
Oshawa 0% 0% 4
Peterborough 0% 0% 4
Regina 0% 0% 20
Saskatoon 0% 0% 16
St. John’s 0% 0% 3
Thunder Bay 0% 0% 8
Toronto 0% 0% 117
Vancouver 0% 0% 65
Victoria 0% 0% 24
Winnipeg 0% 0% 28
Ottawa 0% 0% 27
Kingston 8% 0% 13
Moncton 8% 0% 13
Saint John 13% 0% 8
London 14% 0% 22
Quebec 27% 0% 42
Windsor 33% 0% 13
Montreal 18% 0% 97
Gatineau 22% 0% 11
St. Catharines-Niagara 14% 5% 22
Greater Sudbury 30% 11% 9
Sherbrooke 100% 60% 10
Trois-Rivieres 92% 71% 14
Saguenay 100% 75% 8
Source Employment and Social Development Canada, Canada Mortgage and Housing Corporation, and author’s calculations.
Unaccommodating: Rental Housing Wage in Canada 14Case studies
The data underlying this report have been made available in an online
mapping tool accessed from the Canadian Centre for Policy Alternatives
website (www.policyalternatives.ca/rentalwages). Clicking on a province on
the map opens a list of cities for which rental data are available, along with
those cities’ two-bedroom rental wages. Clicking on any city in the provincial
list will then pull up a detailed map of its neighbourhoods colour-coded
by two-bedroom rental wage. Several of those cities are examined in more
detail here.11
15 Canadian Centre for Policy AlternativesFigure 2 Greater Toronto Area two-bedroom rental wage by neighbourhood
© 2019 Mapbox © OpenStreetMap
2 bedroom wage category $25/hr
The three neighbourhoods in the Greater Toronto Area with over 10,000
apartments each are Downsview, Mount Pleasant West, and Mississauga
Centre, although none are particularly affordable. The Downsview two-
bedroom rental wage is $28/hr and the Mississauga Centre rental wage is
$31/hr; in both neighbouhoods a full-time minimum-wage worker would
need to clock over 80 hours a week to afford this rent. Renting the average
two-bedroom apartment in Mount Pleasant West would require a wage of
$43/hour. In no GTA neighbourhood could a full-time minimum-wage worker
find an affordable one- or two-bedroom apartment to rent. Many of the
Scarborough neighbourhoods require a lower rental wage of between $23/
hr and $25/hr, but this is nearly $10/hr above the current Ontario minimum
wage of $14/hr. These neighbourhoods also don’t contain many apartments.
Unaccommodating: Rental Housing Wage in Canada 16Figure 3 Metro Vancouver two-bedroom rental wage by neighbourhood
© 2019 Mapbox © OpenStreetMap
2 bedroom wage category $25/hr
Like in the Greater Toronto Area, the Vancouver neighbourhoods containing
over 6,000 apartments also have among the highest rental wages: Downtown
Central ($46/hr), English Bay ($46/hr) and South Granville ($40/hr). Some
smaller rental neighbourhoods are slightly cheaper: Kitsilano–Point Grey
($43/hr), Mount Pleasant ($36/hr), and Hastings-Grandview-Woodlands ($31/
hr). But these are well above BC’s minimum wage of $12.65 in October 2018.
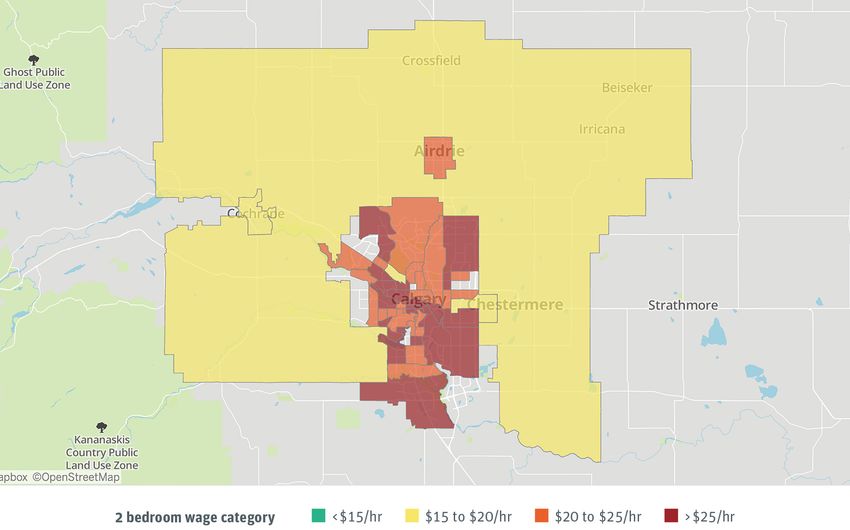
17 Canadian Centre for Policy AlternativesFigure 4 Calgary two-bedroom rental wage by neighbourhood
© 2019 Mapbox © OpenStreetMap
2 bedroom wage category $25/hr
In none of Calgary’s 44 neighbourhoods can a full-time minimum-wage
worker afford an average one- or two-bedroom apartment. The two largest
rental neighbourhoods of Mission/Beltline and Downtown/Eau Claire are
unfortunately also the most expensive, with two-bedroom rental wages of
$32/hr and $31/hr respectively. The cheapest two-bedroom rents are found
in a broad swath of largely rural areas on the outskirts of the city where it
would still require a full-time wage of $18/hr to comfortably pay your rent
(using no more than 30% of income). But there are almost no apartments
for rent there, and the rental wage is still $3/hr higher than Alberta’s $15/
hr minimum wage.
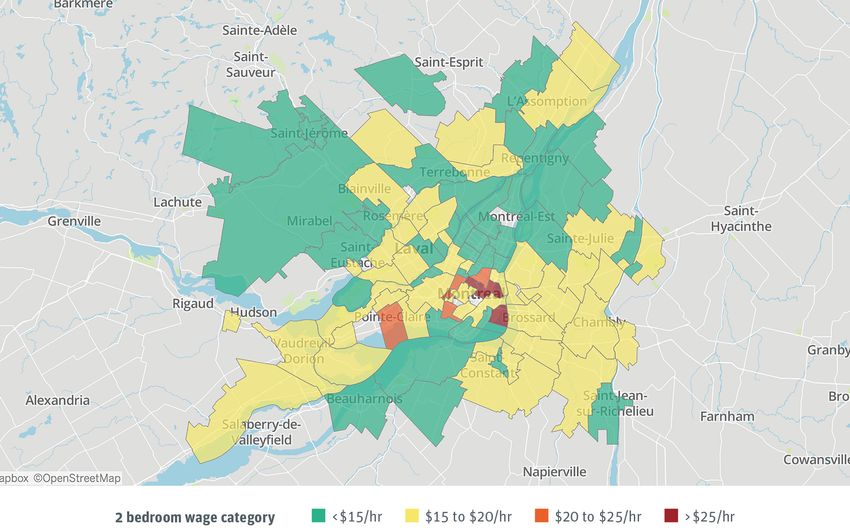
Unaccommodating: Rental Housing Wage in Canada 18Figure 5 Montreal two-bedroom rental wage by neighbourhood
© 2019 Mapbox © OpenStreetMap
2 bedroom wage category $25/hr
Unlike other large cities in Canada, in over half of Montreal neighbour-
hoods a full-time worker making $15/hr could comfortably afford to rent a
two-bedroom apartment (see the neighbourhoods in green). Several of those
neighbourhoods are on the island itself and close to mass transit. Montreal
also has a much higher concentration of apartments per neighbourhood.
For example, two neighbourhoods have over 40,000 units each. One of
them, Rosemont/La Petite-Patrie, offers a two-bedroom wage of just under
$15/hr and is quite centrally located, which is rare outside of Quebec cities.
19 Canadian Centre for Policy AlternativesEmployment and the rental wage
Canada’s five most common occupations, representing 1.8 million workers or 12% of all jobs, are also over-
whelmingly low-paid and often not full-time. The rental wage one would need to make to afford a one- or two-
bedroom apartment is far above the average hourly wages in these sectors. If a worker is not working full time,
the hourly rental wage is even higher. Higher minimum wages, particularly in Ontario and Alberta, have a strong
impact on these occupations. But until those wages are pushing $20 an hour, and more of the available jobs
are full-time, rental costs will remain a significant burden on many workers.
Figure 6 Hourly wage of Canada’s largest five occupations
Administrative
assistants
Retail $22.40
salespersons 2 bedroom
wage
Cashiers
$20.20
Food counter 1 bedroom
& kitchen helpers wage
Food and
beverage servers
$0 $5 $10 $15 $20 $25
Hourly wage
Source Statistics Canada table 14-10-0001-01 (2017), Canada Mortgage and Housing Corporation, and author’s calculations.
Unaccommodating: Rental Housing Wage in Canada 20High housing prices,
high rents
Plenty of attention has been focused in recent years on the increase
in Canadian real estate prices since the early 2000s. But the trend in rentals
is largely the same. The average rental wage (excluding rental condos) for a
two-bedroom apartment was fairly consistent through the 1990s at just over
$17/hr (after adjusting for inflation). However, just like house prices, the
rental wage has risen sharply since then. The two-bedroom rental housing
wage hit $17.63/hr in 2001, continued upward and now sits at $20/hr. After
adjusting for inflation, the rental wage today is $2.53/hr higher than it was
on average in the 1990s.
On the demand side, the number of renters in Canada fell between 1996
and 2006, probably for the first time in Canada’s history.12 Strong wage growth,
significantly declining interest rates, and modest housing prices in this
period (with the potential for housing income gains) enticed more renters
into homeownership than would normally be the case. These and other
factors helped fuel a residential real estate boom in the homeowner sector.
But by the mid-2000s, escalating housing prices were keeping more people
renting longer and put a higher floor on the income required to buy a home.
Since the 1990s there has been a significant shift in the supply of rental
units as developers shifted decisively from purpose-built rentals (apartment
buildings) to condominiums. Purpose-built rental construction peaked in
21 Canadian Centre for Policy AlternativesFigure 7 The two-bedroom rental wage over time, Canada (ex condominiums)
$21
$20
Two-bedroom rental wage ($2018)
$19
$18
$17
$16
$15
1990 1992 1994 1996 1998 2000 2002 2004 2006 2008 2010 2012 2014 2016 2018
Source Canada Mortgage and Housing Corporation’s Canadian Housing Observer, and author’s calculations. This series includes 10,000+ communities, i.e., more than the
census metropolitan area data used elsewhere in this report.
the late 1960s and early 1970s, when over 100,000 new units were being
built per year, and has been declining since then.13
As Figure 8 shows, the construction of condominiums stayed relatively
constant at 30,000 units a year throughout the 1990s. However, at the turn
of the millennium condo starts rocket up to 60,000–70,000 units a year,
broken only for the Great Recession years of 2009-10. The increase in condo
starts correlates with the run-up in residential real estate prices generally,
which also ramps up in the early 2000s. This is the same timeframe as the
increase in the rental wage.
The construction of purpose-built rental units plummeted in the early
1990s largely due to successive cuts to social housing by the Mulroney
government starting in 1990. By 1993, all new social housing funding was
ended except for that dedicated to on-reserve housing.14 Several provinces,
notably Ontario, extended affordable housing funding after the federal
monies dried up, but eventually this funding was stopped as well.
By 2015, purpose-built rental starts had returned to their 1990 levels.
However, there are 10 million more people living in Canada now than there
were three decades ago. On a per capita basis, therefore, today’s rental starts
fill less of the need for new units.
Unaccommodating: Rental Housing Wage in Canada 22Figure 8 Traditional apartment vs. condominium starts in Canada
80,000
70,000
Condominium
60,000
50,000
Units
40,000
30,000
20,000
Purpose-built rental
(traditional apartments)
10,000
0
1990 1992 1994 1996 1998 2000 2002 2004 2006 2008 2010 2012 2014 2016
Source Canada Mortgage and Housing Corporations’ Canadian Housing Observer, and author’s calculations.
Of course, condos can also be rented and often are as part of an invest-
ment strategy. In Toronto, Vancouver and Calgary, condos have become
an important source of rental units. In recent years, new condo builds are
often mismatched with actual housing needs; in the worst cases they are
specifically marketed to overseas investors, who may leave them empty
while they appreciate in value.
Unfortunately, the increase in condo rentals has also led to less secure
housing for many renters. In heated real estate markets, unpredictable rent
increases are common, including hikes that violate provincial rules. In some
provinces, like Alberta, landlords can increase the rent by any amount they
choose if there is no lease in place. This effectively allows landlords to evict
tenants on a whim.
In other provinces, like Ontario and BC, landlords are largely restricted to
inflationary increases in rent, which technically provides more predictability
to tenants. However, “renovictions” — where landlords kick out all their ten-
ants based on a claimed need to renovate, then hike rents for new occupants
(whether or not the renovations took place) — or “N12 evictions” — permissible
when a family member requires the unit — are all-too-common tools used
23 Canadian Centre for Policy Alternativesby condo landlords in particular to increase rents while undermining both
tenant security and the affordability of housing.15
Unaccommodating: Rental Housing Wage in Canada 24Federal housing
policy and rental
affordability
As noted, the drop in purpose-built rentals is linked to cuts in CMHC
spending on affordable rental housing from 1990 to 1993. Figure 9 shows
both the total number of purpose-built rentals and the number of affordable
rentals built with public dollars. Between 1980 and 1993, affordable rental
units made up on average 49% of all rental unit starts. Clearly, public policy
plays an important role in the quantity and type of rental housing in Canada.
Federal tax incentives and loan programs to private investors, particu-
larly those introduced in the 1970s and 1980s, also played a pivotal role
in purpose-built rental construction over that period.16 Similar provincial
programs existed in Ontario, Quebec and British Columbia, but in almost
all cases they had ended by 1990. The introduction of the federal goods and
services tax (GST) in 1991 disincentivized new rental construction, as the
GST was partially rebated on the sale of some condos to private investors
while largescale private rental investors bore the full cost of the tax when
they bought an apartment building from a builder.
Today, private investors can still access public subsidies to build rental
stock in some communities. The City of Vancouver, for instance, incentivizes
rental (versus condominium) construction by offering lower development
charges to builders as long as rents do not exceed certain caps established
25 Canadian Centre for Policy AlternativesFigure 9 Public spending on affordable housing and purpose-built rental starts in Canada
70,000
Federal non-profit and co-op National Housing Co-Investment Fund
Rental Construction Financing Initiative Affordable Housing Innovation Fund
60,000
Federal Lands Initiative Total Provincial (IAH, SIF & unilateral)
Total rental starts
50,000
40,000
Units
30,000
20,000
10,000
0
1980 1982 1984 1986 1988 1990 1992 1994 1996 1998 2000 2002 2004 2006 2008 2010 2012 2014 2016 2018p
Source Canada Mortgage and Housing Corporation’s (CMHC) Canadian Housing Observer; Greg Sutton’s Still Renovating (2016), tables 8.3, 8.4, 8.5; CHMC Annual Report
2018; and author’s calculations. Affordable rental housing figures are financial commitments, while “total rental starts” are actual building starts for purpose-built rentals,
with likely timing differences between the two. 2018 values are predicted.
by the city, which vary based on the neighbourhood.17 While these units add
to the rental stock, extremely low vacancy rates in Vancouver ensure rents
remain high in these subsidized new rental buildings.
Broadly speaking, the construction of purpose-built rental units is heavily
dependent on public policy as opposed to market forces. As public funding
collapsed in the 1990s, both through the end of tax incentives and funding
for affordable housing, so did the construction of new purpose-built rentals.
When public funding from provincial and new CMHC programs recovered
somewhat in the 2000s, so did the number of rental starts. Since 2011,
however, increased rental starts have not been due to public funding or tax
incentives, but rather answer a demand for new, mostly luxury rentals for
people priced out of the housing market.
Since 2016, the federal government has made several efforts to boost the
stock of affordable housing, first through its stop-gap Social Infrastructure
Fund (SIF) and then the National Housing Strategy. Other programs are
meant to both repair and create new affordable housing units. The four
post-SIF programs that are meant to create new affordable rental units are
the National Housing Co-investment Fund (NHCF), Rental Construction
Unaccommodating: Rental Housing Wage in Canada 26Table 3 Status of new CMHC affordable housing programs (new units only)
Affordable
National Housing Rental Construction Housing Federal Lands
Co-investment Fund Financing Initiative Innovation Fund Initiative
New units with committed financing 1,813 8,412 7,384 -
New unit goal 60,000 42,500 4,000 4,000
Percentage of goal that has commitments 3% 20% 185% 0%
Percentage of the program’s timeframe 11% 20% 60% 33%
that is complete
Program start and end dates 2018 to 2027/28 2017 to 2027/28 2016 to 2020/21 2018 to 2020/21
Source Author’s correspondence with the Canada Mortgage and Housing Corporation, and author’s calculations.
Financing Initiative (RCF), Affordable Housing Innovation Fund, and Federal
Lands Initiative.18
Some of these programs have been more successful than others, as
outlined in Table 3. The Affordable Housing Innovate Fund, for instance, has
exceeded its target number of new units, while the Federal Land Initiative
has failed so far to commit financing to any new units. The larger NHCF is
slowly putting money to work with 3% of its 60,000-unit goal committed.
The RCF is roughly on track with commitments for 8,412 units. Both of the
larger RCF and NHCF took time to get up and running; with the decade-long
timeframes for new construction, we can expect more units to be built in
the late 2020s.
We can see the impact of these new federal programs in the last two years
of Figure 9. Combined with pre-existing provincial programs, there were
financial commitments for 15,100 new affordable units in 2017 and 16,600
in 2018. These are highpoints for affordable housing units, not seen since
the early 1990s, but still only three-quarters of the 20,000 units that were
being created annually by CMHC throughout the 1980s. In other words, the
programs are working, but they have a long way to go to make up for the
dearth of affordable housing construction since 1993.
However, if the remaining targets for CMHC programs from Table 3 roll
out as planned over the next eight years, and if on-reserve new unit construc-
tion continues apace and unilateral provincial programs are maintained,
this would result in 15,400 new affordable units a year, slightly less than in
2018. While this is more than any year since the early 1990s, it is also still
less than the 20,000 high-water mark of the 1970s and ‘80s.
27 Canadian Centre for Policy AlternativesRental support and the
Canada Housing Benefit
Besides the construction of new rental units, the federal government
is negotiating Canada Housing Benefit funding arrangements with the
provinces and territories. The cash transfer to families who rent, which
will differ in value by province/territory, is aimed at providing an average
benefit of $2,500 a year to 300,000 families. The government appears to want
to cap the cost at about $750 million a year. An average benefit of $2,500 a
year would cut $4.01/hr off the average Canadian rental wage of $22.40/hr.
However, capping the program at 300,000 families leaves far more than
that spending above 30% of their income on rent. In 2020, of the estimated
4.8 million families who will rent their homes, 2.4 million will be considered
in core housing need based on the income component of CMHC’s definition.19
In simple terms, the Canada Housing Benefit’s annual $750 million cap will
help, at most, 12% of those 2.4 million families. Moreover, midrange CMHC
projections show that between 43,000 and 47,000 new renters are expected
to join the hunt for rental housing each year.20
The difficulty for the present negotiations between the provinces/ter-
ritories and the federal government is to decide which families will get the
Canada Housing Benefit. British Columbia, Quebec, Alberta, Manitoba and
Saskatchewan already have rental assistance programs in place with varying
eligibility requirements (e.g., for seniors, families with children, people with
disabilities, or related to income and the shelter-to-income ratio).21
Unaccommodating: Rental Housing Wage in Canada 28Figure 10 Scenarios for a Canada Housing Benefit (2020)
3.0
Non-senior Couple Single Senior
2.5
Single Non-senior Couple + Kids
Senior Couple Single Parent + Kids
2.0
Millions of families
1.5
1.0
0.5
0.0
Families spending >30% CHB: Only income (no CHB: Has Kids CHB: Has Seniors CHB: Only social
of income on rent social assistance recipients) assistance recipients
Source SPSDM 27.0 projected to 2020, and author’s calculations.27
Several provinces also have a portion of social assistance payments
devoted to rent, another type of rental supplement. The existence of these
and other non-federal programs raises the possibility that the provinces will
simply claw back the new federal benefit — something that has happened
with federal child benefits in the past. The Housing Partnership Framework
signed with the provinces, requiring matching provincial funding, may
mitigate that impulse.22
Figure 10 examines the impact of several hypothetical eligibility re-
strictions on the Canada Housing Benefit that would limit the program to
reaching 300,000 families, as planned, and keep spending at a maximum
of $750 million a year. As we can see, no matter how the funds are divided,
large numbers of family types will naturally be excluded from the benefit.
If, for instance, the benefit were for all families who are not currently
receiving social assistance, but the money was clawed back based on income
alone, then almost all the beneficiaries of the CHB would be non-seniors who
live alone.23 This group of working-age single adults make the least amount
of money (income) and receive few government transfers, which would put
them first in line for the benefit.
29 Canadian Centre for Policy AlternativesIf the new Canada Housing Benefit was devoted only to social assistance
recipients, again the primary beneficiaries would be single adults, although
single-parent families would also be impacted.24 However, provinces that
already have a rental component to their social assistance may be unlikely
to layer a new rental benefit on top of it.
In another scenario, the rental benefit could target families with children.
There are 290,000 families with children in Canada whose rent consumes
more than 30% of their income. Designing a rental supplement based on
the presence of children and then family income would aid single-parent
families in particular, with two-parent families being less likely to benefit
due to their higher incomes.25 In this case, the majority of families spending
more than 30% of their income on rent do not benefit at all as they do not
have children.
Another approach would be to provide rental support only to families
that include one or more seniors. There are over 800,000 senior households
in Canada (single and couples) who spend more than 30% of their income on
rent. A rental supplement for seniors that was clawed back based on income
would go almost exclusively to single-senior families. Senior couples, who
still often spend a lot of their income on rent, would see no benefit in this
scenario; likewise for parents, couples or working singles paying high rents.26
These scenarios are not policy recommendations but are meant to be
illustrative of the implications of applying eligibility criteria to the Canada
Housing Benefit, although more complete modelling is available elsewhere.28
Different provinces will no doubt choose different criteria and introduce
additional requirements. But broadly speaking, any rental supplement will
have to be rationed if the budget is capped at $750 million a year.
A supplement to low-income families who rent is a positive development
as long as rent controls stay in place, ensuring the benefit flows to families and
not landlords. Rental support can be particularly useful as a stopgap linked
to new subsidized housing construction, as the building of new affordable
housing takes time. However, the tight eligibility criteria driven by budget
caps will likely blunt much of the program’s positive impact, particularly
for those groups who don’t meet the requirements.
Unaccommodating: Rental Housing Wage in Canada 30Conclusion
High housing costs affect renters as much as they do current and future
homeowners. Government policy designed to make housing affordable
needs to acknowledge skyrocketing rental costs. This report puts rising
rental costs in a national perspective by determining the hourly wage a
person would have to make, in 795 neighbourhoods across the country, to
afford an average-priced two-bedroom apartment. We call this the rental
wage for that neighbourhood, which in most Canadian cities far exceeds
the provincial minimum wage.
New Canada Mortgage and Housing Corporation programs are building
more affordable rental housing but the number of new units is modest by
historical standards, and insufficient for current and future need. The Af-
fordable Housing Innovation Fund has had early success in financing new
units. On the other hand, the larger National Housing Co-investment Fund
has been slower off the mark. The long timeframe of this latter program may
contribute to complacency about how desperately new units are needed.
If these CMHC programs deliver on their new-build promises, in combina-
tion with other federal and provincial programs, they will likely produce
on average 15,400 new affordable units a year through 2027-28. While this
construction rate is higher than at any point since 1993, it is still lower than
the 20,000 new affordable units that were built each year from the 1970s
through the early 1990s, when Canada’s population was significantly smaller.
When it comes to the government’s efforts to subsidize high rental costs,
the Canada Housing Benefit’s target of 300,000 beneficiaries is insufficient. As
31 Canadian Centre for Policy Alternativesnegotiations on the shape and size of the benefit continue with the provinces
and territories, a doubling or tripling of that target should be considered.
The CHB is a promising stopgap measure while new affordable housing
construction gets underway. However, with such a tight cap, rationing will
likely blunt the benefit’s effectiveness. Ultimately, there is no substitute for
building new dedicated affordable housing, which would cool down rental
prices and increase the stock of housing available to the millions of families
who choose or who are forced to rent.
Unaccommodating: Rental Housing Wage in Canada 32Notes
1 Statistics Canada, Canadian Income Survey 2016, Public Use Microdata File.
2 See, for example, Andrew Aurand, Abby Cooper, Dan Emmanuel, Ikra Rafi, Diane Yentel, “Out
of Reach: The High Cost of Housing,” National Low Income Housing Coalition, 2019.
3 For the full definition, see Statistics Canada, Census of Population 2016, “Core Housing Need.”
4 These figures count both condominium and purpose-built rental units for census metropolitan
areas (CMAs) with populations over 10,000. See Canada Mortgage and Housing Corporation,
Urban Rental Market Survey Data, Number of Units, October 2018.
5 Canada Mortgage and Housing Corporation, Urban Rental Market Survey Data, October 2018.
6 Canada Mortgage and Housing Corporation, Housing Market Information Portal, Methodology
for rental market survey, accessed July 4, 2019: https://www03.cmhc-schl.gc.ca/hmip-pimh/en/
TableMapChart/RmsMethodology.
7 This survey is only conducted in the following cities: Halifax, Montreal, Gatineau, Ottawa,
Toronto, Hamilton, Kitchener-Cambridge-Waterloo, London, Winnipeg, Regina, Saskatoon,
Edmonton, Calgary, Kelowna, Vancouver and Victoria. Adjustments are made to average rents
in these cities as well as to provincial and national figures unless otherwise noted.
8 Canada Mortgage and Housing Corporation, Average Apartment Rents (Vacant & Occupied
Units), October 2018.
9 See Figure 1 in Ron Kneebone and Margarita Wilkins, “The very poor and the affordability
of housing,” University of Calgary, School of Public Policy research papers, 9 (27), Sept. 2016.
10 CHMC defines “neighbourhoods” as groupings of census tracts, which are Statistics Canada
geographies. The geographic size of a neighbourhood varies so that in some cases they can span
large areas that wouldn’t colloquially be called a “neighbourhood,” although the goal is to have
roughly similar populations in each.
11 The source data for all maps, and the neighbourhood dimensions, are from Canada Mortgage
and Housing Corporation, with the author’s calculations.
33 Canadian Centre for Policy Alternatives12 Greg Sutton, Still Renovating: A History of Canadian Social Housing Policy, McGill-Queen’s
University Press, 2016, Figures 1.3 and 3.2.
13 See table 8.3 of Greg Sutton, Still Renovating: A history of Canadian social housing policy,
McGill-Queen’s University Press, 2016.
14 Ibid., Chapter 6.
15 See Shane Dingman, “Evicted: The loophole Ontario landlords use to force tenants out,”
Globe and Mail, May 1, 2019.
16 The Limited Dividend Program ran from 1946 to 1974, the Assistance Rental Program ran
from 1975 to 1979, the Multiple Unit Residential Building program ran from 1974 to 1979 and 1980
to 1981, the Canada Rental Supply Plan ran from 1983 through 1985. See Steve Pomeroy, Greg
Lampert and Kathleen Mancer, “Private Rental Policies and Programs: Review of the International
Experience”, Canada Mortgage and Housing Corporation, 1998.
17 Jen St. Denis, “This program added thousands of rental units to Vancouver. Now some councilors
want to scrap it because the rents are too high,” Toronto Star, March 21, 2019.
18 More details on each program are available at CMHC’s National Housing Strategy website:
https://www.cmhc-schl.gc.ca/en/nhs/guidepage-strategy/about-the-initiatives?guide=CREATE%20
NEW%20HOUSING%20SUPPLY
19 SPSDM 27.0, year 2020, and author’s calculations.
20 Based on the Canadawide “constant” scenario from CMHC, Number of Households by Tenure
and Ownership Rate: 1976–2036, 2013 update.
21 Kelly Pasolli, Thomas McManus, Molly Doan, Max Palamar & Karen Myers, “National Hous-
ing Collaborative Affordability Options Research Paper,” Social Research and Demonstration
Corporation, October 2016, Table 1.
22 Canadian Intergovernmental Conference Secretariat, Federal/Provincial/Territorial (FPT)
Housing Partnership Framework, April 9, 2018.
23 For example, a $3,500 benefit for renters only with a clawback rate of 30 cents/dollar of net
income, phasing out at $11,700, would help 342,000 families with an average benefit of $2,210 a
year (excluding social assistance recipients). Of those beneficiaries, 259,000 would be families
who are single non-seniors (SPSD/M 27.0).
24 For example, a $6,000 benefit for renters receiving social assistance, with a clawback rate of
30 cents/dollar of net income that phases out at $20,000, would help 420,000 families with an
average benefit of $1,940 a year.
25 For example, a $7,000 benefit for renters with children, with a clawback rate of 30 cents/
dollar of net income that phases out at $23,330, would help 234,000 families with an average
benefit of $2,990 a year.
26 For example, a $7,500 benefit for renters with seniors in the family, with a clawback rate of
30 cents/dollar of net income that phases out at $25,000, would help 687,000 families with an
average benefit of $1,120 a year.
27 This analysis is based on Statistics Canada’s Social Policy Simulation Database and Model
27.0. The assumptions and calculations underlying the simulation were prepared by the author
and the responsibility for the use and interpretation of these data is entirely his. For more details
on the individual scenarios, please contact the author at the CCPA.
28 For detailed Ontario analysis, see Michael Mendelson, “Designing a housing allowance
program,” Caledon Institute of Social Policy, March 2016; and Karen Myers, “Income Security: A
Roadmap for Change,” Government of Ontario, October 2017, pp. 74–78.
Unaccommodating: Rental Housing Wage in Canada 34You can also read