Uncertainties in break-up markers along the Iberia-Newfoundland margins illustrated by new seismic data - EPIC
←
→
Page content transcription
If your browser does not render page correctly, please read the page content below
Solid Earth, 11, 397–417, 2020
https://doi.org/10.5194/se-11-397-2020
© Author(s) 2020. This work is distributed under
the Creative Commons Attribution 4.0 License.

Uncertainties in break-up markers along the Iberia–Newfoundland
margins illustrated by new seismic data
Annabel Causer1 , Lucía Pérez-Díaz1,2 , Jürgen Adam1 , and Graeme Eagles3
1 Earth Sciences Department, Royal Holloway University of London, Egham, TW20 0EX, UK
2 Department  of Earth Sciences, Oxford University, Oxford, OX1 3AN, UK
3 Alfred Wegener Institut, Helmholtz Zentrum für Polar und Meeresforschung, Bremerhaven, Germany

Correspondence: Annabel Causer (annabel.causer.2017@live.rhul.ac.uk)

Received: 16 September 2019 – Discussion started: 30 September 2019
Revised: 4 February 2020 – Accepted: 17 February 2020 – Published: 30 March 2020

Abstract. Plate tectonic modellers often rely on the identifi-    plate divergence was still being accommodated by tectonic
cation of “break-up” markers to reconstruct the early stages      faulting.
of continental separation. Along the Iberian-Newfoundland            We illustrate the differences in the relative positions of
margin, so-called break-up markers include interpretations        Iberia and Newfoundland across published plate reconstruc-
of old magnetic anomalies from the M series, as well as the       tions and discuss how these are a direct consequence of the
“J anomaly”. These have been used as the basis for plate          uncertainties introduced into the modelling procedure by the
tectonic reconstructions are based on the concept that these      use of extended continental margin data (dubious magnetic
anomalies pinpoint the location of first oceanic lithosphere.     anomaly identifications, break-up unconformity interpreta-
However, uncertainties in the location and interpretation of      tions). We conclude that a different approach is needed for
break-up markers, as well as the difficulty in dating them        constraining plate kinematics of the Iberian plate pre-M0
precisely, has led to plate models that differ in both the tim-   times.
ing and relative palaeo-positions of Iberia and Newfoundland
during separation.
   We use newly available seismic data from the Southern
Newfoundland Basin (SNB) to assess the suitability of com-        1   Introduction
monly used break-up markers along the Newfoundland mar-
gin for plate kinematic reconstructions. Our data show that       Over the past decade, plate tectonic modellers working
basement associated with the younger M-series magnetic            on divergent settings have focused their efforts on better-
anomalies is comprised of exhumed mantle and magmatic             constraining the early stages of continental separation, partly
additions and most likely represents transitional domains         driven by the oil and gas industry’s move to more distal and
and not true oceanic lithosphere. Because rifting propagated      deeper exploration targets (Péron-Pinvidic and Manatschal,
northward, we argue that M-series anomaly identifications         2009; Skogseid, 2010; Nirrengarten et al., 2017; Sandoval
further north, although in a region not imaged by our seis-       et al., 2019). As of today, bridging the gap between the on-
mic, are also unlikely to be diagnostic of true oceanic crust     shore and offshore geological evolution of rifted continen-
beneath the SNB. Similarly, our data also allow us to show        tal margins still presents a challenge, due to the difficulty in
that the high amplitude of the J Anomaly is associated with a     unequivocally interpreting the complex geology of extended
zone of exhumed mantle punctuated by significant volcanic         continental margins (Alves and Cunha, 2018; Keen et al.,
additions and at times characterized by interbedded volcanics     2018).
and sediments. Magmatic activity in the SNB at a time coin-          When studying divergent settings, the onset of seafloor
ciding with M4 (128 Ma) and the presence of SDR packages          spreading is often based on so-called “break-up markers” that
onlapping onto a basement fault suggest that, at this time,       originate in tectonic interpretations made along the extended
                                                                  continental margins. Identified and mapped from geophysi-

Published by Copernicus Publications on behalf of the European Geosciences Union.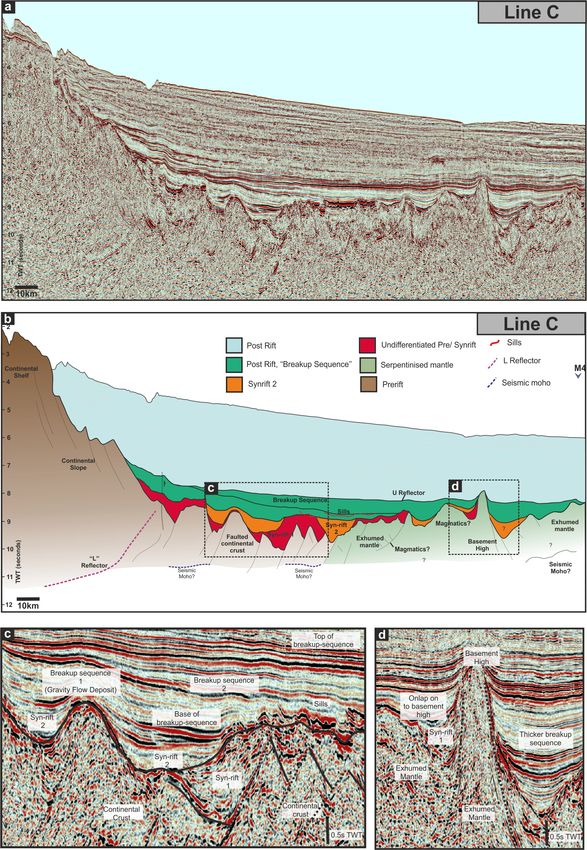
398                          A. Causer et al.: Uncertainties in break-up markers along the Iberia–Newfoundland margins

cal data, these features include depositional unconformities        (DSDP) (e.g. Whitmarsh and Sawyer, 1996; Wilson et al.,
(e.g. Pereira and Alves, 2011; Soares et al., 2012; Decarlis        1996). Research has revealed the margins’ tectonic asym-
et al., 2015), packages of landward-dipping reflectors (e.g.        metry and the gradual proximal-to-distal transition from re-
Keen and de Voogd, 1988), and seismic amplitude changes in          gions of highly extended continental crust to zones of ex-
the top-of-basement surface (e.g. Tucholke et al., 2007), in-       humed mantle locally intruded by pre- or post-break-up mag-
terpreted as marking the change from continental to oceanic         matic intrusions. Despite this, the detailed plate kinemat-
crust. These interpretations are utilized as the basis for many     ics, the age of distinct rift episodes, the timing of the final
computer-generated plate reconstructions, which are in turn         break-up, and the significance of pre-existing structures and
highly susceptible to uncertainties associated with the inter-      lithological heterogeneity are still heavily debated. The dif-
pretation and mapping of said break-up markers. A recent            ficulty in identifying, mapping, and dating the COB along
global census and detailed analysis of these markers high-          this pair of conjugate margins is evident in the wide range
lighted the very large average locational (167 km) and tem-         of candidate COBs suggested in the literature (Fig. 1) (i.e.
poral ( > 5 Myr) uncertainties associated with defining them        Eagles et al., 2015 and refs. therein). The age of final break-
(Eagles et al., 2015).                                              up and formation of first oceanic crust is particularly un-
   Uncertainties of this kind, and their impact on tectonic re-     certain. Drilling results and break-up unconformity identi-
constructions, have been illustrated by, for example, the alter-    fications date the onset of seafloor spreading at the Aptian–
native scenarios proposed in the literature for the movements       Albian transition (113 Ma) (Tucholke and Sibuet, 2007; Boil-
of the Iberian plate between the Late Jurassic to Early Cre-        lot et al., 1988). This is significantly younger than the age
taceous (Srivastava et al., 1990, 2000; Sibuet and Collette,        of the oldest isochrons interpreted from magnetic reversal
1991; Sibuet et al., 2007; Greiner and Neugebauer, 2013;            anomalies (M20-145 Ma to M0-120 Ma) offshore of Iberia
Barnett-Moore et al., 2016). Rotational poles derived from          (Srivastava et al., 2000) (Fig. 1). The discrepancy means that
interpretations of the location of the continent–ocean bound-       the interpretation of these anomalies in terms of M-series
ary (COB), for example, have often resulted in overlaps of          isochrons is disputed. Although interpreted by some studies
known continental crust along the Iberia–Africa plate bound-        as markers of the first oceanic lithosphere (e.g. Vissers and
ary (e.g. Srivastava and Verhoef, 1992). Such overlaps are not      Meijer, 2012; Sibuet et al., 2004), others have shown that
present in kinematic models built on the basis of magnetic          they may instead be associated with igneous bodies located
anomalies, which assume Iberia moves together with Africa           within zones of exhumed mantle (e.g. Sibuet et al., 2007,
for much of this time period (e.g. Sibuet et al., 2012). They       2012).
are greatly reduced in so-called “deformable” plate models             Here we describe and interpret three previously unpub-
that account for continental margin deformation during con-         lished 2D seismic profiles imaging the regional tectonic
tinental break-up (Ady and Whittaker, 2018; Müller et al.,          structure and crustal architecture of the southern Newfound-
2019; Peace et al., 2019). Because these models undo stretch-       land margin from the shelf to the deepwater oceanic basin.
ing deformation, the large uncertainty in COB location es-          The three profiles are chosen from among a large regional
timates reduces to a much smaller uncertainty envelope of           grid of data as the three most likely candidates for a conju-
palinspastically restored equivalents (Eagles et al., 2015).        gate to the IAM5 deep seismic profile on the Iberian mar-
This reduction is unlikely to be useful because, as those au-       gin and are thus suitable for a detailed assessment of the
thors note, the restoration is achieved using rotations about       possible effects of across-axis asymmetry on uncertainties in
a stage pole that is determined using an arbitrary choice of        break-up markers (see Pinheiro et al., 1992; Afilhado et al.,
post-stretching COB estimate and whose formal statistical           2008; Neves et al., 2009). Our interpretations underline and
uncertainty is of a similar size to, or larger than, the restored   add to knowledge of the structural and kinematic complex-
envelope. Hence, the shape of the pre-stretching COB esti-          ity of the transitions between continental and oceanic crust at
mate is sensitive to post-stretching COB estimates to an ex-        the Iberia–Newfoundland conjugate margins, specifically the
tent that is likely to be larger than the uncertainty that the      Southern Newfoundland Basin (SNB), that contribute to the
palinspastic reconstruction technique generates for it.             challenges faced by plate modellers when reconstructing this
   The West Iberia and Newfoundland margins are consid-             pair of conjugate margins. Our new seismic data show that,
ered by many as the type example for magma-poor passive             within the SNB, neither M-series magnetic anomalies nor
rifted margins (Boillot et al., 1995; Whitmarsh and Wal-            the commonly used J anomaly are diagnostic of true oceanic
lace, 2001; Reston, 2007; Tucholke and Sibuet, 2007; Péron-         crust. Extrapolating these regional observations beyond the
Pinvidic and Manatschal, 2009). The continental margins are         extent of the SNB is challenging due to the high along-strike
the result of Late Triassic to Early Cretaceous rifting and         structural variability of the margin (e.g. Nirrengarten et al.,
separation of the North American and Eurasian plates. This          2018). As we will show, our extrapolations are consistent
pair of conjugate margins has been the focus of more than           with the growing literature questioning the validity of these
40 years of intense research, including extensive geophysi-         anomalies as kinematic markers for Iberia–Newfoundland
cal surveying and drilling campaigns as part of the Ocean           kinematic modelling (e.g. Bronner et al., 2011; Stanton et
Drilling Programme (ODP) and Deep Sea Drilling Project              al., 2016; Nirrengarten et al., 2017).

Solid Earth, 11, 397–417, 2020                                                                www.solid-earth.net/11/397/2020/
A. Causer et al.: Uncertainties in break-up markers along the Iberia–Newfoundland margins                                                  399

Figure 1. (a) Study area showing the location of structural and tectonic features significant to our study. Red envelopes mark the extent of the
COTZ as compiled by Eagles et al. (2015). Double black line: mid-ocean ridge; red dashed lines: fracture zone traces. Orange lines: seismic
profiles presented and discussed in this study. Background image is Smith and Sandwell (1997) gridded satellite altimetry. (b, c) Location
of M-series magnetic isochron picks (Srivastava et al., 2000) and ODP legs 210 (Tucholke et al., 2007), 103 (Boillot et al., 1987), and 173
(Whitmarsh et al., 1988) drill sites. FC – Flemish Cap; FP – Flemish Pass; GB – Galicia Bank; GBA – Grand Banks; GIB – Galicia Interior
Basin; IAP – Iberian Abyssal Plain; IB – Iberia; MTR – Madeira Tore Rise; NFL – Newfoundland; NNB – Northern Newfoundland Basin;
SNB – Southern Newfoundland Basin; TAP – Tagus Abyssal Plain.

   Furthermore, we review a number of published studies in                ing (Manatschal and Bernoulli, 1999; Wilson et al., 2001;
order to examine the uncertainties of available plate kine-               Alves et al., 2009). Progressive extension and final lo-
matic reconstructions of the Iberia–Newfoundland conjugate                calization of the divergent plate boundary at a mid-ocean
margin (Srivastava et al., 1990; Seton et al., 2012; Greiner              ridge led to the separation of the North American and the
and Neugebauer, 2013). We do this by (a) examining the                    Iberian plates. Unlike the classic textbook examples of pas-
locations, within our new seismic data, of break-up mark-                 sive margin architecture, continental and oceanic crust are
ers commonly used by those studies and (b) utilizing these                not juxtaposed along these margins but separated by a very
published rotation schemes to reconstruct conjugate margin                wide continent–ocean transition zone (150–180 km; Eagles
transects into their pre-drift positions, examining the conse-            et al., 2015) (Fig. 1). Geophysical research into the Iberian–
quences of choosing alternative rotation parameters.                      Newfoundland margins has, to an extent, illustrated the grad-
                                                                          ual change from continental crust through structurally com-
                                                                          plex regions of exhumed continental mantle and to purely
2   Study area – tectonic evolution and controversies                     oceanic crust (e.g. Dean et al., 2015). Although transition
                                                                          zones like this have been widely studied over the past decade
The formation of the Iberian–Newfoundland conjugate mar-                  (e.g. Whitmarsh and Wallace, 2001; Manatschal et al., 2001;
gins are primarily a result of a series of northward prop-                Pérez-Gussinyé and Reston, 2001; Péron-Pinvidic and Man-
agating Late Triassic to Early Cretaceous episodes of rift-               atschal, 2009; Mohn et al., 2012), the identification so-called

www.solid-earth.net/11/397/2020/                                                                           Solid Earth, 11, 397–417, 2020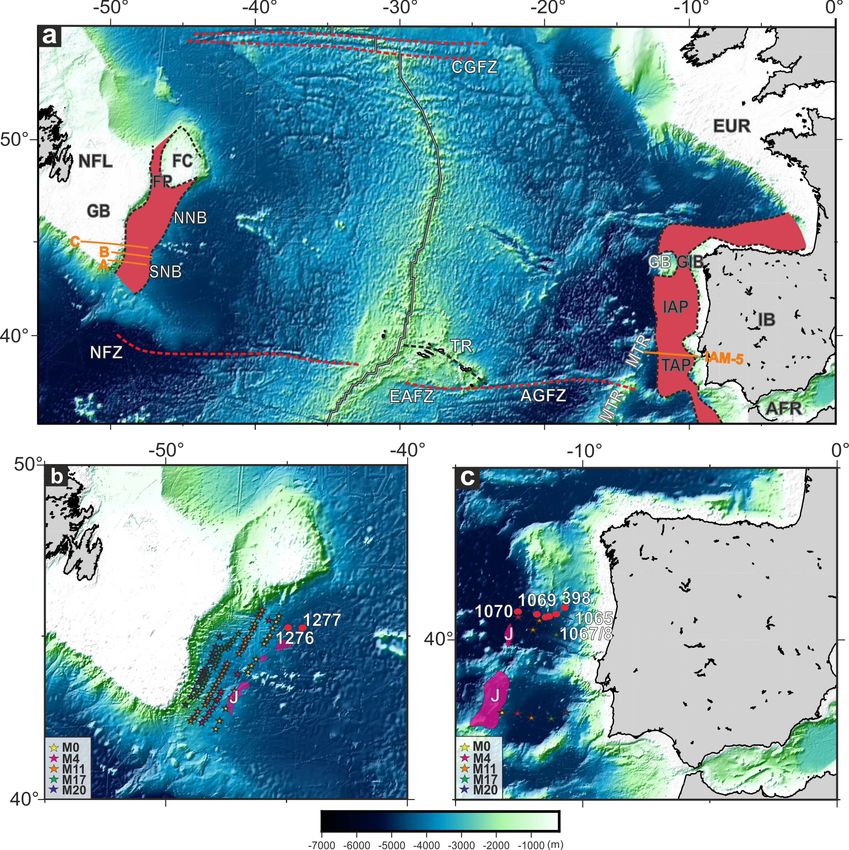
400                          A. Causer et al.: Uncertainties in break-up markers along the Iberia–Newfoundland margins

break-up features, which cannot be confidently attributed to         of the Bay of Biscay (Srivastava et al., 2000) (as shown in
either crustal type, renders kinematic reconstructions based         Fig. 2d). In the other, opening happens in a left lateral man-
on them difficult and susceptible to large uncertainties. In         ner (Olivet, 1996). The anticlockwise rotation of Iberia as
the literature, this transition is often referred to as continent–   recorded in palaeomagnetic data (e.g. Gong et al., 2008) is
ocean transition zone (COTZ) (Minshull et al., 1998; Dean et         most closely replicated by models depicting a scissor-type
al., 2000; Davy et al., 2016).                                       opening (Srivastava et al., 2000). However, models like these
   The complex architecture of the Iberian–Newfoundland              imply significant compression further east along the Iberia–
margins is the result of a sequence of extensional defor-            Eurasia plate boundary (e.g. Schoeffler, 1965; Matthews and
mation episodes beginning with an initial “wide-rift” phase          Williams, 1968; Masson and Miles, 1984; Roest and Srivas-
during Late Triassic to earliest Jurassic times (Manspeizer,         tava, 1991; Sibuet and Collette, 1991; Sibuet and Srivastava,
1988; Manatschal and Bernoulli, 1998; Tucholke et al., 2007;         1994; Srivastava et al., 1990, 2000; Cadenas et al., 2018;
Péron-Pinvidic et al., 2007), followed by the localization           Peace et al., 2019), which is not supported by field geology
of extension and related crustal thinning along the distal           (Lagabrielle et al., 2010; Tugend et al., 2014). In contrast to
part of the future margins. This resulted in the exhumation          the modelled major crustal thickening, the presence of nu-
of subcontinental mantle rocks within the transition zones,          merous bodies of subcontinental mantle rocks exposed along
which formed prior to seafloor spreading sometime in the             the North Pyrenean Zone suggests the formation of exten-
Early Cretaceous (Malod and Mauffret, 1990; Manatschal               sional basins during the Cretaceous (Bodinier et al., 1988;
and Bernoulli, 1999; Dean et al., 2000; Péron-Pinvidic et            Lagabrielle et al., 2010; Vauchez et al., 2013; Tugend et al.,
al., 2007; Tucholke et al., 2007). The exact age of the onset        2014, 2015; Teixell et al., 2018). Although some authors
of seafloor spreading is controversial and has, on the basis         have interpreted these basins as having formed in a back-arc
of regional correlations, magnetic anomaly interpretations,          setting resulting from the subduction of older oceanic litho-
and drilling results, been inferred to date from as early as         sphere from north of Iberia beneath Europe (Sibuet et al.,
Valanginian (Wilson et al., 2001) or Barremian (Whitmarsh            2004; Vissers and Meijer, 2012), they can also be understood
and Miles, 1995; Russell and Whitmarsh, 2003) to as late as          together with the opening of the Bay of Biscay as results of
around the Aptian–Albian boundary (Tucholke et al., 2007;            oblique–divergent motion between Iberia and Europe, along
Péron-Pinvidic et al., 2007; Mauffret and Montadert, 1987;           the North Pyrenean Fault (e.g. Olivet, 1996; Lagabrielle and
Boillot et al., 1988; Eddy et al., 2017).                            Bodinier, 2008). Although in this model the fit of Iberia and
   One of the difficulties in reconstructing the separation of       Eurasia, derived by fitting the prominent regional magnetic J
the Iberian–Newfoundland margins is presented by the com-            Anomaly, deteriorates to the north, it is favoured by many
plex kinematic history of the Iberian plate (Barnett-Moore et        (Stampfli et al., 2002; Jammes et al., 2009; Handy et al.,
al., 2016; Nirrengarten et al., 2017; Ady and Whittaker, 2018;       2010).
Peace et al., 2019). Although currently part of the Eurasian            Partial closure of the Bay of Biscay between Late Creta-
plate, the Iberian plate moved independently between the             ceous and Oligocene times led to the formation of the Pyre-
Late Jurassic and sometime in the Paleogene (Fig. 2). During         nees (Bullard et al., 1965; Van der Voo, 1969; Muñoz, 2002;
the Late Jurassic to Early Cretaceous, the Iberian plate was         Sibuet et al., 2004; McClay et al., 2004; Gong et al., 2008)
separated from the African, North American and European              (Fig. 2e–f). In the early Miocene, the plate boundary between
plates by divergent plate boundaries (Le Pichon and Sibuet,          Iberia and Eurasia became inactive and the Iberian plate
1971) (Fig. 2a–c). During the Aptian time, relative motions          was incorporated into the Eurasian plate (Van der Voo and
between the African, Iberian, and Eurasian plates underwent          Boessenkool, 1973; Grimaud et al., 1982; Sibuet et al., 2004;
a period of re-organization (Roest and Srivastava, 1991; Pin-        Roest and Srivastava, 1991; Vissers and Meijer, 2012) so that
heiro et al., 1996; Rosenbaum et al., 2002; Seton et al., 2012;      the boundary between Eurasia and Africa ran south of Iberia
Tavani et al., 2018). It is broadly accepted that the Iberian        and into the North Atlantic along the Azores–Gibraltar Frac-
plate undertook an anticlockwise rotation of around 35◦ with         ture Zone (AGFZ) (Le Pichon and Sibuet, 1971; Sclater et al.,
respect to the Eurasian plate, resulting in the opening of the       1977; Grimaud et al., 1982; Olivet et al., 1984; Roest and Sri-
Bay of Biscay along its northern margin (Fig. 2b–c) (Van der         vastava, 1991; Zitellini et al., 2009). The present-day AGFZ
Voo, 1969; Choukroune, 1992; Sibuet et al., 2004; Gong et            (Fig. 1) is a complex plate boundary that accommodates rel-
al., 2008). Considerable controversy still exists as to the ex-      atively small differences between Eurasian–North American
act nature, timing, and consequences of this rotation, with          and African–North American seafloor spreading rates and di-
conflicting scenarios having been proposed by authors based          rections along the Mid-Atlantic Ridge in the forms of mi-
on interpretations of geological and geophysical observations        nor extension at its western end (Searle, 1980), right-lateral
(Olivet et al., 1984; Srivastava et al., 2000; Gong et al., 2008;    strike-slip along its middle reach, and transpression in the
Vissers and Meijer, 2011). Kinematic reconstructions can be          east (e.g. Grimison and Chen, 1986; Srivastava et al., 1990;
split into two endmember groups. In one, the Bay of Biscay           Jiménez-Munt and Negredo, 2003).
is depicted as having opened in a scissor-like fashion, with
the hinge of the scissors located in the southeastern corner

Solid Earth, 11, 397–417, 2020                                                                 www.solid-earth.net/11/397/2020/
A. Causer et al.: Uncertainties in break-up markers along the Iberia–Newfoundland margins 401
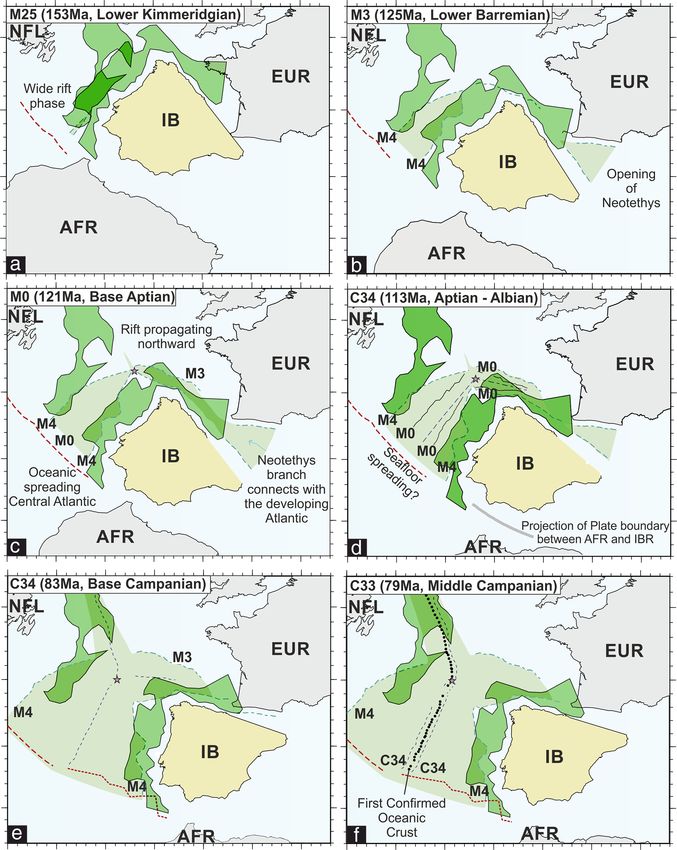
Figure 2. Six stages of development of the North Atlantic, from Late Jurassic to Late Cretaceous. Bright green envelopes show the maximum
extent of the COTZ (Eagles et al., 2015). Light green shading shows oceanic lithosphere extent according to Sibuet et al. (2007) for the
Atlantic and Sibuet et al. (2004) for the Bay of Biscay. Pink star: location of the triple junction between Eurasia–Iberia–North America.
Adapted from Vissers and Meijer (2012).
2.1 Break-up markers along the anomalies is not of itself diagnostic of crustal type, partic-
Iberian–Newfoundland margins ularly along passive margins with wide transitional zones,
such as the Iberian–Newfoundland margins. Within COTZs,
it is possible that magnetic anomalies resulting from the pres-
It is generally agreed that statistical fitting of fracture zone ence of intrusive igneous bodies within the upper crust or ex-
trends and oceanic isochrons determined from magnetic humed subcontinental mantle can be erroneously attributed
anomalies is the most accurate method of modelling the rel- to basaltic oceanic crust (e.g. Cannat et al., 2008). Similarly,
ative motions of plates for the last 200 Myr (Müller et al., oceanic crust formed at mid-ocean ridges that are overlain
1997; Seton et al., 2012). This is a consequence of the rel- by a significant thickness of sediment (Levi and Riddihough,
atively small locational error and relatively high interpreta- 1986) or formed at ultra slow spreading centres may not
tional confidence compared to other geological and geophys- give rise to strong magnetic signatures (Roest and Srivastava,
ical markers (Müller et al., 2008; Seton et al., 2012; Eagles 1991; Jokat and Schmidt-Aursch, 2007).
et al., 2015). However, the presence of magnetic reversal
www.solid-earth.net/11/397/2020/ Solid Earth, 11, 397–417, 2020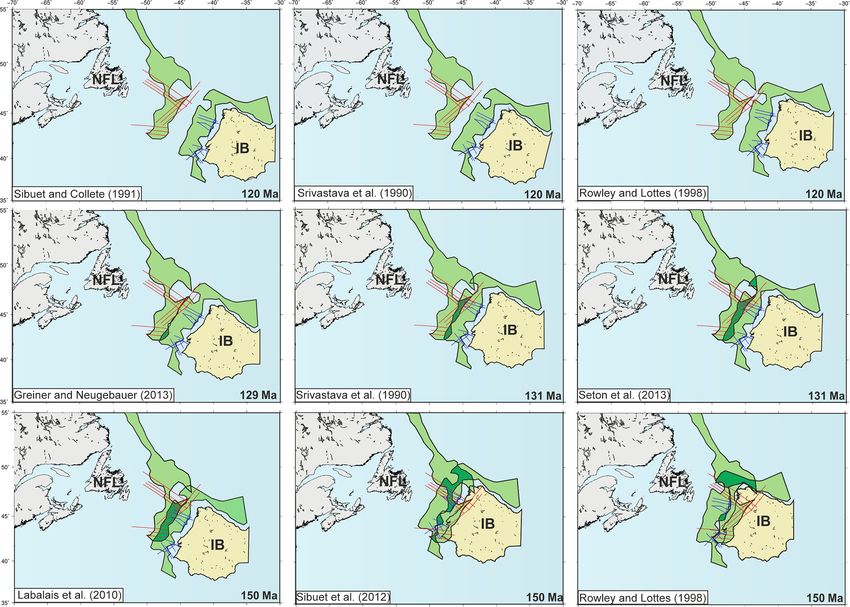
402                         A. Causer et al.: Uncertainties in break-up markers along the Iberia–Newfoundland margins

   Accordingly, whilst some researchers have interpreted
magnetic anomalies as isochrons dating back to the Late
Jurassic (chron M20, 146 Ma) to model relative motions of
the Iberian and North American plates (Srivastava et al.,
2000), their utility can be disputed by contradictory geo-
logical evidence from drill core data. At Site 1070 on the
Iberian margin (Fig. 1), for instance, serpentinized peridotite
was drilled from the location of a magnetic anomaly that had
been previously defined in terms of seafloor spreading at the
time of chron M1 (∼ 125 Ma; Whitmarsh et al., 1996; Tu-
cholke and Sibuet, 2007). Similarly, at ODP Site 1277 base-
ment associated with M1 has recently be interpreted as as-
thenospheric melts emplaced prior or coeval to mantle ex-
humation at 115 Ma (Eddy et al., 2017). Numerous seismic
surveys off both the Iberian and Newfoundland margins in-
terpret the presence of transitional crust oceanwards of M0
(120 Ma), the youngest of the M-series isochrons (Shilling-
ton et al., 2006; Dean et al., 2015; Davy et al., 2016).
   Several other M-series isochrons have been interpreted
along the North Atlantic margins from magnetic anoma-
lies that are often characterized by a somewhat subdued
(< 100 nT amplitude; Fig. 3b) magnetic signature. Although
their sources too are debated and sometimes suggested to
lie within domains of exhumed mantle and thinned conti-
nental crust (Russell and Whitmarsh, 2003; Sibuet et al.,
2004), their apparent symmetry across the rift and parallel
trend with respect to the continental margins has led many
researchers to interpret them as indicators of the presence
of old oceanic lithosphere, pre-Albian in age. The uncertain-
ties in the origin and interpretation of these anomalies also
contribute to the generally large set of discrepancies between    Figure 3. (a) Location of magnetic profiles across the Southern
plate kinematic reconstructions of Iberia and to understand-      Newfoundland Basin and conjugate Tagus Abyssal Plain shown
ing the development of the Bay of Biscay in Late Jurassic         in (b) and (c) respectively. (b) Four along-track magnetic anomaly
to Early Cretaceous times (e.g. Srivastava et al., 1990, 2000;    profiles (solid black lines) from the SNB, shown alongside a syn-
Whitmarsh and Miles, 1995; Barnett-Moore et al., 2016). For       thetic anomaly isochron model for comparison (dashed line). Pink
example, tectonic models using the M0 anomaly (125 Ma)            shading marks the high-amplitude J Anomaly, identified as M0–M1
result in a gap between eastern Iberia and Europe, the closure    by Rabinowitz et al. (1978). (c) Two along-track magnetic anomaly
of which is difficult to reconcile with geological and geo-       profiles (solid black lines) from the TAP, shown alongside a syn-
physical data from the Pyrenees (Van der Voo, 1969; Gong          thetic anomaly isochron model for comparison (dashed line). Pink
et al., 2008; Lagabrielle et al., 2010; Tugend et al., 2014).     and blue shading indicate the high-amplitude J Anomaly, identi-
                                                                  fied as M0–M4 by Whitmarsh and Miles (1995). Panels (b) and
                                                                  (c) adapted from Srivastava et al. (2000). IAP – Iberian Abyssal
2.1.1   The J anomaly                                             Plain; JA – J Anomaly; NNB – Northern Newfoundland Basin; SNB
                                                                  – Southern Newfoundland Basin; TAP – Tagus Abyssal Plain.
In addition to the interpretations of M-series isochrons, a
number of researchers have used a further regional magnetic
lineation, known as the J anomaly, as a kinematic marker of
the onset of seafloor spreading.
   First acknowledged by Pitman and Talwani (1972), the J         Newfoundland conjugates (e.g. Srivastava et al., 1990, 2000;
anomaly is a high-amplitude anomaly identifiable on each          Sibuet et al., 2004).
side of the southern North Atlantic Ocean south of the Gali-         The amplitude, from trough to peak, of the J Anomaly
cia Bank and Flemish Cap regions (Fig. 3a). Based on its          is generally 500–600 nT in the SNB and conjugate Tagus
high amplitude and apparent symmetry across the rift, many        Abyssal Plain (TAP) (Tucholke et al., 1989), reaching max-
have favoured the use of the J Anomaly over the M series as       ima of around 1000 nT over the southeast Newfoundland
a kinematic marker. As a result, the J Anomaly has formed a       Ridge and conjugate Madeira Tore Rise (Fig. 3b–c). The J
basis for many plate kinematic reconstructions of the Iberia–     Anomaly coincides with a structural step in the basement in

Solid Earth, 11, 397–417, 2020                                                               www.solid-earth.net/11/397/2020/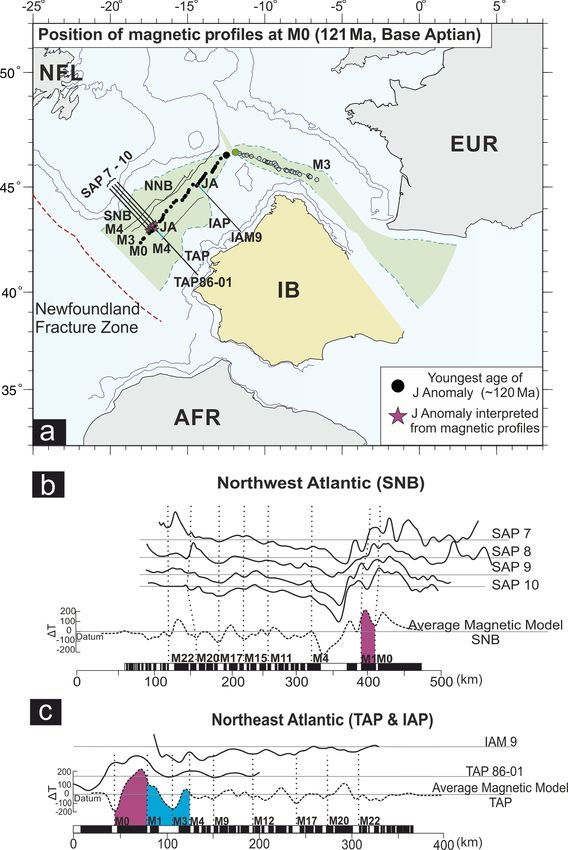
A. Causer et al.: Uncertainties in break-up markers along the Iberia–Newfoundland margins                                      403

the TAP (Tucholke and Ludwig, 1982) and with discontinu-          Southeast Grand Bank 2014 dataset, which comprises 34
ous basement ridges in the SNB (Tucholke et al., 1989).           2D seismic lines covering a combined area of 10 678 km2 .
   The origin and subsequent significance of the J anomaly        The lines discussed were acquired using a Geostreamer 24
have been interpreted in two ways in published literature.        bit (GAS) with 31.25 m shot point interval from a 4880 in.3
The first of these interpretations suggests that the J anomaly    airgun and a streamer which was 10 050 m in length. Data
is the oldest magnetic isochron of true oceanic origin formed     processing comprised Kirchhoff curved ray pre-stack time
by seafloor spreading and representative of the beginning of      migration and post-migration conditioning: F-X deconvolu-
the M-series magnetic anomalies (Keen et al., 1977; Sullivan,     tion, band-pass filter, scaling, and stretching to depth, pro-
1983; Klitgord and Schouten, 1986). It may be interpreted         viding high-resolution images of the crustal structure off-
as a superposition anomaly formed by spreading during the         shore of Newfoundland. Within the entire dataset, the three
periods of isochrons M0–M1 (Rabinowitz et al., 1978; Tu-          lines shown here were chosen as they were previously un-
cholke and Ludwig, 1982) or M0–M4 (Whitmarsh and Miles,           published and span the portion of the margin where J- and M-
1995) (Fig. 3b–c). In both cases, the J anomaly is seen as the    series anomalies are found. They extend from the continental
boundary between first formed oceanic crust and exhumed           slope through highly extended continental crust and into ex-
mantle (Reston and Morgan, 2004).                                 humed mantle domains. None of these seismic lines extend
   The alternative interpretation of the J anomaly (Bronner       far enough oceanward to image acoustic basement that can
et al., 2011) suggests that it expresses magmatic basement        be confidently attributed to true oceanic crust. They do, how-
ridges dating from the late Aptian (120–113 Ma) during the        ever, image transitional crust previously associated with the
time immediately preceding steady-state seafloor spreading.       J anomaly (M4–M1; Whitmarsh and Miles, 1995).
Both the unusually high amplitude and variable width of the          The stratigraphic framework of the SNB has not been in-
J anomaly are explained by Bronner et al. (2011) as being         vestigated in detail as part of this study. Due to the lack
the result of the interplay between excess surface magma-         of drilling data, sediments have been grouped into syn-
tism and the locations of underplated bodies at depth. The        rift 1, syn-rift 2, break-up sequence, and post-rift packages
apparent northward decrease in J anomaly amplitude and dis-       based on seismic-stratigraphic observations. Syn-rift 1 corre-
tance to chron C34 are interpreted as evidence for a north-       sponds to a sedimentary sequence that formed during fault-
ward propagating break-up. Agreeing with this line of in-         controlled extension and is characterized by reflectors which
terpretation, Nirrengarten et al. (2017) go on to question its    mimic changes in basement structure, often short in length
validity as an indicator of first seafloor spreading processes,   and at times chaotic, and onlapping structural highs. Syn-
suggesting the J Anomaly is a result of multiple magmatic         rift 2 is instead characterized by more continuous reflections,
events which occurred both during and after the formation of      arising from what we interpret as infill strata deposited be-
oceanic crust. Conversely, Gillard et al. (2016) interpret the    tween the end of fault-controlled rifting and the onset of
high-amplitude J Anomaly as a relic of syn-rift magmatism         seafloor spreading, also known as “sag sequence” (Masini
which occurred during mantle exhumation pre-dating the on-        et al., 2014). Based on its high amplitude and continuous na-
set of seafloor spreading.                                        ture, we consider our break-up sequence to mark the rupture
                                                                  of the lithosphere and onset of seafloor spreading, which we
                                                                  later tentatively date as taking place near the Aptian–Albian
3   Dataset and methods                                           boundary (e.g. Mauffret and Montadert, 1987; Boillot et al.,
                                                                  1988; Pinheiro et al., 1992; Tucholke et al., 2007; Péron-
A well-constrained plate rotation scheme for the separa-          Pinvidic et al., 2007). Although new research (Alves and
tion of the Iberian and Newfoundland margins could be             Cunha, 2018) in the conjugate TAP proposes the presence of
used to align regional seismic transects and generate a vir-      two break-up sequences, the first of which initiated in Berri-
tual rift-spanning seismic transect at the point of break-        asian times (145 Ma), our new seismic dataset does not allow
up (Fig. 4). Currently, the difficulties of interpreting pre-     us to repeat such an interpretation. Finally, post-rift strata are
Campanian seafloor and break-up markers from the mar-             found overlying a prominent unconformity. They have been
gins mean that no such rotation scheme exists entirely inde-      dated at DSDP Site 398, on the Iberian margin (Fig. 1), as
pendently of existing interpretations of presumed-conjugate       Cenomanian in age (Wilson et al., 1989; Alves et al., 2003;
pairs of seismic profiles. Work is underway on producing an       Soares et al., 2012).
independent model by combining the less controversial his-
tories of pre-Campanian seafloor spreading between neigh-
bouring Africa, North America, and Eurasia in a quantitative      4     Results
regional plate circuit model (Causer et al., 2020).
   To add to the range of candidate conjugate profile pairs,      4.1    Line A – southern Southern Newfoundland Basin
we describe and interpret here a number of previously un-
published regional 2D seismic profiles in the SNB. The            Line A, located in the southern South Newfoundland basin,
discussed seismic data were obtained from TGS-NOPEC’s             is a 444 km long margin-scale 2D seismic section, which im-

www.solid-earth.net/11/397/2020/                                                                Solid Earth, 11, 397–417, 2020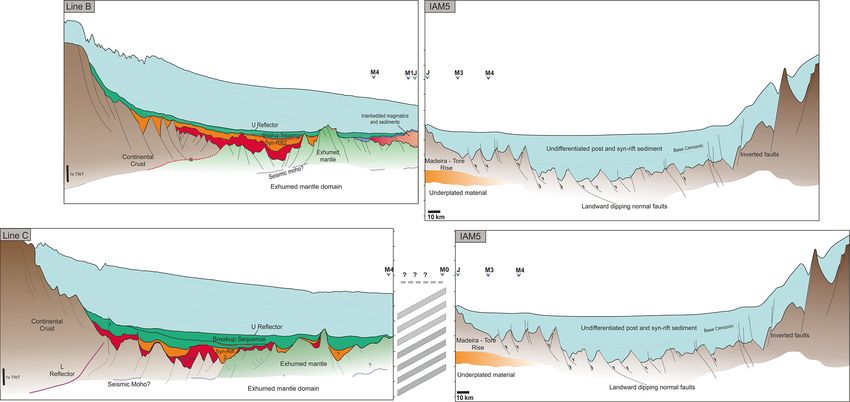
404                          A. Causer et al.: Uncertainties in break-up markers along the Iberia–Newfoundland margins

ages the entire crust beneath the Grand Banks area and off-         4.2   Line B – central Southern Newfoundland Basin
shore of Newfoundland. Part of this line is shown in Fig. 5a.
This 2D seismic section extends from the continental slope          Line B, located in the central Southern Newfoundland Basin,
through the COTZ into the distal domain.                            images a 264 km long crustal transect from unequivocal con-
   The crust of the continental shelf beneath the Southern          tinental crust beneath the landward continental shelf, through
Grand Banks is tectonically thinned by a crustal-scale rift         highly extended continental crust in the COTZ, and into a
margin fault seen in the landward part of the profile be-           zone of exhumed mantle with magmatic additions (Fig. 6a–
tween 2 and 6–7 s TWT (Fig. 5). Its hanging wall is deformed        b).
by numerous landward-dipping intra-rift faults with variable           The proximal part of the margin is characterized by nu-
offsets. At depth this large fault is traceable to around 10 s      merous parallel oceanward-dipping normal faults following
TWT, coinciding with our interpretation of the seismic Moho         a staircase-like pattern. Their vertical extents are difficult to
(Fig. 5b).                                                          map with certainty. Some of these faults are seen to termi-
   More distally, the margin is characterized by a series of        nate downwards against a high-amplitude reflector, which
domino-style rotated fault blocks, bounded by landward-             we interpret as a deep-seated landward-dipping detachment
dipping faults of varying displacements (Fig. 5b). At depth,        fault originating at the basinward limit of continental litho-
these faults seem to terminate against a high-amplitude re-         sphere (Fig. 6c). Oceanward of this high-amplitude reflector,
flector traceable to depth (Fig. 5c). This high-amplitude re-       the transition from highly extended continental crust to zones
flector can be traced to the top basement and interpreted           of exhumed mantle is marked by a smoother seismic charac-
as an exhumation fault marking the distal extent of thinned         teristic of top basement.
continental lithosphere. Oceanward of this point, the base-            In the exhumed mantle zone, a prominent basement high
ment is deformed by a series of alternating landward- and           bisects the break-up sequence. The internal structure of the
oceanward-dipping normal faults (Fig. 5d). This change in           high is poorly imaged, making interpretations within it chal-
seismic character of the basement and its coincidence with          lenging (Fig. 6d). Landward of this high, a series of large
the high-amplitude reflector can be interpreted as the transi-      basement faults bound a relatively symmetrical 80 km wide
tion from highly extended continental crust to exhumed man-         sub-basin infilled with a thick syn-rift sedimentary sequence.
tle. Landward of this location, the continental crust in the rift   Towards the seaward part of the profile we interpret a pack-
basin has been thinned progressively via landward-dipping           age of seaward-dipping reflectors (Fig. 6e), the top of which
intra-rift faults and larger oceanward-dipping faults, possi-       is marked by a high-amplitude reflector. This package coin-
bly detached at depth (Fig. 5a–b). However, eastward of the         cides with the interpreted location of the J Anomaly. Here, by
high-amplitude reflector the imaging of acoustic basement is        analogy to drilled margins with similar characteristics (e.g.
poor due to the presence of high-impedance post-rift strata.        the south Australian margin; Ball et al., 2013), we suggest
   In the most seaward part of the profile, high-amplitude re-      the acoustic basement to comprise a mixture of sediments
flectors are traceable within what we interpret as a volcanic       and lava flows. Laterally, SDRs are seen to onlap onto a fault,
edifice (Fig. 5c). Within it, reflectors dip in opposing direc-     perhaps indicating a degree of control by extension processes
tions, which may be a result of velocity pull-up (e.g. Magee        on magmatism (Fig. 6e).
et al., 2013). Short discontinuous reflectors within the vol-
canic edifice are observed to onlap on to syn-rift 1 strata         4.3   Line C – northern Southern Newfoundland Basin
and the interpreted top of the exhumed mantle (Fig. 5e). Al-
though sediments associated with break-up and post-rift se-         Line C, located in the northernmost part of the Southern
quences also onlap this syn-rift 1 or basement high, their          Newfoundland Basin, is a 444 km long section which images
seismic character is noticeably different. onlapping reflec-        the continental margin across the Grand Banks and offshore
tors within the volcanic edifice are shorter and brighter than      of Newfoundland. Figure 7a–b shows a 180 km long ocean-
and not as planar as those observed in the break-up and post-       ward segment of this seismic line, focusing on the continental
rift sequences (Fig. 5e). Beneath these brighter non-planar         shelf, highly extended continental crust, and the COTZ.
reflections the basement is poorly imaged, Accordingly, we             At the base of the continental slope, which is characterized
interpret the internal high-amplitude reflectors as sills, as in-   by a series of oceanward-dipping faults, a landward-dipping
terpreted elsewhere in the basin (e.g. Hansen et al., 2004) as      high-amplitude reflector can be traced to a depth equiva-
well as on lines B and C. We have also tentatively identified a     lent of 10 s TWT. Oceanward, the basement is characterized
potential hydrothermal vent dyke, marked by a vertical zone         by regularly spaced landward-dipping domino-style rotated
of chaotic and low-amplitude reflectivity topped by a conical       fault blocks (Fig. 7c), above which we identify the presence
body situated on the flank of a basement high (e.g. Planke          of sedimentary packages corresponding to syn-rift 1, syn-
et al., 2005). Imaging beneath the edifice is poor, rendering       rift 2, and the break-up sequence.
interpretations of the underlying basement difficult.                  As before, we tentatively interpret the transition between
                                                                    extended continental crust and transitional crust from the
                                                                    smoothing of top basement. The COTZ is presumed to be

Solid Earth, 11, 397–417, 2020                                                                www.solid-earth.net/11/397/2020/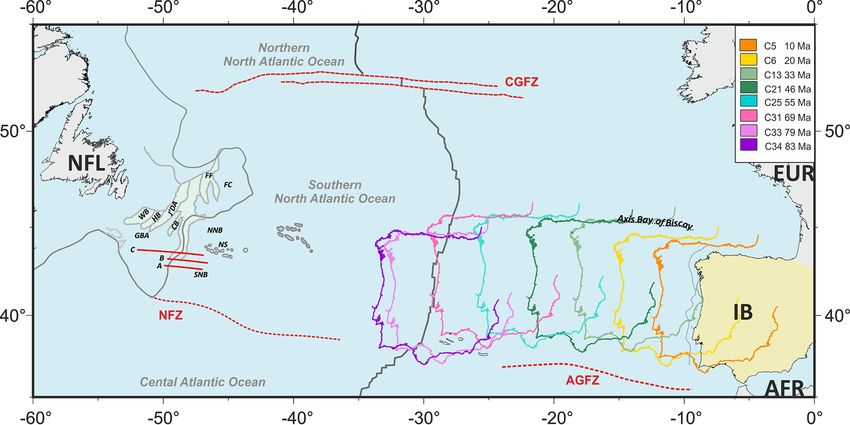
A. Causer et al.: Uncertainties in break-up markers along the Iberia–Newfoundland margins 405
Figure 4. Map showing the positions of Iberia relative to North America from first unequivocal oceanic crust (83 Ma), as modelled by Seton
et al. (2012) for C3–C6, Srivastava et al. (1990) for C13–C31 and C34, and Macchiavelli et al. (2017) for C33. Numerical chron ages are
Gradstein et al. (2012). Red lines show the position of seismic sections A–C, provided by TGS. CB – Carson Basin; FC – Flemish Cap; FP –
Flemish Pass; GBA – Grand Banks; HB – Horseshoe Basin; NS – Newfoundland Seamounts; NNB – Northern Newfoundland Basin; SNB
– Southern Newfoundland Basin; WB – Whale Basin.
floored by exhumed mantle, as recovered at sites 1276–1277 5 Discussion
(Tucholke and Sibuet, 2007) further north in the Northern
Newfoundland Basin (NNB). Within our interpreted region The Iberia–Newfoundland margins have been extensively
of exhumed mantle, individual fault blocks are no longer in- surveyed and studied over the past decade. The three seis-
terpretable. The prominent basement high shown in Fig. 7d mic lines presented here, across the previously poorly doc-
may be interpreted as a serpentinite diapir, as seen elsewhere umented SNB, further illustrate the complexity of this con-
within the Iberian Abyssal Plain and offshore of the Galicia jugate margin and are interpretable within the context of the
Bank region (e.g. Boillot et al., 1980, 1995). existing and growing literature on extended continental mar-
gin processes. We interpret these lines as extending from the
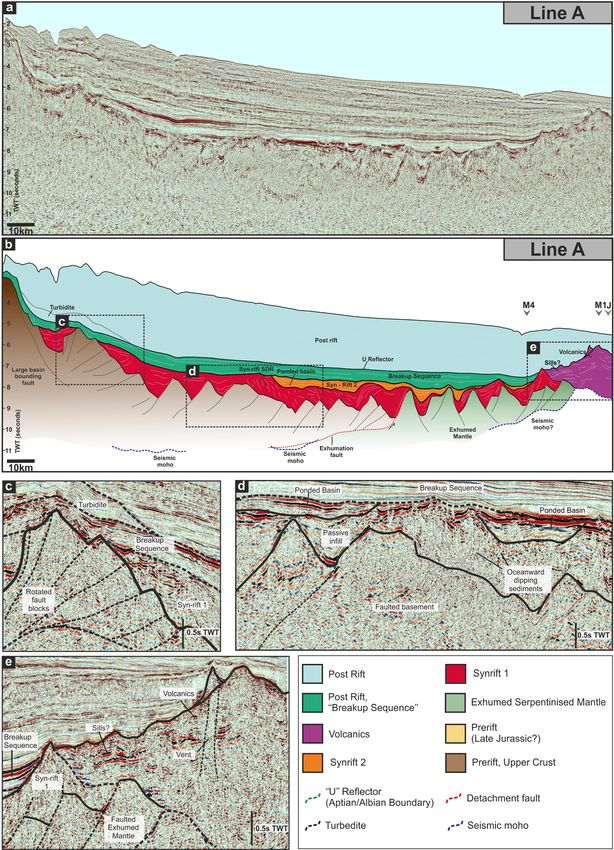
4.4 IAM5 – Tagus Abyssal Plain continental shelf through highly extended continental crust
and into distal deepwater basin characterized by the presence
The wide-angle 350 km long seismic profile IAM5 images
of exhumed mantle.
crust from the continental slope into the distal domain of the
Our interpretations of the geological and structural history
TAP (Fig. 9). Although previously described in detail in the
of the SNB also allow us to speculate about the origin of
literature (e.g. Pinheiro et al., 1992; Afilhado et al., 2008;
magnetic anomalies previously interpreted as diagnostic of
Neves et al., 2009), we take this section into consideration
oceanic lithosphere and extensively used as grounds upon
in order to provide an Iberian conjugate to the new seismic
which to base plate tectonic reconstructions of the North At-
profiles described previously.
lantic.
IAM5 is characterized by large oceanward-dipping and
smaller landward-dipping basement faults in the COTZ,
some of which propagate upwards into “undifferentiated” 5.1 Magnetic isochron interpretation: M series and J
syn and post-rift sequences. A rise in basement toward the anomaly
ocean is observed some 160 km from the base of the con-
tinental slope. Here, fault blocks still consistently dip to- Some authors (e.g. Srivastava and Tapscott, 1986; Srivastava
ward the continent. Additionally in this distal domain, a high- et al., 1990, 2000) identify the presence of M-series mag-
amplitude reflector is traceable above top basement, to 6 s netic reversal isochrons from magnetic anomalies recorded
TWT. Although the syn and post-rift break-up sequences are along the Newfoundland margin, attributing them to the pres-
undifferentiated, the presence of sediments older than base ence of oceanic lithosphere. Our results do not support such
Cenozoic has not been interpreted within this high (see Neves an interpretation. Instead, along both lines A (Fig. 5) and B
et al., 2009). (Fig. 6) these anomalies (M1–M4) are sourced within zones
of exhumed mantle which, in places, may be intruded by
magmatic additions of uncertain age. In Line B (Fig. 6),
the interpreted M-series isochrons coincide with the high-
amplitude oceanward-dipping reflectors that we interpret as
www.solid-earth.net/11/397/2020/ Solid Earth, 11, 397–417, 2020406 A. Causer et al.: Uncertainties in break-up markers along the Iberia–Newfoundland margins Figure 5. (a–b) Un-interpreted and interpreted seismic reflection profile (“Line A”) from the southern Southern Newfoundland Basin. Interpretation shows the basement structure and sedimentary units. (c) Basement structure at the base of the continental slope. (d) Oceanward- dipping reflectors in syn-rift 1 sediments. (e) Volcanic edifice present in the proto-oceanic zone with associated sills and magmatic vents. All data courtesy of TGS. SDR packages of interbedded volcanics and sediments. The volcanic edifice, sills, and feeder dykes in Line A (Fig. 5) formation of these features is usually associated with man- may also be coeval with the final stages of plate rupture or tle dynamics during plate rupture rather than the formation a relic of post-rift magmatism (Stanton et al., 2016). Post- of steady-state igneous crust (e.g. Keir et al., 2009). Here, rift volcanism associated with volcanism is generally asso- they may indicate the “onset” of magmatic-driven extension ciated with volcanic chains such as the Madeira Tore Rise (Tugend et al., 2018) preceding the establishment of seafloor or isolated seamounts identified in the Northern Newfound- spreading and production of true oceanic lithosphere. The land Basin (Nirrengarten et al., 2017). However, to date no Solid Earth, 11, 397–417, 2020 www.solid-earth.net/11/397/2020/
A. Causer et al.: Uncertainties in break-up markers along the Iberia–Newfoundland margins                                                407

Figure 6. (a–b) Un-interpreted and interpreted seismic reflection profile (“Line B”) from the central Southern Newfoundland Basin. Inter-
pretation shows the basement structure and sedimentary units. (c) Crustal collapse of the hanging wall along a large-scale landward-dipping
fault resulting in extremely thinned continental crust. (d) Section of syn-rift sediments within the exhumed mantle zone. (e) Bright-amplitude
oceanward-dipping reflectors interpreted as a mixture of sediment and magmatic flows beneath an igneous top basement. All data courtesy
of TGS.

seamounts as shown in Line A have been identified in the                 indicate that, at the time of magmatism, plate divergence
SNB.                                                                     was still controlled by tectonic faulting and the transition
   Our interpretations align with those of Russell and Whit-             to seafloor spreading had not yet occurred. Although we ac-
marsh (2003) and Sibuet et al. (2004), who attribute the sub-            knowledge that the limited quantity of new data available to
dued amplitudes of the Newfoundland margins’ magnetic                    us is not, on its own, sufficient to draw a complete picture,
anomalies to source bodies in highly extended continental                it suggests that the J anomaly does not represent a bound-
crust and exhumed mantle rather than the upper layers of a               ary between purely oceanic lithosphere and exhumed mantle
“standard” 7 km thick oceanic crust.                                     transitional domains (e.g. Reston and Morgan, 2004) but in-
   Our seismic Line B (Fig. 6) images crust associated with              stead that its source lies within or on the latter.
the J Anomaly in the SNB. The anomaly coincides with                        Although our results suggest that M-series magnetic
an area of interpreted interbedded sedimentary and igneous               anomaly isochrons within the Newfoundland margin do not
packages, which are onlapping a basement fault. This might               originate from purely oceanic lithosphere, they can be used

www.solid-earth.net/11/397/2020/                                                                         Solid Earth, 11, 397–417, 2020
408                           A. Causer et al.: Uncertainties in break-up markers along the Iberia–Newfoundland margins

Figure 7. (a–b) Un-interpreted and interpreted seismic reflection profile (“Line C”) from the northern Southern Newfoundland Basin. Inter-
pretation shows the basement structure and sedimentary units. (c) Continental crust thinned by small normal faults. (d) Possible serpentinite
diapir within the zone of exhumed mantle. All data courtesy of TGS.

to estimate the minimum possible age of the basement un-                    According to Bronner et al. (2011) the J Anomaly re-
derlying them. Based on this, we suggest that the Newfound-              sults from late Aptian (120–103 Ma) magmatism, preceding
land margin may have been magmatically influenced since                  seafloor spreading. They suggested that northward propagat-
the early Aptian (coinciding with M4, ∼ 128 Ma) (Fig. 5),                ing magmatism from which the J Anomaly originates be-
earlier than previously thought (e.g. Tucholke and Ludwig,               gan in the northern central Atlantic and was restrained at
1982; Tucholke et al., 2007; Stanton et al., 2016).                      the Newfoundland Fracture Zone for 10 Myr before reach-

Solid Earth, 11, 397–417, 2020                                                                       www.solid-earth.net/11/397/2020/
A. Causer et al.: Uncertainties in break-up markers along the Iberia–Newfoundland margins                                              409

Figure 8. Reconstructions of the COTZ envelope from Eagles et al. (2015) at (a) Aptian, (b) Barremian, and (c) Tithonian (“full-fit”) times,
showing the range of virtual conjugates generated by alternative rotation schemes. Blue and red lines are the TGS Iberian and Newfoundland
datasets, respectively. NFL: Newfoundland; IB: Iberia.

ing the NNB in the Iberian-Newfoundland rift at the Aptian–             5.2    Conjugate pair matching
Albian transition (112 Ma). Our results suggest a slightly dif-
ferent timing, with magmatic activity present in the SNB at             The wide range of processes interpretable from our new data
a time coinciding with M4 (128 Ma), some 6–8 Myr younger                and previous studies of the Iberia–Newfoundland margins il-
than that proposed by Bronner et al. (2011). Although our               lustrates a degree of asymmetry that makes it impossible to
data suggest an earlier age of magmatism than Bronner et                unequivocally identify conjugate pairs of seismic transects
al. (2011), we cannot comment on first ages of magmatism                from their geometric and stratigraphic characteristics alone.
further north along margin.                                             An alternative approach could be to select conjugates by ro-
   Further north (e.g. Tucholke et al., 2007; Bronner et al.,           tating margin-wide seismic lines into coincidence at pre-drift
2011; Nirrengarten et al., 2017), ODP drilling of rocks as-             times. However, the results of doing this are strongly depen-
sociated with the J Anomaly in the NNB revealed a similar               dent on the choice of rotation scheme and their inherent un-
assemblage of exhumed mantle and intrusive and extrusive                certainties. Figure 8 illustrates the wide range of pre-rift posi-
mafic rocks. The drilling results suggested that magmatic ac-           tions resulting from seven published plate kinematic models
tivity had been persistent from ∼ 128 Ma (M4) to ∼ 70 Ma                for Barremian times (Rowley and Lottes, 1988; Srivastava
(Jagoutz et al., 2007).                                                 et al., 1990; Sibuet and Collette, 1991; Labails et al., 2010;
   Although the J anomaly may be associated with events im-             Seton et al., 2012; Greiner and Neugebauer, 2013). Plate re-
mediately preceding first seafloor spreading, these events are          constructions to younger time slices are unsuitable for iden-
neither instantaneous in time nor isochronous along the mar-            tifying conjugates; because of the significant underlap, they
gin, which renders the J Anomaly unsuitable as a kinematic              result in between the seismic surveys either side of the ocean.
marker.                                                                 Similarly, full-fit reconstructions back to early Jurassic times
                                                                        result in large overlaps of the extended continental margins
                                                                        (Fig. 8).

www.solid-earth.net/11/397/2020/                                                                        Solid Earth, 11, 397–417, 2020
410 A. Causer et al.: Uncertainties in break-up markers along the Iberia–Newfoundland margins Figure 9. Comparison of “conjugate” seismic lines chosen on the basis of alternative rotation schemes for Barremian times. Conjugates according to (a) Greiner and Neugebauer (2013) and Seton et al. (2012) and (b) Srivastava et al. (1990). Conjugate comparisons are hung on 10 s TWT. Key as in Figs. 5–7. Seton et al.’s (2012) reconstruction (Fig. 8b2) is based on (Fig. 9). Their rotation scheme is derived from a model an “extreme-oceanic” interpretation, with magnetic isochron in which structural markers are used to constrain the posi- picks in the sequence back to M20 (Srivastava and Tap- tion of Iberia during the Barremian, most notably Keen and scott, 1986; Srivastava et al., 2000). This model keeps Iberia de Voogd’s (1988) COB, which they interpreted as coincid- fixed to Africa throughout Barremian times. Alternatively, ing with a prominent landward-dipping reflector (the L re- the model of Greiner and Neugebauer (2013) (Fig. 8b1) re- flector, see Reid, 1994). The use of this feature shifts Iberia’s lies on the magnetic dataset of Srivastava et al. (2000) alone palaeo-position 50–100 km further south than that modelled to produce best-fitting reconstructions of M-series isochrons using identified magnetic isochrons alone. interpreted from dense magnetic data off Newfoundland and The validity of the “L” reflector as a break-up marker sparser data off Iberia. In contrast, prior to chron M0, Srivas- can, however, be questioned on the basis of the huge vari- tava et al.’s (1990) (Fig. 8b3) relies more strongly on seismic ety of alternative COB interpretations published before and interpretations of conjugate changes in basement characteris- since Keen and de Voogd’s (1988) study, which in this region tics, conjugate fracture zones, and conjugate COB segments. differ by up to 200 km (Eagles et al., 2015). More specifi- The reconstruction of Seton et al. (2012) results in sig- cally, Funck et al. (2003) identified the L Reflector offshore nificantly more overlap of the COTZ envelopes than that of Flemish Cap to lie well inboard of the COTZ within the of Greiner and Neugebauer (2013). Overlaps in the COTZ continental slope. We tentatively interpret a high landward- suggest that the extended continental margins had not yet dipping reflector traceable into the continental shelf in our reached their present-day widths at this time. The early stages Line C (Fig. 7), similar to the described L reflector thought of continental separation, as described by these models, are to mark the COB. subject to significant uncertainty, resulting from (a) the as- Discriminating between “good” and ‘bad” reconstructions sumption that M-series anomalies are of oceanic origin and on the basis of the transects they reunite is clearly challeng- (b) the difficulty in interpreting subdued magnetic signals. ing. In the case discussed here, no strong arguments can be This is illustrated by the differences in the reconstructions made regarding which of our new seismic lines (Line B or produced by the models, shown in Fig. 8b1 and b2. Despite Line C) is the more likely conjugate to IAM5 based on their the differences between the models of Greiner and Neuge- structural and stratigraphic characteristics. Neither line dis- bauer (2013) and Seton et al. (2012), both suggest Line B as plays features which can be solely attributed to an upper or a conjugate to IAM5 prior to seafloor spreading (Fig. 9). lower plate setting in asymmetric margins (e.g. Lister et al., Alternatively, the model by Srivastava et al. (1990) sug- 1986). The proximal domains of both Line B and C in the gests a conjugate pair consisting of Line C and IAM5 SNB are characterized by progressive continental lithosphere Solid Earth, 11, 397–417, 2020 www.solid-earth.net/11/397/2020/
A. Causer et al.: Uncertainties in break-up markers along the Iberia–Newfoundland margins                                          411

thinning by tectonic faulting, in places observed to terminate         Differences in the relative positions of Iberia and New-
against large continent-dipping detachment faults. Faulting         foundland according to published Barremian age plate recon-
of continental lithosphere can also be observed on the Iberian      structions built on the basis of structural data vs. magnetic
side in line IAM5, although in this case detachment surfaces        data illustrate the uncertainties introduced into the modelling
are not imaged. Across the interpreted transitional domains,        procedure by the use of extended continental margin data
exhumed mantle, diapirs, and extrusive flows are present in         (dubious magnetic anomaly identifications, break-up uncon-
lines B and C but absent in line IAM5, where underplat-             formity interpretations). In the SNB, we interpret the extent
ing has been suggested instead, although its age is uncertain       of the COTZ to reach oceanward to at least M0 (118 Ma). As
(Mauffret et al., 1989; Peirce and Barton, 1991; Pinheiro et        a result, a complementary approach is needed for constrain-
al., 1992; Bronner et al., 2011). The Madeira Tore Rise, lo-        ing plate kinematics of the Iberian plate pre-M0 times. In this
cated at the distal end of IAM5, results from alkaline mag-         respect we anticipate that the palaeo-position of Iberia could
matism post-dating break-up, which may also have resulted           come to be more confidently reconstructed using a larger
in the formation of volcanic edifices such as that seen in Line     more comprehensive plate model that encompasses the cen-
A in the SNB.                                                       tral and southern North Atlantic Ocean.
   These observations illustrate the challenge of discriminat-         Our new data and previous studies of the Iberia–
ing between good and bad rotation schemes on the basis of           Newfoundland margins illustrate a diversity of features that
the conjugate transects they produce. This challenge could be       define conjugate asymmetry and along-strike variability to
greatly eased if informed by robust plate models built from         the extent that it becomes impossible to unequivocally iden-
high-confidence data with quantified uncertainties.                 tify conjugate pairs of seismic transects from their geomet-
                                                                    ric and stratigraphic characteristics alone. Although our new
                                                                    data do not provide sufficient clarity about conjugate pairs,
6   Conclusions                                                     they are helpful to clarify the temporal context for future
                                                                    plate kinematic reconstructions.
In this paper we have presented and described three new seis-          A robust plate kinematic model built from well-
mic transects from the Southern Newfoundland Basin and              constrained spreading data and involving a larger plate cir-
used them to discuss the validity of widely used so-called          cuit would provide the basis to generate virtual rift-spanning
break-up markers along the Iberian–Newfoundland margins             seismic transects at the time of continental break-up. This,
and the use of these features for plate kinematic modelling.        in turn, would make it possible to investigate further how
In addition, we have illustrated the uncertainties in current       the processes related to continental break-up are recorded in
plate models by restoring seismic transects to their pre-break-     the sedimentary architecture of rifted margins. Such a plate
up locations utilizing existing rotation schemes of Barremian       model does not yet exist.
age. Interpretation of our new seismic dataset has revealed
the following.
   M-series magnetic anomalies are not diagnostic of true           Data availability. Seismic data were supplied to us by TGS and
oceanic crust beneath the SNB. Instead they are attributed          are not publicly available. Other figures in this paper are created
to susceptibility contrasts between zones of highly extended        using data (e.g poles of rotation) which are already in circulation;
continental crust and exhumed mantle in the basin floor. Sim-       reference to these data sources can be found in the figure caption.
ilarly, the high-amplitude J Anomaly coincides with a zone
of exhumed mantle punctuated by significant volcanic addi-
                                                                    Author contributions. AC drafted the original manuscript and fig-
tions and is at times characterized by interbedded volcanics
                                                                    ures, with contributions from all authors. LPD, GE, and JA further
and sediments.                                                      contributed to the refinement and improvement of the paper both
   In the southern part of the Newfoundland margin, we sug-         before the original submission and through the review process.
gest J-anomaly source bodies to be the result of mantle dy-
namics preceding plate rupture. Previously published studies
show that, further north, the J anomaly is either too weak          Competing interests. The authors declare that they have no conflict
to recognize or missing altogether. Although associated with        of interest.
events immediately preceding first seafloor spreading, these
events are neither instantaneous in time nor isochronous
along the margin, which renders the J Anomaly unsuitable            Special issue statement. This article is part of the special issue
as a kinematic marker.                                              “Understanding the unknowns: the impact of uncertainty in the geo-
   Our results show that magmatic activity was underway in          sciences”. It is not associated with a conference.
the SNB at a time coinciding with M4 (128 Ma), earlier than
previously thought. SDR packages onlapping onto a base-
ment fault suggest that, at this time, plate divergence was still
being accommodated, at least partially, by tectonic faulting.

www.solid-earth.net/11/397/2020/                                                                   Solid Earth, 11, 397–417, 2020
You can also read