UND Scholarly Commons - University of North Dakota
←
→
Page content transcription
If your browser does not render page correctly, please read the page content below
University of North Dakota
                                                                      UND Scholarly Commons

Theses and Dissertations                                        Theses, Dissertations, and Senior Projects

January 2021

Using Machine Learning On Diverse Datasets To Predict Drug-
Induced Liver Injury
Temidayo Adeluwa

Follow this and additional works at: https://commons.und.edu/theses

Recommended Citation
Adeluwa, Temidayo, "Using Machine Learning On Diverse Datasets To Predict Drug-Induced Liver Injury"
(2021). Theses and Dissertations. 4057.
https://commons.und.edu/theses/4057

This Thesis is brought to you for free and open access by the Theses, Dissertations, and Senior Projects at UND
Scholarly Commons. It has been accepted for inclusion in Theses and Dissertations by an authorized administrator
of UND Scholarly Commons. For more information, please contact und.commons@library.und.edu.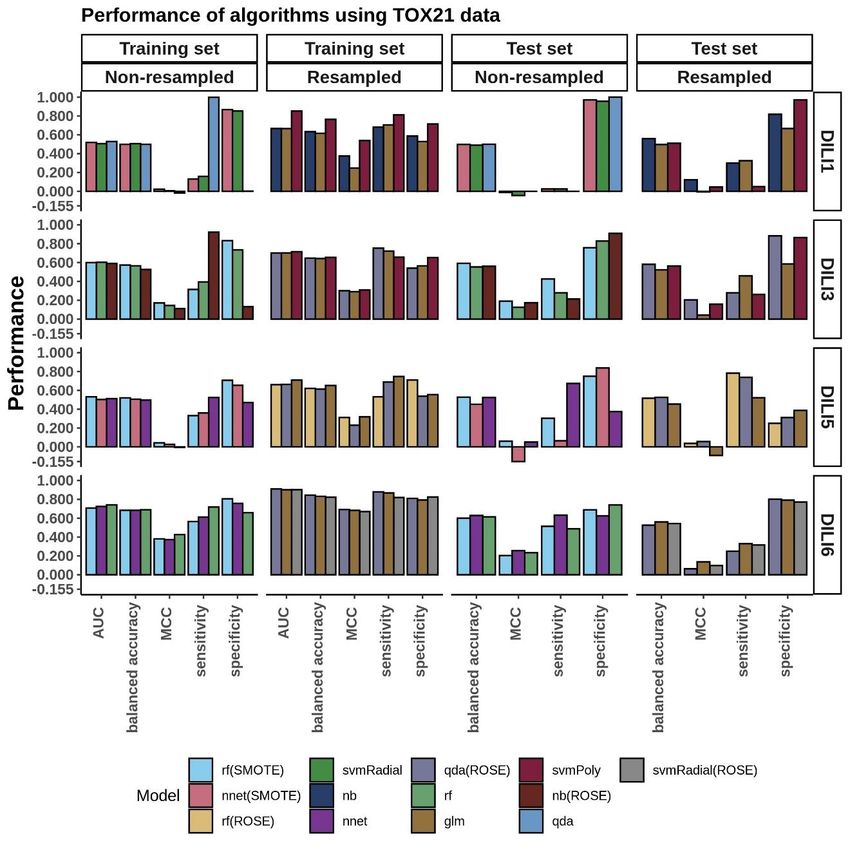
USING MACHINE LEARNING ON DIVERSE DATASETS TO PREDICT DRUG-
                   INDUCED LIVER INJURY

                                    by
                        Temidayo Peter Adeluwa
         Bachelor of Science, University of Lagos, Nigeria (2016)

                                A Thesis
                    Submitted to the Graduate Faculty

                                  of the

                       University of North Dakota

                in partial fulfillments of the requirements

                            for the degree of

                            Master of Science

                       Grand Forks, North Dakota

                              August 2021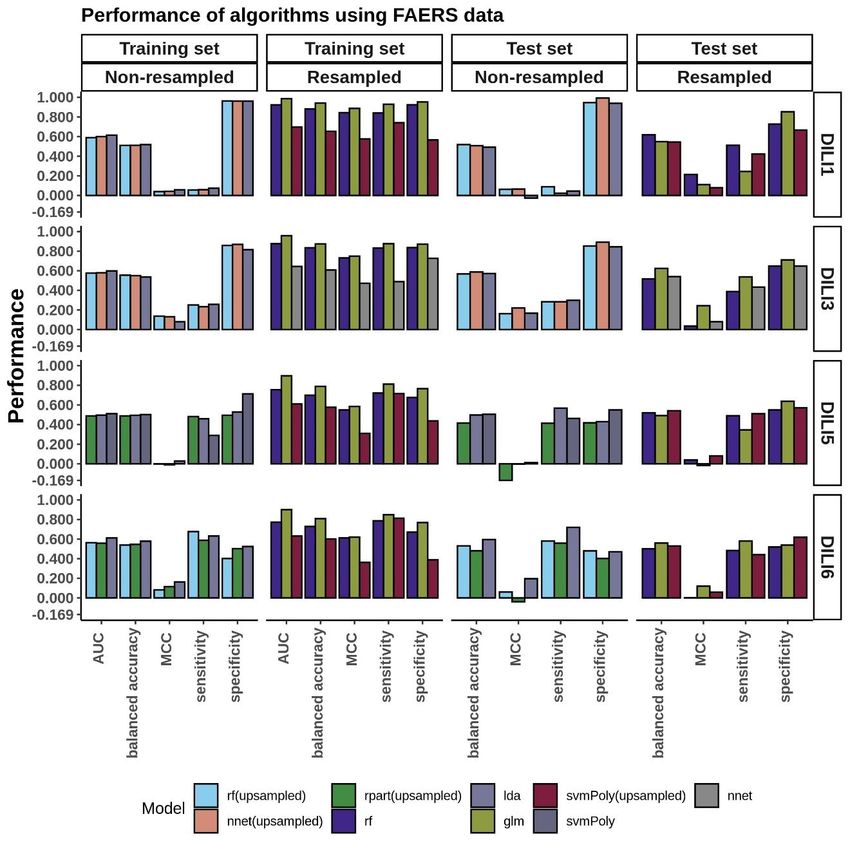
Copyright 2021 Temidayo Peter Adeluwa

                 ii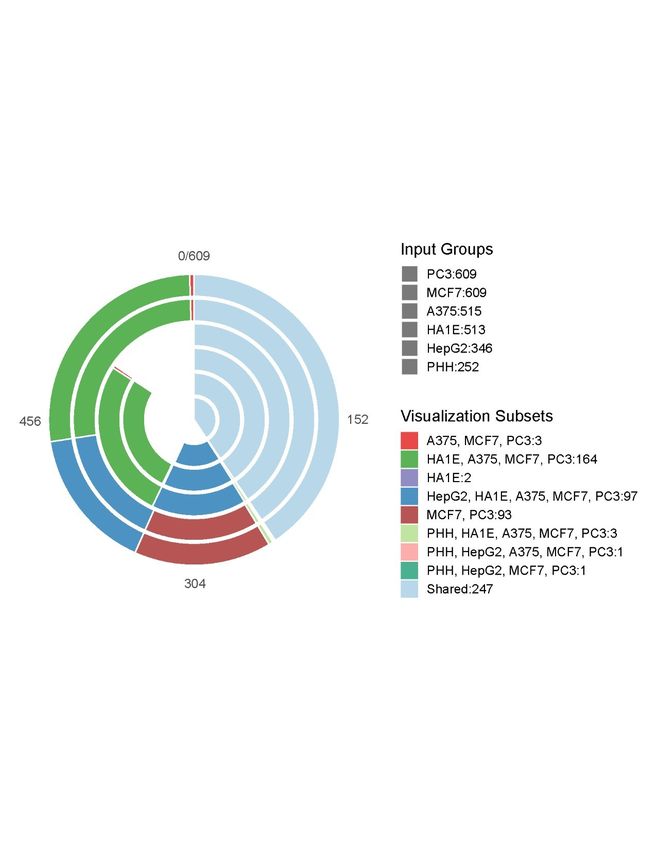
DocuSign Envelope ID: D3737FDC-7DB8-41BE-A86A-8FBABF8C441F

                                                        Temidayo Adeluwa
                                           Name:
                                                        Master of Science
                                           Degree:

                   This document, submitted in partial fulfillment of the requirements for
            the degree from the University of North Dakota, has been read by the Faculty
            Advisory Committee under whom the work has been done and is hereby
            approved.

                                                                    ____________________
                                                                   Junguk Hur

                                                                    ____________________
                                                                    Marina Kim

                                                                    ____________________
                                                                    Motoki Takaku

                   This document is being submitted by the appointed advisory
            committee as having met all the requirements of the School of Graduate
            Studies at the University of North Dakota and is hereby approved.

            ____________________________________
            Chris Nelson
            Dean of the School of Graduate Studies

            7/26/2021______________________

            Date

                                                iii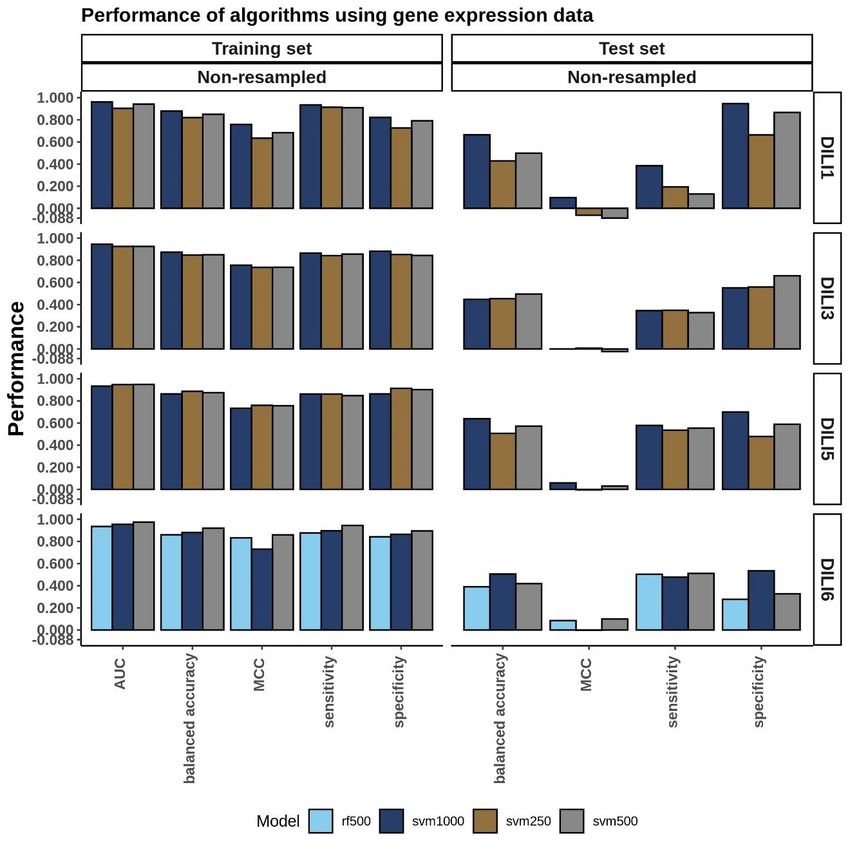
PERMISSION

Title:         Using Machine Learning on Diverse Datasets to Predict Drug-Induced
               Liver Injury
Department:    Biomedical Sciences
Degree:        Master of Science

In presenting this thesis in partial fulfillment of the requirements for a graduate degree
from the University of North Dakota, I agree that the library of this University shall make
it freely available for inspection. I further agree that permission for extensive copying for
scholarly purposes may be granted by the professor who supervised my thesis work or, in
his absence, by the Chairperson of the department or the dean of the School of Graduate
Studies. It is understood that any copying or publication or other use of this thesis or part
thereof for financial gain shall not be allowed without my written permission. It is also
understood that due recognition shall be given to me and to the University of North
Dakota in any scholarly use which may be made of any material in my thesis.

                                                                  Temidayo Peter Adeluwa
                                                                               August, 2021

                                             iv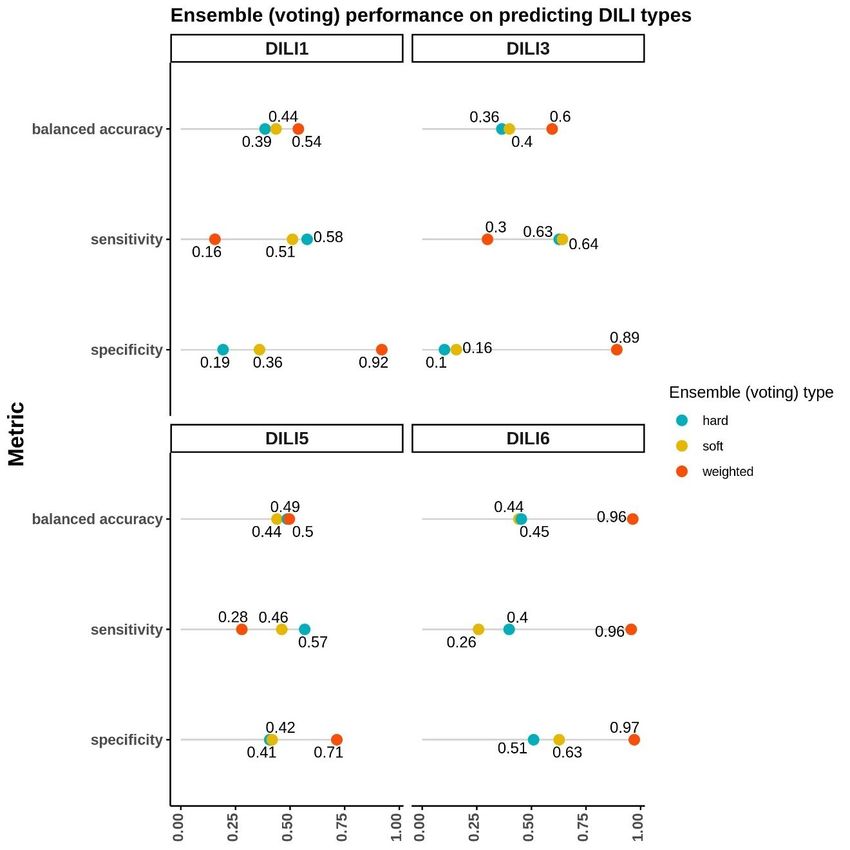
TABLE OF CONTENTS

LIST OF TABLES…....................................................................................................….viii

LIST OF FIGURES…....................................................................................................….ix

LIST OF EQUATIONS....................................................................................................…x

ACKNOWLEDGEMENTS............................................................................................….xi

DEDICATION…….......................................................................................................….xii

ABSTRACT………….......................................................................................................xiii

CHAPTER

1. INTRODUCTION…………...........................................................................................1

2. LITERATURE REVIEW…..........................................................................................10

          Pathogenesis and Mechanisms of DILI.................................................................10

          Types of DILI………............................................................................................13

          Diagnosis of DILI……..........................................................................................14

          Problem Statement….............................................................................................18

3. METHODOLOGY........................................................................................................19

                                                            v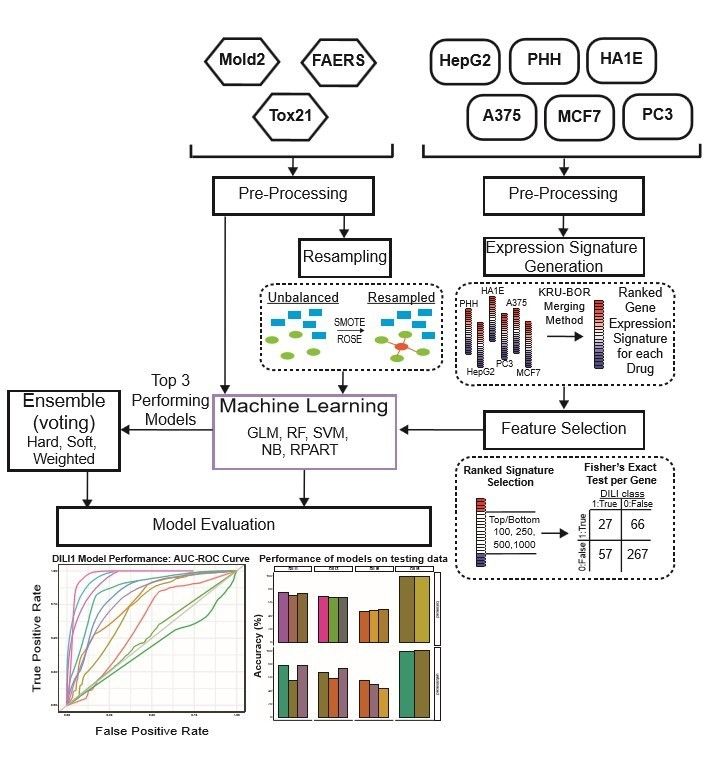
Data Processing……….........................................................................................19
Food and Drug Administration Adverse Event Reporting System (FAERS).......22
Toxicology in the 21st Century (TOX21)………………..............................….....22
Molecular Descriptors from 2D Structures (MOLD2)………………............…..22
Connectivity Map L1000 Gene Expression Data……………………..………....23
Kruskal-Borda Merging.........................................................................................23
Feature Selection……….......................................................................................24
Machine Learning……..........................................................................................24
Model Evaluation……...........................................................................................26
Ensemble Voting Machine Learning.....................................................................28
4. RESULTS…..………………………………………………………………………....30
FAERS Modeling………………..........................................................................30
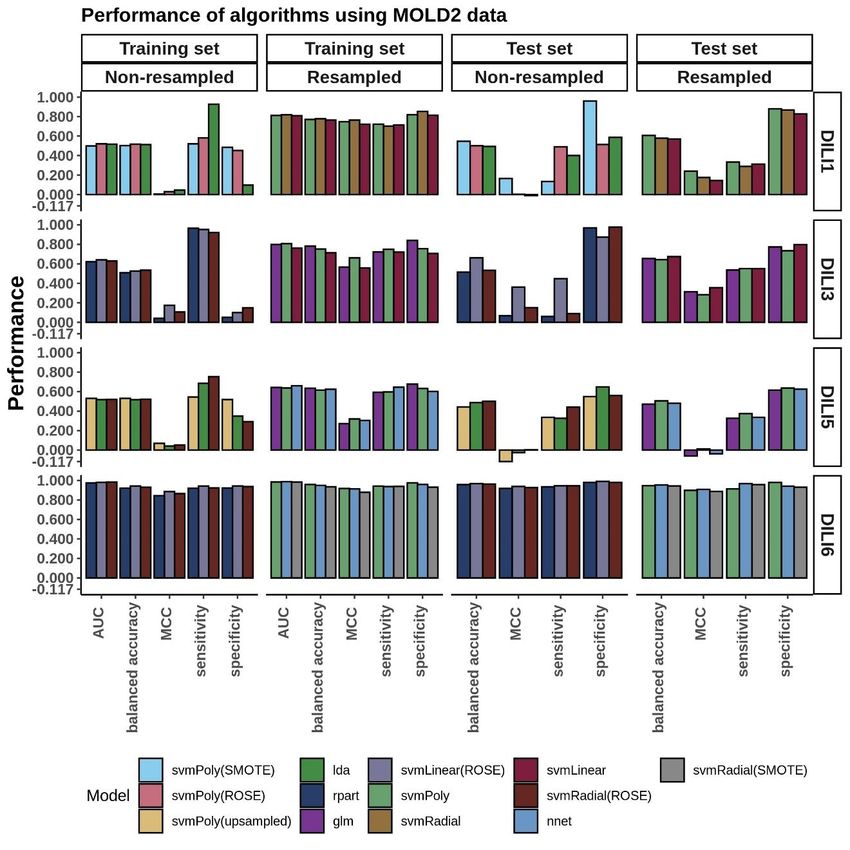
MOLD2 Modeling…………….............................................................................32
TOX21 Modeling………………..........................................................................34
Connectivity Map L1000 Cell Expression Modeling............................................36
viEnsemble Voting Models Performance.................................................................43
5. DISCUSSION…………………....................................................................................45
Future Work………………………..…………………………………………….48
REFERENCES……………………..................................................................................51
Appendix A……………………........................................................................................63
Manuscript Details……………………………………………………………….64
Acknowledgments………………………………………………………………..64
Contribution to the Field Statement………………………………….…………..64
Data Availability…………………………………………………………………65
Appendix B………………………....................................................................................66
LIST OF ABBREVIATIONS...........................................................................................67
viiLIST OF TABLES
Table Page
1. Previous CAMDA Drug Safety Challenge Summary.....................................................3
2. Drug-Induced Liver Injury Classifications......................................................................6
3. Training Data Imbalance.................................................................................................8
4. Training Performance on Independent Cell Line based Models...................................38
5. Testing Performance of Top Models.............................................................................41
viiiLIST OF FIGURES
Figure Page
1. Study Workflow……………………………………………………………………….20
2. Drug Testing Cell Distribution………………………………………………………. .21
3. FAERS Model Performance…………………………………………………………..31
4. MOLD2 Model Performance.........................................................................................33
5. TOX21 Model Performance..........................................................................................35
6. Cell Expression Model Performance….........................................................................40
7. Ensemble Voting Method Performance….....................................................................44
ixLIST OF EQUATIONS
Equation Page
1...............................................................................................................................…..27
2...............................................................................................................................…..27
3...............................................................................................................................…..27
4...............................................................................................................................…..27
5.................................................................................................................................…27
6.............................................................................................................................……27
7.............................................................................................................................……29
xACKNOWLEDGEMENTS
I wish to express my sincere appreciation to the members of my advisory Committee for
their guidance and support during my time in the master’s program at the University of
North Dakota. I would also like to thank my advisor, Dr. Junguk Hur, for his many
advice and invaluable mentorship.
xiDEDICATION To my family, for being my beacon of light and my motivation To Eniola Ajide and his family, for being my pillar of support and encouragement To my friends at home and abroad, Lanre, Wale, and Chinyere, and everyone who has supported me on this journey To Dr. Junguk Hur, for his mentorship, giving me opportunities to learn, and encouraging me to take bold steps To myself, for taking bold steps
ABSTRACT

A major challenge in drug development is safety and toxicity concerns due to drug side

effects. One such side effect, drug-induced liver injury (DILI), is considered a primary

factor in regulatory clearance. To develop prediction models of DILI, the Critical

Assessment of Massive Data Analysis (CAMDA) 2020 CMap Drug Safety Challenge

goal was established with an ultimate goal to develop prediction models based on gene

perturbation of six preselected cell-lines (CMap L1000), extended structural information

(MOLD2), toxicity data (TOX21), and FDA reporting of adverse events (FAERS). Four

types of DILI classes were targeted, including two clinically relevant scores and two

control classifications, designed by the CAMDA organizers. The L1000 gene expression

data had variable drug coverage across cell lines with only 247 out of 617 drugs in the

study measured in all six cell types. We addressed this coverage issue by using Kru-Bor

ranked merging to generate a singular drug expression signature across all six cell lines.

These merged signatures were then narrowed down to the top and bottom 100, 250, 500,

or 1,000 genes most perturbed by drug treatment. These signatures were subject to

feature selection using Fisher’s exact test to identify genes predictive of DILI status.

Models based solely on expression signatures had varying results for clinical DILI

subtypes with an accuracy ranging from 0.49 to 0.67 and Matthews Correlation

Coefficient (MCC) values ranging from -0.03 to 0.1. Models built using FAERS,

MOLD2, and TOX21 also had similar results in predicting clinical DILI scores with

                                             xiii
accuracy ranging from 0.56 to 0.67 with MCC scores ranging from 0.12 to 0.36. To
incorporate these various data types with expression-based models, we utilized soft, hard,
and weighted ensemble voting methods using the top three performing models for each
DILI classification. These voting models achieved a balanced accuracy up to 0.54 and
0.60 for the clinically relevant DILI subtypes. Overall, from our experiment, traditional
machine learning approaches may not be optimal as a classification method for the
current data.
xivCHAPTER 1
INTRODUCTION
Adverse drug reactions (ADRs) are a common concern of novel drugs and therapeutics.
One of the more common targets of ADRs is the liver due to its role in the metabolism of
compounds and resulting liver damage is termed as Drug-Induced Liver Injury (DILI) 1–3.
DILI is a unique challenge in drug development due to the inability of animal models to
translate to human clinical trials in treatment populations. Assessing DILI risk has been
approached in multiple ways during drug development; however, officials often rely on
post-marketing surveillance to detect possible long-term side effects such as DILI 4. The
U.S. Food and Drug Administration (FDA) has established the DILIrank dataset, the
largest reference drug list ranked for DILI risk in humans, to facilitate the development of
predictive models by enhancing drug label DILI annotation with weighted causal
evidence5. This dataset contains four classifications, including most, less, ambiguous, and
no-DILI concern, regarding 1,036 FDA-approved drugs. Additionally, predicting DILI is
difficult due to the absence of specific and reliable biomarkers. Traditional biomarkers,
including alanine aminotransferase, total bilirubin levels, aspartate aminotransferase, and
gamma-glutamyl transferase (among others) are not specific enough to separate DILI
from other forms of liver injury 6. Due to this reason, FDA in 2016 approved
investigations into glutamate dehydrogenase and microRNA-122 as potential
biomarkers7. Messner and colleagues characterized exosomal microRNA-122
1in methotrexate and acetaminophen-induced toxicity in hepatic stem cells, HepaRG. They
confirmed that microRNA-122 can be used as a sensitive biomarker for DILI 8.
Predictive markers of DILI, determined by compound properties and known variables
rather than preclinical studies, would facilitate drug development in a wide variety of
ways9,10. Multiple groups have attempted to predict DILI using drug compounds or
proposed drug properties. Chemical structures 11, gene expression response12, and patient
genetic data have been previously used for DILI prediction using traditional machine
learning algorithms. Xu et al. proposed a deep learning model built on a “combined data
set” gathered from a variety of sources and used a molecular structural encoding
approach for the chemical structures of the drugs in their data 13. Kohonen et al. proposed
a ’big data compacting and data fusion’ concept 14. In their approach, the authors utilized
data from the Connectivity Map (CMap; Broad Institute) database, the Open
Toxicogenomics Project-Genomics Assisted Toxicity Evaluation Systems (TG-GATEs;
National Institutes of Biomedical Innovation, Japan), the US National Cancer Institute 60
tumor cell line screening (NCI-60), and the US FDA Liver Toxicity Knowledge Base
(LTKB). Using these databases, they modeled a predictive toxicogenomics space that
captured all possible well-known hepato-pathological changes 14.
Building upon these previous efforts to accurately predict DILI, the Critical Assessment
of Massive Data Analysis (CAMDA) in collaboration with the Intelligent Systems for
Molecular Biology (ISMB) has proposed the CMap Drug Safety Challenge for their
annual conferences in 2018, 2019, and 2020 (Table 1). The previous challenges in 2018
and 2019, while sharing a similar goal to predict potential liver toxicity, also had distinct
parameters. The prediction DILI classification in 2018 was a binary positive or negative
2Table 1. Previous CAMDA Drug Safety Challenge Summary.
The CMap Drug Safety Challenge has been a repeated effort by CAMDA to develop
predictive models for DILI. Previous studies are cited by their year of publication and
leading author while also describing the the year in which the challenge was
administered by CAMDA and relevant data sources and DILI classifications for
prediction.
Authors CAMDA Data Sources DILI conditions
Drug Safety
Challenge
Current: 2020 CMap L1000, MOLD2, FAERS, DILI1, DILI3,
Adeluwa et TOX21 DILI5, DILI6
al.
2021: Liu et 2019 CMap L1000, SMILES strings, Most-DILI
al. SIDER 4.1, concern, Less-DILI
2021: 2019 CMap L1000, DisGeNET, concern,
Aguirre- GUILDify, SMILES, DGldb, Ambiguous DILI
Plans et al. HitPick, SEA concern, No-DILI
2021: 2019 CMap L1000, SMILES, annotated concern
Lesinski et Images
al.
2020: 2018 Affymetrix GeneChip (MCF7, DILI-1, DILI-0
Chierici et PC3)
al.
2020: 2018 Affymetrix GeneChip (MCF7,
Sumsion et PC3)
al.
3DILI status, while in 2019 the challenge was more focused on the potential DILI risk ranging from no concern to most concern with four classifications reflecting the DILIrank dataset5. The data, used for predicting the DILI classification of drugs in the 2018 challenge, were limited to microarray data from MCF7 and PC3 cell lines. Chierici et al. in 2018 employed deep learning techniques for the microarray data from 276 compounds but only achieved Matthews Correlation Coefficient (MCC) values of
utilized the widest array of predictive data, including L1000 CMap expression, drug-

target associations, structural data, phenotype-associated gene signatures, protein-protein

interactions, and drug targets data 19. Their models’ accuracy remained comparable to

other study results at 70%, but they also identified structural dissimilarities within the

DILI risk labels used. All three published studies from the 2019 CMap drug safety

challenge cited data limitations within their study, including complex dosage-related

toxicity, a small sample size, and a small number of compounds with hepatoxicity

annotation.

The current CAMDA 2020 challenge was structured in a way to address the previous

limitations, while also redefining the relevant DILI classifications. The challenge aimed

to predict or classify positive and negative classes within each of four DILI designations,

namely DILI1, DILI3, DILI5, and DILI6. DILI1 and DILI3 were clinical classifications

based on specific severity scores or established FDA warnings and precautions, while

DILI5 and DILI6 served as a negative and positive control class, respectively (Table 2).

Drug class labels were assigned by the CAMDA 2020 challenge organizers. DILI1 was

described as a severity score ≥ 6 which is associated with high risk based on the DILIrank

dataset and LTKB20. DILI3 was described as drugs withdrawn, given boxed warnings, or

warnings and precautions from the FDA due to either known risk factors or adverse event

reporting. DILI5 served as a randomly assigned negative control, while DILI6 was

constructed as a positive control based on molecular weight with positive compounds

weighing >320 g/mol. The drug list for the study was expanded to 617 drug compounds

to improve on the sample size limitations of previous studies; however, these datasets

remained highly imbalanced.
                                              5
Table 2. Drug-Induced Liver Injury Classifications.
Four binary classes of DILI were provided by the CAMDA organizers. DILI1 positive
compounds were based on the clinical severity score associated with liver necrosis.
DILI3 positive compounds were based on drug already associated with warnings and
precautions or that have been withdrawn due to liver toxicity. DILI5 was a random
assignment from the organizers as a negative control group while the DILI6
classification was based on molecular weight (>320 g/mol) to serve as a positive
control.
Targets Positive group Negative group
DILI1 DILI Severity score ≥6 (N=141) DILI Severity score 320 g/mol
6The imbalance within the clinically relevant DILI data is expected considering that many
approved drugs do not have a significant hepatoxicity risk; however, the control classes
of DILI5 and DILI6 were structured in a balanced manner (Table 3). For this challenge,
L1000 drug expression signatures from primary human hepatocytes (PHH), liver
carcinoma (HepG2), immortalized kidney cells (HA1E), human skin melanoma (A-375),
breast cancer (MCF7), and adenocarcinoma (PC-3) were used as inferred from landmark
genes defined by Connectivity Map 21. These expression responses were simplified to one
specific dose at one specific treatment time in order to yield the largest available dataset
for training and testing while also addressing previous dosage toxicity concerns. Other
non-gene expression data provided included molecular descriptors encoding two-
dimensional chemical structure information from MOLD2 22, post-marketing drug adverse
event information from FAERS23, and high-throughput liver toxicity screening results
from TOX2124. While previous studies also utilized external data sources to improve
model performance, the current study focuses on the various types of data processed and
provided from the CMap drug safety challenge.
We constructed models to predict each drug’s DILI class (positive or negative) within the
four DILI classifications (DILI1, DILI3, DILI5, and DILI6) by first evaluating the
performance of each dataset in predicting DILI and also by employing ensemble voting
with the top three performing models across data types. The gene expression data
presented a unique challenge in that not all drugs were tested in each cell line or even in
liver-relevant cell lines. To address this, we utilized a Kru-Bor merging method to merge
the expression signatures across cell lines into one representative drug signature 25,26.
7Table 3. Training Data Imbalance.
The data used for the clinical DILI classes of
DILI1 and DILI3 were imbalanced which
negatively influenced the models built to
predict these classes.
DILI Class Negative Positive
DILI1 326 96
DILI3 262 160
DILI5 218 204
DILI6 197 225
8These expression signatures were narrowed down to the top and bottom 100, 250, 500,
and 1,000 ranked genes and subjected to feature selection via a Fisher’s exact test based
on their involvement in DILI positive/negative assigned drugs for each DILI class.
FAERS, MOLD2, and TOX21 datasets were also used to construct DILI predictive
models, and to address the imbalance of these data we tested resampling techniques.
Various traditional classifier algorithms were used to build models on these datasets, and
the models were evaluated on a blinded test set by the CAMDA committee. Based on the
training area under the curve (AUC) values of these models, the top three algorithms for
each datatype (cell expression, FAERS, MOLD2, and TOX21) for each DILI class were
included in our ensemble voting model. We tested hard, soft, and weighted voting across
these datasets to see if the varying dimensions of data can improve predictive
performance.
9CHAPTER 2
LITERATURE REVIEW
The purpose of this section is to describe the pathophysiology of DILI and to review the
available literature on the status quo of DILI prediction.
Pathogenesis and Mechanisms of DILI
DILI occurs in the liver because the liver is an important site for the metabolism of
compounds. Metabolism aims to transform lipid-soluble compounds – which are
biologically active – into lipid-insoluble compounds that are easily excreted from the
body. Lipophilic drugs are bioactive because they can easily cross the membrane barriers
of cells. Usually, active drug compounds are metabolized into inactive forms at which
stage they do not interfere with biological processes in the body 27. In other cases,
metabolism converts inactive drugs (prodrug) into active metabolites that can interfere
with biological processes in the body27. It is also possible for an active metabolite to be
converted into many other active metabolites 27.
These conversions are mediated by chemical reactions that take place in the liver. For
nomenclature, these reactions are split into Phase I and II reactions but they don’t have to
take place in that order. Phase I reactions are mediated by the cytochrome P450 (CYP)
superfamily of enzymes27. These enzymes modify drugs into lipophobic drugs i.e. water-
soluble drugs. The reactions they catalyze include oxidation, reduction, hydroxylation,
10deamination, sulphoxidation, and various forms of dealkylation. Reactive metabolites that
are potentially – and directly – toxic to the cells are generated in this phase.
In phase II reactions, reduced or oxidized forms of drug compounds are conjugated
through various methods including acetylation by way of N-acetyltransferases (NATs),
glucuronide conjugation by way of UDP-glucuronosyltransferases (UGTs), methylation
through thiopurine S-methyltransferases (TPMTs) and/or catechol O-methyltransferases
(COMTs), addition of glutathione substrates through glutathione S-transferases (GSTs),
and sulfation by sulfotransferases (SULTs). These conjugation processes make it possible
for metabolites to be effluxed through transporters 27.
The amount of metabolites and reactive oxygen species (ROS) that the liver is exposed to
make it a potential site of damage. This is one proposed mechanism of the DILI
formation. These metabolites can interfere with the structure of proteins – and
consequently, their functions and localization – by covalent bonding [to these proteins] 28.
This direct mechanism of DILI formation can result in hepatocellular damage and death
through endoplasmic reticulum (ER) stress, mitochondrial dysfunction, and interference
with signaling pathways29. Intracellular calcium signaling and composition can be
interfered with resulting in lysis of the cells 30. While this direct mechanism of DILI
formation is easily understood, it is insufficient in explaining the involvement of the
immune system. Thus, the recruitment of other cells through the immune system is
proposed as another important mechanism of DILI formation.
The stress and damage caused by drugs can trigger inflammatory reactions of the innate
immune system, through the release of damage-associated molecular patterns (DAMPs)
11like adenosine triphosphate (ATP), heparin sulfate, DNA, heat-shock proteins, and high
mobility group box 1 protein (HMGB1)31. These DAMPs can lead to the production of
reactive oxygen/nitrogen species, neutrophil inflammation, and an increase in cytokines
and inflammatory chemokines through the activation of Toll-like receptors 32. Also,
DAMPs can be recognized by pattern recognition receptors (PRRs) that are present on
antigen-presenting cells (APCs), leading to the activation of the adaptive immune system.
A more popular hypothesis for DILI formation that involves the immune system is the
hapten hypothesis29,33. Here, it is proposed that DILI is caused by haptens which are small
molecules that become immunogenic when they are bonded with carrier molecules like
proteins9. The formed hapten-protein adducts activate the innate immune system, which
leads to the production of inflammatory chemokines and cytokines. Other inflammatory
mediators like Fas and IFN-gamma (interferon-gamma) can cause direct liver damage 34,35.
In turn, the innate immune system activates the cells of the adaptive immune system
through T cell responses. The manner through which these haptens are presented to T
cells is dependent on the HLA (human leukocyte antigens) haplotype of the individual, in
turn determining the immune response, further explaining a genetic basis for
idiosyncratic DILI34,35.
As the principal system for exporting bile salts outside the liver, the blockade of the bile
salt export pump (BSEP) has been hypothesized as another DILI mechanism. One study
found that a genetic loss-of-function deficiency of the BSEP system led to liver failure
and cholestasis36. By blocking the BSEP, there is an increased concentration of bile acids
within the liver, which can lead to hepatocellular stress, mitochondrial dysfunction, ER
12and organellar stress 37,38. Medications like troglitazone, sunitinib, bosentan, and
cyclosporine A have been implicated in inhibiting BSEPs and causing DILI 37,39–43.
Types of DILI
Classically, the pathogenesis of DILI has determined its classifications such that DILI is
divided into two types, namely intrinsic (or direct) DILI and idiosyncratic DILI 44. Some
drugs can cause direct liver toxicity when used at high doses beyond their therapeutic
indices. In this case, the DILI type is said to be intrinsic, and it is predictable and dose-
related44. In many cases, intrinsic DILI occurs after a short period of exposure to the
medication (at doses beyond the recommended dose). Acetaminophen (Tylenol) is a
commonly used non-steroidal anti-inflammatory drug (NSAID) for treating fever and
pain that is well-characterized for causing acute liver failure slightly beyond the
maximum recommended dose of 4g per day 45–47. The acute liver failure in these patients
was marked by elevated alanine aminotransferase (ALT) 48 and aspartate aminotransferase
(AST)46. Interestingly, acetaminophen is responsible for most cases of acute liver
failure48.
Nearly all presentations of DILI in the clinic are idiosyncratic (or unpredictable) DILI,
and patient-dependent. This type of DILI is defined by having no direct liver toxicity,
dose-independent (thus, occurring even at minimum/recommended doses), unpredictable,
severe (or fatal), and rarely-occurring 49–52. One of the commonest histological phenotypes
of idiosyncratic DILI is acute hepatitis 53, marked by increased alanine aminotransferase
concentrations. Responsible for close to 15% of acute liver failure due to idiosyncratic
DILI54,55, acute hepatitis is caused by medications such as diclofenac, nitrofurantoin,
13isoniazid, sulfonamides, and floroquinolones56,57. Another phenotypic representation of
DILI is cholestatic hepatitis defined by an impediment to the flow of bile from the liver.
Symptoms include pruritus, jaundice, dark urine, nausea, and rash 58. Serum biomarkers
alkaline phosphatase (ALP) and bilirubin are significantly increased 58,59, and medications
like chlorpromazine, amoxicillin-clavulanate, cefazolin, azathioprine, ciprofloxacin,
levofloxacin, cephalosporins, and terbinafine 60–65. In many cases, if these medications are
withdrawn quickly, cholestatic hepatitis usually resolves by itself 64. Besides acute
hepatitis and cholestatic hepatitis, other phenotypic representations of idiosyncratic DILI
are chronic hepatitis and mixed hepatitis.
Diagnosis of DILI
Taken together, acute and chronic hepatitis, cholestatic hepatitis, and acute and chronic
cholestasis are the most common phenotypic representations of DILI. However, these
histological patterns are not perfectly correlated with serum biomarkers and biochemical
presentations of DILI. This non-correlation, coupled with the inability to differentiate
DILI from liver disease not due to medications or supplements, makes the diagnosis of
DILI difficult. For instance, drug-induced acute hepatitis shares strikingly similar
symptoms with acute viral hepatitis, even with an increase in ALT concentration 66.
Symptoms of DILI are similar to those found in autoimmune hepatitis fatty liver disease
and hepatic necrosis66. Therefore, DILI is usually diagnosed based on the exclusion of
seemingly related liver diseases not due to the use of medications. Currently, there are no
specific biomarkers for DILI diagnosis, but measurement of these serum biomarkers
ALT, AST, ALP, and bilirubin are being used as diagnostic parameters 67. In addition to
14this is gamma-glutamyl transferase (GGT) 67. These markers, used alongside Hy’s law, are
a tool approved for the determination of a medication’s ability to cause DILI.
Hy’s law was proposed by Hy Zimmerman after certain clinical observations 68. He
proposed that there is a 10% to 50% chance of mortality in patients with evidence of
jaundice and hepatocellular damage 68–71. Over time, the FDA has expanded and compiled
these criteria such that a drug is determined to cause DILI if it meets the following
conditions:
1. 3-fold elevation of aminotransferases (ALT or AST) above the normal upper
limit
2. Alongside the previous criterion, a 2-fold increase in total bilirubin levels
above the normal upper limit, barring the non-diagnosis of cholestasis
3. If there is no other diagnosis explaining the hepatocellular damage, for
instance, acute viral hepatitis, congestive heart failure,
In addition to the above criteria, a separate expert panel 72 recommended the following:
1. A 5-fold elevation of aminotransferases (ALT or AST) above the normal
upper limit
2. A 2-fold elevation of ALP above the normal upper limit
3. Alongside the first criterion, a 2-fold increase in total bilirubin above the
normal upper limit.
15Regardless of these criteria and biomarkers, determining DILI is still difficult primarily
because separating drug-induced hepatocellular damage from non-drug-induced
hepatocellular damage is challenging. In addition, determining causality is confounded by
the use of multiple medications and insufficient information on the doses and usage of the
medication(s). A pertinent challenge is these traditional biomarkers are not liver-specific,
neither are they drug-specific, necessitating the need for more specific biomarkers 73. The
FDA has launched investigations into finding new and specific biomarkers including
glutamate dehydrogenase (GLDH) and miRNA-122 74. Other potential biomarkers are the
histological biomarker HMGB1, macrophage colony-stimulating factor receptor, and
keratin-1875.
To address the diagnostic challenge with DILI, researchers have turned to computational
approaches, in particular, machine learning 76–79. Given the exponential growth in next-
generation sequencing technologies, large biological datasets, faster computers, and more
efficient computational tools, data science-driven methods to understand patterns in DILI
progression are an invaluable approach to this problem.
Computational prediction of DILI has long relied on using molecular/chemical/structural
information of drugs. The hypothesis is that the structure of drugs harbor information that
determines how they are metabolized and that the resulting metabolites can point to DILI
development. Using 3D molecular descriptors as inputs to a linear discriminant analysis
and an artificial neural network algorithm, Cruz-Monteagudo and others build predictive
models on 74 drugs and achieved 82% accuracy on 13 drugs used as the test data 80.
Tropsha’s group developed a quantitative structure-activity relationship model using a k-
16nearest neighbor algorithm built on 200 molecular descriptors and tested on 37 drugs,
achieving as high as 73% accuracy on the test set 28. A challenge with these studies was
that the models were never tested on large external datasets. Liu and colleagues used the
chemical structure information of drugs in a CAMDA 2019 challenge to build predictive
models of DILI. Using a support vector machine and a random forest algorithm, they
achieved a mean balanced accuracy of 0.759 on an external test set 18. In the same study,
the authors used L1000 gene expression data for the drugs but noted that these datasets
were not predictive of DILI 18.
To improve the prediction of DILI, researchers have turned to using – and integrating –
diverse datasets including genetic data and toxicity information. Furlanello’s group used
gene expression information of two cancer cell lines treated with 276 drugs to build
binary classification models. They developed a random forest model, a single-layer
neural network model, and three deep learning models but obtained poor performance.
Lesinski et al., in a study published in 2021 integrated gene expression data and chemical
properties where their best model achieved an AUC of 0.73.
Another approach to developing classifiers for DILI is integrating available datasets,
especially when individual datasets are not predictive. Piccolo’s group attempted to
integrate the strength of different models by aggregating many models in an ensemble
approach, alongside alternative methods like class-weighting and dimensionality
reduction. Regardless, their approach failed to generalize properly to the test set 16. Voting
approaches, however, have the potential to improve the prediction metrics that they are
measured on81,82.
17Problem Statement
The current status of DILI prediction has room for improvement. In our approach, we had
access to gene expression data across six cell lines, molecular descriptors for the drugs,
toxicity information for the drugs, and patient-reported incidences of adverse drug
reactions for each drug. The aim of this study was to (i) evaluate the quality of these
individual datasets in predicting DILI, and (ii) to evaluate if integrating these dataset can
improve DILI prediction. To this end, we developed a voting method to aggregate the
strengths of models built in (i).
18CHAPTER 3
METHODOLOGY
Data Processing
The overall workflow of our study is shown in Figure 1. Initially, the overlap of drugs,
included in each of the gene expression cell data sets, was investigated using VennDetail
83
to create a Venn pie chart showing the various drug testing subsets across the six cell
lines (Figure 2). Each of the non-gene expression datasets (FAERS, MOLD2, and
TOX21) were treated as individual datasets, while the gene expression data were merged
across cell lines to build classifier models. In general, we used standard preprocessing
techniques, including removing zero variance features and missing values. DILI1 and
DILI3 suffered from class imbalance (Table 3). For all non-gene expression data, to
mitigate this issue, we attempted three oversampling techniques, including synthetic
minority oversampling technique (SMOTE) 84, random oversampling examples (ROSE)
85
, and a random upsampling of the minority classes. SMOTE balances data by randomly
creating artificial samples between two nearest-neighbor samples, while ROSE uses a
smoothed bootstrap technique to resampled the data 84,85. For comparison, models were
built using imbalanced data as well. Before training non-gene expression datasets, they
were standardized to have a mean of 0 and a standard deviation of 1. Preprocessing
details specific to each dataset as well as some characteristics of the data are discussed
below.
19Figure 1. Study Workflow.
Data were separated into expression-based datasets and non-expression-based (FAERS,
MOLD2, TOX21) for testing. Non-expression data was evaluated with resampling
methods ROSE and SMOTE as well as an unbalanced dataset. Expression-based datasets
were merged across cell lines into one representative expression signature per drug.
These signatures were tested as the top and bottom 100, 250, 500, and 1,000 ranked
genes for each drug. Following signature formation, feature selection using a fisher’s
exact test was used to determine significant predictors of DILI classification. Machine
learning was used on predictors for both expression-based and non-expression models,
which were evaluated based on training AUC curve values as well as testing
performance. The top three performing models for each DILI type were utilized in
ensemble voting models in an effort to incorporate both expression and non-expression
datasets.
.
20Figure 2. Drug Testing Cell Distribution.
The Venn-Pie diagram depicts the overlap of drugs tested between each of the six cell
lines used in this study. Each bar within the Venn-Pie represents an individual dataset
while the color of the bars indicates the overlapping group of compounds across datasets.
While 247 of the 617 drugs included in the training and test data were tested in all 6 cell
lines, some compounds were only tested in a singular cell line and others did not have
any expression information provided.
21Food and Drug Administration Adverse Event Reporting System (FAERS)
The CAMDA organizers provided us with FAERS data for all 617 drug compounds. Of
these, 422 were grouped as “training data”. This dataset contains 20 features
corresponding to information on the percentage of reported adverse events for each drug
compound by gender and age group demographic. After removing highly correlated
features, we upsampled the data to cater to the class imbalance by randomly sampling
with replacement from the minority class to balance the majority class. An additional
preprocessing step was to create two new variables, namely “male ratio” and “female
ratio”, taking into account all reported events irrespective of the gender, all reported DILI
events irrespective of gender, and the percentage of reported DILI events by gender.
Toxicology in the 21st Century (TOX21)
In addition to the FAERS dataset, we were provided with concentration-response
information of 600 drugs. Of these, 412 were designated as “training data”. Thirty-two
features corresponded to concentration-response curve ranks. Out of all 412 drugs for
training, 57 drugs were removed for missing values. In addition, we removed highly
correlated features using an arbitrary cutoff of 0.82 and catered to the class imbalance by
using SMOTE.
Molecular Descriptors from 2D Structures (MOLD2)
Alongside the FAERS and TOX21 data provided, we had access to the 2D molecular
descriptors or structural information of these 617 drug compounds. 422 of these drugs
were designated for training. There were 777 features for each drug compound with each
22feature corresponding to MOLD2 descriptors. To cater to class imbalance, we upsampled
minority classes, as well as ROSE, and SMOTE.
Connectivity Map L1000 Gene Expression Data
The L1000 assay data used in this study is a high-throughput gene expression assay that
measures mRNA transcript abundance of 978 landmark genes based on an inference
algorithm to infer the expression of 11,450 additional genes in the transcriptome 21.
Utilizing simulation, it has been observed that this reduced representation of the
transcriptome can recapitulate around 80% of the relationships of measuring the entire
transcriptome directly. In this study, 12,328 de-identified predictor genes were provided
by the CAMDA organizers with Z scores to indicate transcript abundance. The treatment
time and dosage of each drug were selected by the CAMDA committee to produce the
largest available dataset for both test and training data.
Kruskal-Borda Merging
Since not all drugs were tested in each cell line data made available, we utilized the
Kruskal-Borda (Kru-Bor) merging algorithm in the GeneExpressionSignature R package
86
. This approach allowed us to generate a unified drug-induced expression signature
across cell types since many drugs were not tested in the PHH or HepG2 liver cell lines.
The Kruskal algorithm 87 finds a minimum spanning forest of an undirected edge-
weighted graph while the Borda merging method 88,89 uses ranked options in order of
preference to determine the outcome. Thus each closest neighbor in rank merges one by
one until a unified signature is formed. Following merging, the top and bottom 100, 250,
500, and 1,000 ranked genes were selected as drug signatures for feature selection.
23Feature Selection
A method of feature selection utilized across the merged signatures produced via our
Kru-Bor merging was based on a gene’s significance (p-value < 0.01) in predicting the
DILI score via a Fisher’s exact test. If a gene is included in the top or bottom 100, 250,
500, or 1,000 ranked list, depending on the model data, for any drug it would be assigned
a 1 (True), or if it fell outside of that range it would be assigned a 0 (False). The classifier
for each type of DILI was also 1 (DILI positive) or 0 (DILI negative). We used these
classifiers to identify if these highly influenced genes were predictive of a drug being
DILI positive or DILI negative with a p-value cutoff of 0.01.
Machine Learning
The prediction of DILI was treated as a binary classification problem for each DILI type.
That is, for each of DILI1, DILI3, DILI5, and DILI6, outcomes were split between
‘positive’ and ‘negative’. We used a 5-folds cross validation repeated 100 times, and a
random search strategy to search for the best parameters for each model. The data was
made available such that training and test sets had been pre-identified. Importantly, we
did not have access to the correct labels for the test data. Models were built using
90
traditional machine learning algorithms within the caret package in R version 4.0.0 91.
The machine learning algorithms we used are suitable for classification tasks. They
include a Logistic Regression (LR) 92, Linear Discriminant Analysis (LDA) 93, Decision
Trees (DT) 94, Support Vector Machines (SVM) 95, Naïve Bayes (NB) 96, a One-layer
Neural Network (Nnet), and a Random Forest (RF) algorithm. LR and LDA are generally
categorized as linear classification models, with an assumption that the data follows a
24normal distribution. Given a set of predictors, LR aims to build a linear model of these
predictors by minimizing the sum of squared residuals. LDA uses the prior probability of
belonging to a class to estimate posterior probabilities by using Bayes’ Theorem. DT and
RF are often classified as trees and rules-based algorithms. Given a set of predictors, a
decision tree works by using if-else conditions to build a definitive set of rules using
splits. The challenge usually lies in determining optimal situations to apply a “then”-
clause (or a split). In RF, similar conditional statements are used. However, instead of
using the entire sample of data for tree-building, RF uses many independent subsamples
from the training data to build small decision trees. Each small decision tree classifies an
observation by voting. Neural networks and SVMs are generally grouped as non-linear
algorithms. Neural networks (in our case, a multilayer perceptron i.e. a neural network
with one hidden layer), are modeled after how neurons in the human brain work. The
outcome or prediction is a linear combination of the hidden layer(s) transformed by a
non-linear activation function. There are several activation functions used, depending on
whether the problem is a regression or classification problem. In our case, we used a
sigmoidal or logistic function, since we were dealing with a classification problem. SVM
aims to find support vectors or data points that separate the different classes as much as
possible. Intuitively, these data points are the most difficult to separate (the reasoning is
that they lie very close to one another and to the hyperplane or decision boundary), and
are thought of to be important in separating classes. There are different flavors of SVMs
depending on the kernel used (kernels are similar to non-linear activation functions used
in neural networks). In the current study, we used polynomial, linear, and a radial basis
function kernels.
25Model Evaluation
To evaluate the performance of our models, we focused on the area under the ROC
(Receiver Operating Characteristic) curve (AUC) (Equation 6) value as well as the
specificity (Equation 2), sensitivity (Equation 1), accuracy (Equation 3), and MCC
(Equation 5) of the models on the test set. ROC illustrates the diagnostic ability of a
binary classifier as its discrimination threshold is varied. It plots two characteristics, true
positive rate (TPR) against the false positive rate (FPR), at various thresholds. Therefore,
the AUC value is a measurement of the probability that a classifier ranks a randomly
chosen positive instance higher than a randomly chosen negative one, and it is a widely-
used metric in binary classification problems. An AUC value of 1 indicates a perfect
classifier, i.e. a model that is perfectly able to separate both classes, while an AUC value
of 0.5 indicates a model that predicts at random. Depending on the application domain,
AUC values of 0.7 and above are usually acceptable. Specificity measures the ratio of
negative classes that were correctly identified by the model out of all negative classes,
while sensitivity measures the ratio of positive classes that were correctly identified by
the model out of all positive classes. These metrics are affected by how the target labels
are structured and passed to the algorithm, and they range from 0 to 1. Additionally, we
evaluated the performance of our models on the test set by calculating the balanced
accuracy (Equation 4) of prediction. Balanced accuracy is the average of the sensitivity
and specificity or the average of the fraction of correct labels that are predicted correctly
(by the model) within each class. We used this metric because we observed that there was
class imbalance within our datasets regardless of DILI type.
26The MCC is particularly useful in datasets of different class distributions (or imbalanced
data) because it considers all of the false and true positives and negatives. It is calculated
from the confusion matrix of a model and its values range from +1 to -1, with +1
indicating a perfect classification, 0 indicating random classifications, and -1 indicating
no relationships between the observed and predicted classes.
Equation 1
TP
Sensitivity /TPR=
TP+ FN
Equation 2
TN
Specificity/ TNR=
TN + FP
Equation 3
TP+TN TP+TN
Accuracy ( ACC )= =
P+ N TP+ FN +TN + FP
Equation 4
TPR +TNR
Balanced accuracy=
2
Equation 5
TPxTN −FPxFN
Matthews Correlation Coefficient ( MCC )=
√( TP+ FP ) (TP +FN ) (TN + FP ) (TN + FN )
Equation 6
1
AUC ( Area under the curve ) = ∫ TPR ( FPR−1 ( x ) ) dx ,
x=0
27Where TPR and TNR are the true positive rate and true negative rate respectively, TP,
FP, TN, and FN are the number of true positive, false positive, true negative, and false
negative, respectively while P and N are the number of positive cases and that of negative
cases in the data, respectively.
Ensemble Voting Machine Learning
In an attempt to improve the classification accuracy of our models, we used three
ensemble voting approaches, namely soft voting, hard voting, and a weighted voting
approach. These ensemble methods work best when there are varying algorithms of
different strengths i.e. algorithms having varying underlying assumptions about the data,
81,82
and when each one has reasonable predictive power . Using the gene expression data
16
provided by CAMDA 2018 organizers, Sumsion and colleagues used hard and soft
voting ensemble methods in an attempt to improve prediction accuracy on DILI risk. As
an extension of their work, we hypothesized that since we have access to larger and more
diverse datasets, we could capture different aspects of predicting DILI types and use
these ensemble methods to improve prediction.
Hard voting, also known as majority voting, takes into account the predicted class labels
of each classifier (or voter) 97. Voting is done by counting how many class labels (for
each class) were predicted among all classes. The class label with the highest count is
taken to be the predicted class label for that observation. On the other hand, soft voting
considers the probabilities of each class label by each classifier 98. In other words, it
considers how certain each classifier is about the class labels. For each class label, the
28probabilities are averaged, and the label with the highest average probability is taken as
the predicted class label for the observation.
The third approach to voting involves using a weight to skew predictions towards the
most certain models (Equation 7). In our approach, we used the AUC of each classifier as
a weighting parameter for the output probabilities. This was done to take into account
that some classifiers might have better predictive power and should be given preference
in determining the outcome of the voting. To weigh each probability, we multiplied the
probabilities of each predicted class by the AUC and divided this by 1 subtracted from
the weight, that is, the AUC of that model. Afterward, weighted probabilities were treated
just as in soft voting: by taking the average of all resulting weighted probabilities
belonging to each class. The class label with the higher average was taken as the
predicted class for that observation. Therefore, the predicted class, ŷ, of observation,
given an output set of class membership probabilities across many models, P, is given
by:
Equation 7
m c
1 w i∗ pi
C ( ŷ|P )=argmax c ∑
(
m i=1 wi−1 )
i.e. a class with the highest weighted average membership of the models, where m is the
c
total number of models, i.e., |P|=m, w iis the weighting parameter for a model i, and pi is
the probability of class membership of model i to a class c.
29CHAPTER 4
RESULTS
FAERS Modeling
The performance of FAERS data in predicting each of the DILI types can be seen in the
bar plots in Figure 3. While we built many models, we compared and picked the best
three models based on the AUC values to predict DILI class on the test set. We noticed
that using the raw data (without resampling), models achieved classification accuracy
between 0.51 and 0.55 and MCC between 0.04 and 0.14 on the training set and did not do
noticeably better on the test set (accuracy: 0.49 to 0.59, MCC: -0.03 to 0.22). On the
other hand, using resampled datasets improved the accuracy of the models on the training
set to a range of 0.61 to 0.94 (MCC: 0.47 to 0.89). Using these models to predict the DILI
class of the test set showed a slight improvement in the accuracy (0.52 to 0.62). The
MCC, however, was between 0.04 and 0.24.
30You can also read


