Understanding gender differences in professional European football through machine learning interpretability and match actions data
←
→
Page content transcription
If your browser does not render page correctly, please read the page content below
www.nature.com/scientificreports
OPEN Understanding gender differences
in professional European football
through machine learning
interpretability and match actions
data
Marc Garnica‑Caparrós* & Daniel Memmert
After the great success of the Women’s World Cup in 2019, several platforms have started identifying
the reasons for gender inequality in European football. Even though these inequalities emerge
from a variety of key aspects in the modern sport, we focused on the game and evaluated the main
differential features of European male and female football players in match actions data under
the assumption of finding significant differences and established patterns between genders. A
methodology for unbiased feature extraction and objective analysis is presented based on data
integration and machine learning explainability algorithms. Female (n0 = 1511) and male (n1 = 2703)
data points were collected from event data and categorized by game period and player position.
We set up a supervised classification pipeline to predict the gender of each player by looking at their
actions in the game. The comparison methodology did not include any qualitative enrichment or
subjective analysis to prevent biased data enhancement or gender-related processing. The pipeline
included three representative binary classification models; A logic-based Decision Trees, a probabilistic
Logistic Regression and a multilevel perceptron Neural Network. Each model tried to draw the
differences between male and female data points, and we extracted the results using machine
learning explainability methods to understand the underlying mechanics of the models implemented.
The study was able to determine pivotal factors that differentiate each gender performance as well
as disseminate unique patterns by gender involving more than one indicator. Data enhancement and
critical variables analysis are essential next steps to support this framework and serve as a baseline for
further studies and training developments.
Data modelling and analysis have become a powerful and differential tool in modern European football. Many
professional teams currently rely on the use of data, technology and statistics to support their operations. The
optimised results and conclusions from these innovative methods help professional clubs in scouting, manage-
ment and performance. Professional players are now evaluated and compared using a comprehensive list of per-
formance indicators to determine their value and contribution to the t eam1–3. These indicators have also shown
the ability to determine the style of play of specific teams4 and numerous applications for sports f orecasting5.
Despite the undoubtedly increasing data-based culture in football, there are still certain factors in this sport that
are based on subjective and biased criteria. Unfortunately, there is still a prevalent fan and media-based opinion
that male performances are systematically better than female performances in a collaborative sport such as foot-
ball and hence, more attractive. After the great success in FIFA Women’s World Cup in 2019, gender inequality
in football has been a highly addressed and traversal topic. Even though these inequalities emerge from various
key aspects in modern sports, in the present study, we aim to evaluate the game and apply state-of-the-art sports
analysis methods to determine the differences between male and female European football.
The scientific community has led the proliferation of football analytics metrics and methods during the last
decades. Tracking technologies based on sensor devices and video analysis tools stream high-frequency data
covering all aspects of the g ame6. The amount of data every football game generates at the team and player level
Institute of Training and Computer Science in Sport, German Sport University Cologne, Am Sportpark Müngersdorf
6, 50933 Cologne, Germany. *email: m.garnica@dshs-koeln.de
Scientific Reports | (2021) 11:10805 | https://doi.org/10.1038/s41598-021-90264-w 1
Vol.:(0123456789)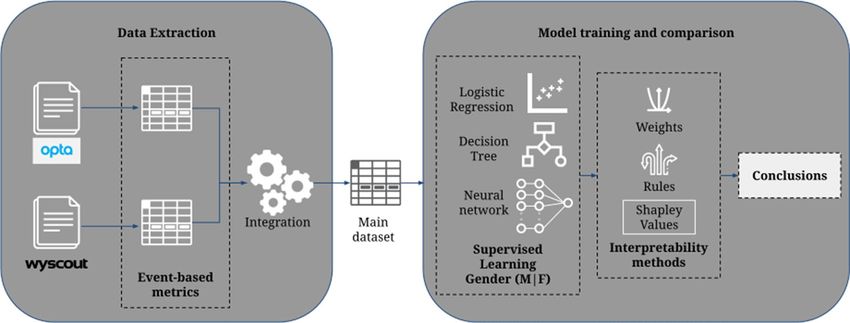
www.nature.com/scientificreports/
is growing exponentially. The detailed collection of every single action occurring in a match is often called event
data or also referred to in the European football community as soccer-logs7. Event data allows for an extensive
and flexible description of team and players performance and sequential pattern a nalysis8. Beyond mathemati-
cal and statistical models, machine learning models have also been presented in recent years leveraging football
event data9,10.
Studying differences between male and female athletes in sports environments is a primarily addressed topic
in sports medicine under different perspectives such as participation, motivation, or biomechanics studies. In
European football, broadcast recording analysis reported significant differences between player movement pat-
terns by g ender11. Other studies showed similar results under the limitation of observation p rotocols12. Video
analysis and collection of ball actions data identified female’s performance as less aggressive, with less contact
and longer passes. Other studies investigated female’s physical performances compared to male players from two
perspectives: physical load and playing distance to the ball. Female players were found to report smaller high
speed thresholds and distance coverage than male players13. Similarly, female movement patterns showed less
prune to create spaces, hence, good penetrations into the opponent’s a rea14. A recent study confirmed previous
findings analyzing the first division in Spain post match s tatistics15. Female players performed less passes with
less accuracy and female performances were less controlled with a higher number of divided balls.
While previous literature presented physiological and technical initial findings differentiating female and male
performances, we aim to contribute to this research by providing an analysis at the finest granularity possible,
match events, and complement the comparative numerical analysis with intervariable relationships and pattern
discovery. Profiling female and male performances using more than one variable for comparison could identify
player styles and situations unique by gender.It is expected that using machine learning models to understand
the main difference between male and female players’ performance would provide a layer of objectiveness and
deeper analysis of the numerical features. In the present study, we propose a comparison framework where only
raw numerical data from the data sources is used, and no other derived metrics or qualitative enhancement are
included to avoid subjectivity or gender-biased data processing. Although we expect differences between male
and female performances in the frequency of actions and dynamism, this study aims to understand the differences
from a playing style perspective and identify unique characteristics developed specifically in each gender practice.
Machine learning techniques have demonstrated the capacity to discover underlying patterns in high dimen-
sional data. These novel computational techniques are becoming the alternative to statistical methods computing
quantitative measurements of confidence and correlation. Classification or supervised learning algorithms are an
efficient tool nowadays to study and disseminate data populations into groups. Supervised learning algorithms
rely on already known labels or classes to be able to predict unlabeled data. The resulting classifiers concisely
draw boundaries and induce logic from the feature space to disseminate the data into labels. Explainability and
interpretability are two factors of machine learning that drive the focus not only on the results but also on the
data’s inherent patterns and the ability of the algorithms to explain them. To achieve the presented goal of this
study, we explore how novel machine learning techniques can provide unbiased results identifying gender dif-
ference and extract underlying knowledge from the algorithms behaviours. The presented methodology uses
multiple supervised classification algorithms to predict the player’s gender from the game’s actions. We evaluated
each model to ensure a fitted classification, and we made use of explainability m ethods16 to induce significant
differences identified by the models. In detail, we trained three representative binary classification models; A
logic-based algorithm Decision Trees17, a probabilistic Logistic Regression model18, and a multi-level perceptron
Neural Network19.
We considered for this study the two biggest stages of national competition in football in Europe. Event data
sources from the 2016 UEFA Men’s European Football Championship and the 2017 UEFA Women’s Champion-
ship were obtained and processed. Key metrics by player position and gender were extracted from match event
data, integrated and validated as a single dataset. We investigated the differences of female and male performances
in European football to provide a purely data-driven comparison on top of any subjective dissemination. The
outcome of this study should be used to enhance training programs as well as accelerate the contribution of the
football analysis community in female European football. Moreover, the present methodology would enable
further research on disseminating different playing styles between genders, ages, and countries of provenance
and boost custom training plans and tactical supervision for male and female athletes.
Methods
All research was performed under the relevant guidelines and regulations, and the study protocol and meth-
odology was approved by the German Sport University of Cologne. The 2016 UEFA Men’s European Football
Championship and the 2017 UEFA Women’s Championship match event data indicators were obtained through
external sources. The 2016 UEFA Men’s European Football Championship is publicly available for research and
analysis purposes7 and has been used in other contributions to present new data-driven performance metrics10.
The 2017 UEFA Women’s Championship was provided by Opta S ports20 and shared by the Leuphana University
of Lünenburg. Labelling each player by gender did not rely upon each player individual information but by data
source provenance; all data points from the 2016 Men’s Championship were classified as male, and data points
from the 2017 Women’s Championship were classified as female. In doing so, the attribution of male and female
is done exclusively through the affiliation to the respective teams. No personal data was considered for this study.
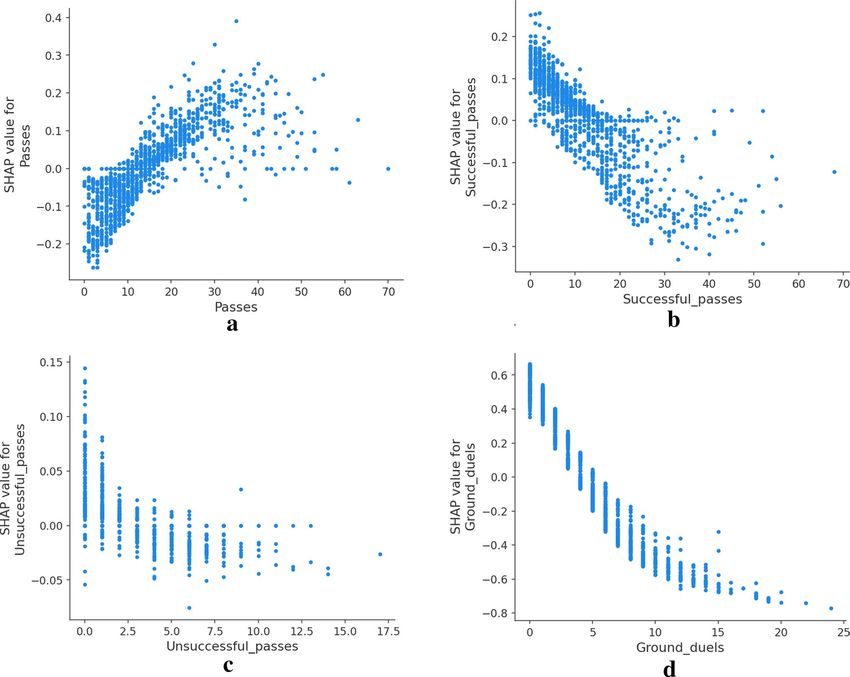
The methodology of this study is presented in Fig. 1. We first extracted the technical indicators from the event
data logs provided by the two data sources. We integrated each derived dataset into a single semantic domain
and homogenised technical events names and players’ positions to build the preliminary gender labeled dataset.
The integrated dataset was validated and fitted into the supervised learning models for training to identify the
gender of each data point. Then, as a final step, we interpreted each classifier to understand how the gender classes
Scientific Reports | (2021) 11:10805 | https://doi.org/10.1038/s41598-021-90264-w 2
Vol:.(1234567890)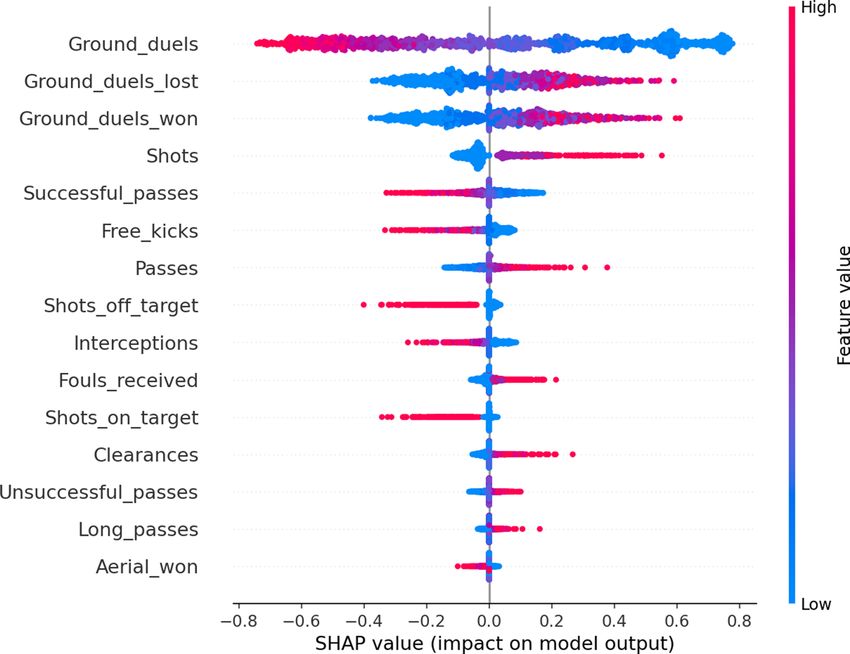
www.nature.com/scientificreports/
Figure 1. Complete methodology. We obtained event-based metrics from the two different data sources
and integrated them into a single dataset. We implemented three supervised learning models and analyzed
interpretability methods to understand the models.
Data source Gender Format #Games #Events
2016 UEFA Men’s Europe Championship Male JSON 51 74,751
2017 UEFA Women’s Europe Championship Female XML 31 47,976
Table 1. Data sources’ specifications. Gender of the games included, data provider, the data format of the files,
number of games, and number of events included.
disseminate data points and how the models identify these patterns. Interpretation techniques and results format
varied depending on the classifier.
Data sources. Table 1 summarizes the technical aspects of the data sources. Each data source represents all
the events occurring during every match of the competition. Both sources were integrated into a schema consist-
ing of the two competitions, and each event was defined by match and event identifier, event type and sub-type if
applicable, timestamp, the player involved in the event, and the success of the event specified by accurate or not.
The inference of each data source data model was performed using Apache S park21 functionalities.
Feature extraction and validation. Event data collection involves a complex process of computer
machinery and human a nnotation6,7. The resulting sequence of actions contains a detailed play-by-play descrip-
tion of the football game. Generally, each event includes its category, moment in the game, spatial informa-
tion on where it occurred, if possible, and the players involved. 122727 events from the 82 matches of the two
competitions were processed to compute a final list of performance indicators considering previous research on
technical indicators related to match p erformance22–24. The final feature space consists of count-based metrics
extracted directly from the match actions and the contextual features categorising each data point by game, game
section, player, and playing position. The playing position was directly extracted from the data sources.
Event data at this granularity is often scarce in sports analytics research. In addition, the availability of these
two data sets at the same edition and competition level in European football provides the study with a robust
database for comparison. However, the integration of two different data providers presented challenging issues
to homogenise concepts and data validation. As explained in the previous section, male players’ performance
indicators were extracted from Wyscout data collection files, while female performance was extracted from Opta
Sports. Several validation steps were included to avoid a systematic difference of male and female indicators by
the data provider.
The two data providers presented different data formats and, more importantly, different data representation
models. Female matches by Opta Sports were presented in different files per match with an additional file with
the players’ information, including the playing position in the field. Each file contained a game object with a list
of all the events. While the event type, time, player involved, and outcome were direct attributes of each event, the
data syntaxis relied on the concept of event qualifiers to express the majority of event subtypes such as crosses,
long passes, pass direction data, free kicks, corners, saves, headed clearances, shot categories, goals categories or
cards. In contrast, male matches by Wyscout were presented in two single files containing all matches and players
information, respectively. The full competition list of events contained the match, period, event type and player
of every event. In this case, the accurate or inaccurate outcome of the events and certain categorisation such as
long or diagonal passes were represented by event tags.
Scientific Reports | (2021) 11:10805 | https://doi.org/10.1038/s41598-021-90264-w 3
Vol.:(0123456789)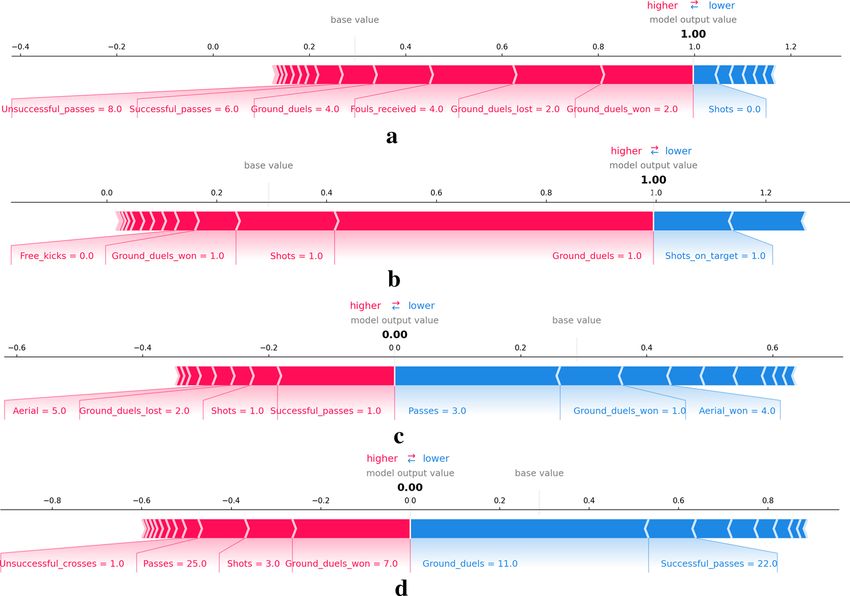
www.nature.com/scientificreports/
Variable Female Male
Passes 13.7 ± 9.7 16.2 ± 11.2
Successful passes 9.9 ± 8.5 13.7 ± 10.4
Unsuccessful passes 3.9 ± 2.7 2.5 ± 2.0
Crosses 0.4 ± 0.8 0.7 ± 1.1
Successful crosses 0.1 ± 0.3 0.2 ± 0.5
Unsuccessful crosses 0.4 ± 0.7 0.5 ± 0.9
Long passes 2.2 ± 2.4 1.1 ± 1.5
Long passes won 0.9 ± 1.3 0.6 ± 1.1
Long passes lost 1.3 ± 1.6 0.5 ± 0.8
Aerial 1.2 ± 1.6 1.7 ± 2.1
Aerial won 0.6 ± 1.0 1.0 ± 1.4
Aerial lost 0.6 ± 1.0 0.8 ± 1.1
Ground duels 2.5 ± 2.3 6.1 ± 4.3
Ground duels won 1.3 ± 1.4 2.3 ± 2.2
Ground duels lost 1.2 ± 1.3 2.2 ± 2.0
Free kicks 0.5 ± 0.9 1.8 ± 2.5
Fouls received 0.9 ± 1.1 0.5 ± 0.8
Corners 0.2 ± 0.7 0.2 ± 0.7
Corners successful 0.1 ± 0.4 0.1 ± 0.5
Corners unsuccessful 0.1 ± 0.5 0.1 ± 0.3
Saves 0.2 ± 0.6 0.1 ± 0.6
Clearances 1.2 ± 1.7 0.6 ± 1.1
Interceptions 0.5 ± 0.9 1.7 ± 1.8
Shots 0.5 ± 0.8 0.4 ± 0.8
Shots on target 0.2 ± 0.4 0.1 ± 0.4
Shots off target 0.2 ± 0.5 0.3 ± 0.6
Goals 0.0 ± 0.2 0.0 ± 0.2
Goals from penalty 0.0 ± 0.1 0.0 ± 0.1
Yellow card 0.1 ± 0.2 0.1 ± 0.3
Red card 0.0 ± 0.1 0.0 ± 0.1
Table 2. Mean value and standard deviation of each variable in the dataset per gender. Table values contain
the mean number of specific actions performed by a player during a single game section by gender.
To ensure the definitions and concepts used in both datasets were homogeneous, we validated the coherence
of each final variable within both data providers glossaries25,26. The selected indicators have a clear and standard
definition from both data providers. However, several event categories and types were discarded due to a lack of
coherence in the descriptions. Categorising match action by open and set play, pressing situations, and tackles
were discarded due to the high level of human criterion they require. Similarly, possession turning events such
as turnovers and ball recoveries were also eliminated because of the divergence in definitions and overlapping
with other specific attributes such as over-runs or missed touches. In addition, three games from the Wyscout
data source were manually validated through the publicly available data in WhoScored27, an online reference
portal for football metrics with Opta Sports as the main data provider.
Descriptive statistics. The resulting dataset of length n = 4214 contains 33 variables. The gender attribute
is expressed as 1 for male players and 0 for female players. There are 2703 male and 1511 female instances. Match
period is expressed as 1H for the first half, 2H for the second half, and E1, E2, and P for the two possible over-
times and the penalties respectively. Player position in the team formation has the following options: Defender,
Midfielder, Forward, Goalkeeper, Substitute Defender, Substitute Midfielder, Substitute Forward and Substitute
Goalkeeper. The remaining 30 variables consist of count-based statistics of each player performance during a
game section. Table 2 shows the mean value and standard deviation per gender of each of the 30 numerical
features of the dataset. As an initial exploratory step, male observations show a higher number of events with
higher variance, denoting a higher disparity in male players styles and levels. Male players perform more and
better passing in short and long distances, and they participate in more duels. On the other side, female players’
observations show higher values for fouls.
Supervised learning models. We included a representative subset of the main-stream models used in
current literature for binary classification using numerical and categorical features and models with interpret-
able results. Logistic Regression models provide an extension of the linear regression model for classification
problems and have been widely used in sports science. In addition, they offer probabilistic reasoning if correctly
Scientific Reports | (2021) 11:10805 | https://doi.org/10.1038/s41598-021-90264-w 4
Vol:.(1234567890)www.nature.com/scientificreports/
interpreted. To represent straight interpretable models, we added Decision Trees to the comparison. Decision
trees capture the interaction between data features and provide natural dissemination of classes. Finally, due to
the increasing availability and usability of machine learning libraries, Neural Networks are highly adopted by
different applied research areas. However, Neural Networks are characterized by their uncertainty of behaviour,
although performing at high accuracy levels due to their computing power. Thus, the inclusion of Neural Net-
works in this study aims to explore and showcase the explainability features of these high-performance comput-
ing algorithms. Furthermore, the results and interpretations could benefit from the overlapping of numerical
reasoning and visual rules that the three algorithms provide.
Models were optimized using the Scikit-Learn machine learning library28 and PyCaret bundle29. Models
performance was evaluated with Accuracy and AUC (Area under the Curve)30 metrics. AUC ranges between 0
and 1. A model whose predictions are 100% correct has an AUC of 1.0. Models optimization and training were
performed in 70% of the total dataset while maintaining a 30% of the data set for evaluation. A randomized grid
search31 was performed with a 10-fold stratified cross validation in the training dataset for model hyperparam-
eters optimization. The same cross-validation design was used for each of the models training. The following
sections describe each model’s algorithms and training and the selected techniques for explainability.
Logistic regression. We trained a Logistic Regression model using an L-BFGS solver with L2 penalty regulariza-
tion and C=3.208, low tolerance at 0.0001, and 100 iterations. The model uses a logistic function to distill a linear
equation’s output between two possible outcomes, 0 and 1. Therefore, feature weights cannot be interpreted as
linear regressions because they do not influence the probability linearly. A strategy to analyze logistic regression
feature weights relies on understanding the logistic regression model as a linear model for the log odds (prob-
ability of predicting class 1 divided by the probability of predicting class 0)32. A single change in the feature xi by
one unit increases the log odds ratio by the feature’s corresponding weight, βi . In other words, we can compute
the prediction odds ratio for every feature by computing the corresponding weight exponent. The odds ratio
indicates the effect of each feature in the estimated odds of the prediction.
Decision trees. The main advantage of Decision Trees against regression models for classification is to explore
nonlinear relations between the label and the features and interactions between features. We designed the tree to
split on each node by information gain and a minimum of 40 samples per node to retrieve meaningful sample of
classified populations. We evaluated two interpretation methods for decision trees: Feature importance, measur-
ing the impact of each feature on all the splits used, and the tree decomposition, visually assessing each path of
the tree and the features involved. We used the dtreeviz33 python library to decompose and visualise the decision
tree model. The overall feature importance in a decision tree can be computed in the following way: We measure
the information gain on each split where the model uses the feature and aggregate the overall information gain
of the tree-based model. All individual features are finally scaled to 100. The decomposition of a decision tree
consists of starting from the root node, visit each of the next nodes while aggregating the rules extracted from
each edge. The leaf nodes are the final prediction for the roles fulfilling every rule of the path.
Neural networks. Although deep learning has been very successful in optimization problems, it lacks openness
and methods to understand how a classifier learns and make predictions. A single prediction potentially involves
hundreds of operations. Therefore, current research is moving towards interpreting deep learning algorithms
through model-agnostic interpretation methods. These methods do not depend on specific model classes and
are applied after the model is trained. They usually analyze each feature’s impact on the output independently
of the model’s structure. We implemented a basic neural network with 1 hidden layer, constant learning rate
α = 0.0001, β1 = 0.9 and β2 = 0.999. We used the trained neural network to compute SHAP34 (SHapley Addi-
tive exPlanations) based on Shapley Values35. Shapley Values’s basic idea is to map the model’s prediction as a
payout and the features as the game players. Shapley values then tell us how to distribute the payout among the
features equitably. Computing Shapley Values requires a lot of computing power and time. That is why, in most
real-world cases, only the estimated Shapley Value is feasible. SHAP estimates the contribution of each feature
value to the prediction. We used a KernelSHAP explainer with 120 weighted k-medians of the original data set
for the randomly sampled test predictions.
Results
Models’ classification accuracy remained high through the three models implemented. In the following sections,
we present each model evaluation and the main results extracted from the explainability methods implemented.
Logistic regression. The Logistic Regression model yielded 95% of predicting accuracy and 0.99 AUC. The
prediction odds have been defined as the probability of predicting class male (gender = 1) divided the probability
of predicting class female (gender = 0). For instance, having an estimated odds of 4 means that the probability of
the predicted label being male is four times as high as predicting females. Table 3 shows the top 10 features with
their corresponding weights and odds ratio, ordered by odds ratio value. The odds ratio is the actual impact of
each feature changes in the estimated odds. For instance, an increase in the number of ground duels increases the
odds of male vs. female by a factor of 30.01. Table 3 shows that the most relevant features predicting class male
more likely than class female prediction involve ground duels, shots, interceptions, and crosses.
In Table 4, we showcase the top 10 features with the estimated weights ordered by the absolute value of the
weight. In this case, negative weights produce odds ratios lower than 1, indicating that the feature makes the
prediction odds smaller. We can extract more distilled knowledge from the logistic regression models: Although
ground duels increase the odds by a factor of 30, the volume of lost ground duels decreases the odds of male vs.
Scientific Reports | (2021) 11:10805 | https://doi.org/10.1038/s41598-021-90264-w 5
Vol.:(0123456789)www.nature.com/scientificreports/
Feature Weight Odds ratio
Ground duels 3.401654 30.013688
Shots off target 1.883792 6.578403
Shots on target 1.333649 3.794864
Interceptions 1.240091 3.455927
Successful crosses 1.142880 3.135788
Crosses 1.127932 3.089260
Free kicks 0.717951 2.050228
Goals 0.661713 1.938110
Aerial won 0.348462 1.416887
Successful passes 0.269733 1.309615
Table 3. Logistic regression model top 10 features estimated weights and odds ratio ordered by odds ratio
value. A single change in a feature by one unit increases the estimated odds (probability of predicting class
male over the probability of predicting class 0) by a factor of its corresponding odds ratio.
Feature Weight Odds ratio
Ground duels 3.401654 30.013688
Ground duels lost − 2.935787 0.053089
Unsuccessful crosses − 2.722266 0.065726
Clearances − 2.267617 0.103559
Shots off target 1.883792 6.578403
Shots − 1.663560 0.189463
Fouls received − 1.565999 0.208879
Shots on target 1.333649 3.794864
Interceptions 1.240091 3.455927
Crosses 1.183030 3.264250
Table 4. Logistic regression model top 10 features estimated weights and odds ratio ordered by the absolute
weight value. Negative weights produce odds ratio smaller than one, which indicates that predicting class male
becomes less likely.
Player position Weight Odds ratio
Goalkeeper 1.260011 3.525461
Substitute Midfielder 0.578782 1.783865
Defender 0.309324 1.362504
Substitute Goalkeeper 0.000000 1.000000
Substitute Defender − 0.035701 0.964928
Substitute Forward − 0.478682 0.619600
Midfielder − 0.656056 0.518894
Forward − 0.935120 0.392539
Table 5. Logistic regression model estimated weights and odds ratio for each possible value for Player
Position.
female, indicating a higher relevance of lost ground duels for class female. The same reasoning can be applied
to crosses’ values; it stands out that the number of crosses executed has a positive factor in the estimated odds,
while unsuccessful crosses decrease the estimated odds.
The training dataset for the model is composed of numerical and categorical data. For numerical features,
odds ratios greater than one indicate that the prediction of class male vs. class female is more likely to occur.
Odds ratios smaller than one show that the prediction of male vs. female is less likely to occur. The odds ratio
interpretation slightly changes when analyzing categorical features; The odds ratio for categorical features com-
pares the estimated odds when using each feature’s possible value. For each value of the variable, we have an
odds ratio value that reflects the effect of that value among all the other possible values of the variable. As shown
in the following tables, the logistic regression model also allows the analysis part to show each option’s effect in
a categorical feature.
Scientific Reports | (2021) 11:10805 | https://doi.org/10.1038/s41598-021-90264-w 6
Vol:.(1234567890)www.nature.com/scientificreports/
Game section Weight Odds ratio
Overtime-2nd Half 1.091627 2.979119
Overtime-1st Half 0.733228 2.081790
2nd Half − 0.477029 0.620625
1st Half − 0.516509 0.596600
Table 6. Logistic regression model estimated weights and odds ratio for each possible value for Game section.
Feature Coefficient
Ground duels 0.308840
Fouls received 0.167490
Clearances 0.135580
Interceptions 0.118301
Unsuccessful passes 0.084388
Player Position: Goalkeeper 0.023302
Long passes lost 0.018937
Free kicks 0.015709
Successful passes 0.014780
Table 7. Feature coefficients representing the importance of each feature in the Decision Tree model. The
decision tree model assigns each feature importance depending on the information gain noted on the spit
where the feature participates. The overall importance is scaled to 1.
In Tables 5 and 6, we can observe that player position and game section impact the prediction’s likelihood. It is
not easy to interpret the impact’s direction without considering the numerical variables of the dataset. However,
we can state that Goalkeeper and Forward are the two positions that most change the prediction odds. In other
words, goalkeepers and forwards contain more differences between genders than the other player positions
available. Table 6 shows how the first and second half of the game impacts the estimated odds equally, but events
done in overtime positively affect male vs. female predictions. We justify this effect since male games have more
overtime periods than female games.
Decision trees. The Decision Tree model achieved 85% of accuracy while having a 0.9 AUC. We avoided
overfitting by pruning the tree at nodes with a minimum of 40 nodes. Tree-based models are known for being
straight forward interpretable and can yield coefficient-like mathematical evaluations of each feature. Table 7
shows the importance of the top 10 most relevant features in the final decision tree model implemented. The
interpretation of each feature’s importance is different from the previous logistic regression model. If feature xj
has an importance wj , xj contributed wj to the model’s total information gain. In other words, the importance is
an indicator of how much information the feature contains to disseminate between classes.
Decomposing the decision path in a decision tree is an appropriate method to understand its predictions.
The final decision tree model has a depth of 13 and contains 43 leaves. Figure 2 shows the surface level of the
tree. The tree constructor selects the feature ground duels for the root split. At the third and fourth depth levels,
we can already notice leaf nodes with a high purity level. The tree classifies 376 male class nodes correctly after
ground duels value bigger than five, no fouls received, and ground duels bigger than ten. On the other side, 55
nodes with ground duels bigger than five and two or more fouls received are classified as female. Players with less
than six ground duels, more than one clearance, and more than one interception are mostly classified as female.
Neural networks. The basic Neural Network model achieved the best results with 96% accuracy and AUC
of 0.99. The KernelSHAP explainer interprets feature attributions to the prediction as forces that try to increase
or decrease the prediction. In Fig. 3, we can see the individual decomposition of four instances in the data set
into the sum of the effects of each feature value. The explainer describes the model taking the female class as the
reference class and computing for each instance the probability to be classified as female. The base value is the
expected output for the reference class or, in other words, the prediction if no information about the features
was available.
Figure 3a,b are rows from the dataset that the model classifies as female. We can see how the model uses
attributes such as clearances, fouls, ground duels, and passes to impact the output positively, and only ground
duels impact the output in the opposite direction. On the other side, Fig. 3c,d show the effects leading to instances
predicted as male.
Individual explanations might be useful to scratch the neural networks’ behavior, but they are too specific
to particular instances of the data set. SHAP allows the aggregation of all the Shapley values to provide global
explanations. We show the SHAP feature importance and direction of effects in Fig. 4. Ground duels remains
as the most relevant feature as the other models also yielded. Moreover, a Female prediction is more likely with
Scientific Reports | (2021) 11:10805 | https://doi.org/10.1038/s41598-021-90264-w 7
Vol.:(0123456789)www.nature.com/scientificreports/
Figure 2. Visual representation of the pruned Decision Tree model. This figure shows the decision tree model’s
root using ground duels as the highest entropy split. Early leaf nodes appear at the fourth level of the tree with
high degree of purity.
lower ground duels values. Interestingly, the Male class’s prediction is more probable as the number of success-
ful passes increases while a higher number of total passes attempted increases the probability of predicting the
instance as a female player.
Scientific Reports | (2021) 11:10805 | https://doi.org/10.1038/s41598-021-90264-w 8
Vol:.(1234567890)www.nature.com/scientificreports/
Figure 3. SHAP force plots explaining the predicted gender of four players of the data set with female class as
the reference, the model output value is the probability of that instance to be classified as class female. The base
value indicates the expected value for female classes. For female predictions (a) and (b), the explainer outputs
a 1.00 probability while for male predictions (c) and (c) the probability is 0.00. Red arrows indicate positive
Shapley values increasing the probability and blue arrows indicate negative values decreasing the probability.
Figure 4. SHAP summary plot with the top 15 features ordered by feature importance. The class reference is
defined as Female. A high number of ground duels increases the probability of the model classifying a female
player. On the other side, high value of ground duels decreases the likelihood of prediction class Female, which
is equivalent to increase the probability of predicting a male player.
Scientific Reports | (2021) 11:10805 | https://doi.org/10.1038/s41598-021-90264-w 9
Vol.:(0123456789)www.nature.com/scientificreports/
Figure 5. SHAP dependence plots showing the distribution of Shapley values as feature value growths. Using
class Female as reference class. Higher SHAP values indicate higher probability of classification as Female.
Scientific Reports | (2021) 11:10805 | https://doi.org/10.1038/s41598-021-90264-w 10
Vol:.(1234567890)www.nature.com/scientificreports/
Figure 5. (continued)
The overall computation of Shapley values allows us to analyze how each feature values affect the output
model. Several examples are presented in Fig. 5. It stands out how related features differ from each other when
affecting the model classification. In the first row, Fig. 5a–c while a higher number of passes increases the prob-
ability of Female classification, better passes impact is inversed, denoting a possible trend of female players
doing more but less accurate passes. On the other side, the number of ground duels decreases the probability of
classifying as female, while the higher value in won ground duels makes them more likely to classify as male. A
growing number of clearances further increases the probability of a female classification, while interceptions ot
free kicks decrease the likelihood.
Scientific Reports | (2021) 11:10805 | https://doi.org/10.1038/s41598-021-90264-w 11
Vol.:(0123456789)www.nature.com/scientificreports/
Discussion
The aim of the present research was to identify differences between male and female players performance in Euro-
pean Football through machine learning supervised learning techniques. We proposed an end-to-end pipeline
organizing two different football event data logs, data sets gathering all the actions during a European football
game. The integrated dataset was computed by extracting each data source’s event-based metrics by game section
and player position and harmonizing the overlapping features. We trained and evaluated three representatives
supervised learning algorithms to classify the gender of each data point in the integrated dataset; Logistic regres-
sion, Decision Trees, and Neural Networks. The accurate classifiers were investigated by explainability methods
to understand each model’s behavior. In the methodology presented, machine learning algorithms results are
studied in detail, and the focus is moved to the underlying data and knowledge extraction rather than in the
highly accurate predictions or outcomes. Several indicators have been highlighted as demonstrating differences
between female and male performances, moreover, relationships between indicators and combination of actions
in the game also have been shown to disseminate between genders. Independent conclusions and an integrated
perspective with sports scientists would allow further discussion in possible similarities and differences and
quality measurements in European football.
The overall predicting accuracy of the three models was satisfactory. Each model yielded good evaluation
metrics and allowed the study to focus on the explainability methods. The Logistic regression produced feature
weights to identify how the odds of male classification versus female classification were affected by each feature.
We identified ground duels, shots, and interceptions positively impacting the odds of classifying males over
females while higher values of lost ground duels, clearances, or shots decreased the odds. Moreover, we identify
goalkeepers and forwards as the two most differing positions. As expected, the match section where actions
were produced it is not significant to disseminate between male and female games. The decision tree findings
presented the relations between match actions and identified patterns for classification. A fully functional tree
of rules was developed, acknowledging groups of data points classified equally and following similar patterns.
Data points were classified as male when ground duels value was bigger than five, no fouls received, and ground
duels bigger than ten. Feature importance for each feature confirmed the same variables identified in the Logistic
Regression results. Finally, we also explored model-independent methods to explain classification algorithms,
SHAP methods allowed us to understand the classifications of a basic neural network. We analyzed the features
with more effects in individual predictions, accumulative metrics, and the distribution of the feature’s impact
in the model output depending on the feature value. Findings show that ground duels, fouls and passes where
reafirmed to have an impact on determining the gender label. In addition, male perform more accurate passes
and are involved in more ground duels. The three analysis concluded with common features involved as well as
interesting combinations. Logistic regression and neural networks provide numerical effects for each feature,
allowing us to rank and understand each feature’s relevance for gender classification. The addition of a rule-based
tree reasoner complements the previous ranking with the interlinear elements and identifies patterns involving
more than one feature.
The models understood the difference between male and female performance with high prediction accuracy
without overfitting. However, this study is based on the assumption that no systematic difference exists in the data
variables collected from the two data sources analyzed. Due to the scarcity of football data sources, collecting a
sufficient amount of data is not trivial. Ideally, a single data source should incorporate male and female instances
to thoroughly assess that the generation of the present event data logs from football games does not differ from
male and female scenarios. Furthermore, it is essential to state that each model interpretability does not directly
mean causality. The present study provides a data-driven analysis beyond traditional statistical analyzes and
aims to extract trustful knowledge from machine learning algorithms. This study’s results could be applied to
deploy similar analyzes with different pivotal attention, such as the player’s nationality, age, or other qualitative
categories. Furthermore, domain expertise is needed to export the bits of knowledge presented in this study to
profiled training programs.
Data availability
The original football event datasets used to obtain the data set during the current study are available from the
corresponding author on reasonable request. Moreover, the dataset generated and analysed during the current
gshare36.
study is available on fi
Code availability
The code for the preprocessing steps and data analysis pipeline performed for the study are available at https://
git.io/JsmXK.
Received: 19 October 2020; Accepted: 7 May 2021
References
1. Memmert, D. & Raabe, D. Data Analytics in Football: Positional Data Collection, Modelling and Analysis (Routledge, 2018).
2. Low, B., Coutinho, D., Gonçalves, B., Rein, R., Memmert, D. & Sampaio, J. A systematic review of collective tactical behaviours in
football using positional data. Sports Med. 50(2), 343–385. https://doi.org/10.1007/s40279-019-01194-7 (2020).
3. Memmert, D., Lemmink, K. A. P. M. & Sampaio, J. Current approaches to tactical performance analyses in soccer using position
data. Sports Med. 47(1), 1–10. https://doi.org/10.1007/s40279-016-0562-5 (2017).
4. Hewitt, A., Greenham, G. & Norton, K. Game style in soccer: What is it and can we quantify it?. Int. J. Perform. Anal. Sport 16,
355–372 (2016).
Scientific Reports | (2021) 11:10805 | https://doi.org/10.1038/s41598-021-90264-w 12
Vol:.(1234567890)www.nature.com/scientificreports/
5. Horvat, T. & Job, J. The use of machine learning in sport outcome prediction: a review. Wiley Interdiscip. Rev. Data Min. Knowl.
Discov. 10, e1380 (2020).
6. Gudmundsson, J. & Horton, M. Spatio-temporal analysis of team sports. ACM Comput. Surv. 50, 1–34. https://doi.org/10.1145/
3054132 (2017).
7. Pappalardo, L. et al. A public data set of spatio-temporal match events in soccer competitions. Sci. Data 6, 236. https://doi.org/10.
1038/s41597-019-0247-7 (2019).
8. Decroos, T., Van Haaren, J. & Davis, J. Automatic discovery of tactics in spatio-temporal soccer match data. In Proceedings of the
24th ACM SIGKDD international conference on knowledge discovery & data mining, 223–232 (2018).
9. Duch, J., Waitzman, J. S. & Amaral, L. A. N. Quantifying the performance of individual players in a team activity. PLoS One 5, 1–7.
https://doi.org/10.1371/journal.pone.0010937 (2010).
10. Pappalardo, L. et al. PlayeRank: data-driven performance evaluation and player ranking in soccer via a machine learning approach.
ACM Trans. Intell. Syst. Technol. 10, 59:1-59:27. https://doi.org/10.1145/3343172 (2019).
11. Althoff, K., Kroiher, J. & Hennig, E. M. A soccer game analysis of two World Cups: playing behavior between elite female and male
soccer players. Footwear Sci. 2, 51–56. https://doi.org/10.1080/19424281003685686 (2010).
12. Hjelm, J. The bad female football player: women’s football in Sweden. Soccer Soc. 12, 143–158. https://doi.org/10.1080/14660970.
2011.548352 (2011).
13. Bradley, P. S., Dellal, A., Mohr, M., Castellano, J. & Wilkie, A. Gender differences in match performance characteristics of soccer
players competing in the UEFA Champions League. Hum. Mov. Sci. 33, 159–171. https://doi.org/10.1016/j.humov.2013.07.024
(2014).
14. Tenga, A., Zubillaga, A., Caro, O. & Fradua, L. Explorative study on patterns of game structure in male and female matches from
elite Spanish soccer. Int. J. Perform. Anal. Sport 15, 411–423. https://doi.org/10.1080/24748668.2015.11868802 (2015).
15. Casal, C., Losada, J., Maneiro, R. & Ardá, A. Gender differences in technical-tactical behaviour of La Liga Spanish football teams.
J. Hum. Sport Exerc. 16, 37–52. https://doi.org/10.14198/jhse.2021.161.04 (2021).
16. Došilović, F. K., Brčić, M. & Hlupić, N. Explainable artificial intelligence: A survey. In 2018 41st International Convention on
Information and Communication Technology, Electronics and Microelectronics (MIPRO), 0210–0215, https://doi.org/10.23919/
MIPRO.2018.8400040 (2018).
17. Quinlan, J. R. Induction of decision trees. Mach. Learn. 1, 81–106. https://doi.org/10.1007/BF00116251 (1986).
18. Bishop, C. M. Pattern Recognition and Machine Learning (Springer, 2006). ISBN: 9781493938438 9780387310732.
19. Che, Z., Purushotham, S., Khemani, R. & Liu, Y. Distilling Knowledge from Deep Networks with Applications to Healthcare
Domain. arXiv:1512.03542 [cs, stat] (2015).
20. STATS PERFORM Opta. World leaders in sports data. https://www.optasports.com/. Accessed 20 September 2020
21. Zaharia, M. et al. Apache spark: a unified engine for big data processing. Commun. ACM 59, 56–65. https://doi.org/10.1145/29346
64 (2016).
22. Ali, A. Measuring soccer skill performance: a review. Scand. J. Med. Sci. Sports 21, 170–183. https://doi.org/10.1111/j.1600-0838.
2010.01256.x (2011).
23. Lepschy, H., Wäsche, H. & Woll, A. Success factors in football: an analysis of the German Bundesliga. Int. J. Perform. Anal. Sport
20, 150–164. https://doi.org/10.1080/24748668.2020.1726157 (2020).
24. Souza, D. B., Campo, R.L.-D., Blanco-Pita, H., Resta, R. & Coso, J. D. A new paradigm to understand success in professional
football: analysis of match statistics in LaLiga for 8 complete seasons. Int. J. Perform. Anal. Sport 19, 543–555. https://doi.org/10.
1080/24748668.2019.1632580 (2019).
25. Stats Perform. Opta Event Definitions—StatsPerform. https://www.statsperform.com/opta-event-definitions/. Accessed 21 April
2021.
26. Wyscout. Wyscout Glossary. https://dataglossar y.wyscout.com/. Accessed 21 April 2021.
27. WhoScored. Football Statistics|Football Live Scores. https://www.whoscored.com/. Accessed 21 April 2021.
28. Pedregosa, F. et al. Scikit-learn: machine learning in Python. J. Mach. Learn. Res. 12, 2825–2830 (2011).
29. Ali, M. PyCaret: An Open Source, Low-Code Machine Learning Library in Python (PyCaret.org, 2020).
30. Bradley, A. P. The use of the area under the ROC curve in the evaluation of machine learning algorithms. Pattern Recognit. 30,
1145–1159. https://doi.org/10.1016/S0031-3203(96)00142-2 (1997).
31. Bergstra, J. & Bengio, Y. Random search for hyper-parameter optimization. J. Mach. Learn. Res. 13, 281–305 (2012).
32. Tonidandel, S. & LeBreton, J. M. Determining the relative importance of predictors in logistic regression: an extension of relative
weight analysis. Organ. Res. Methodshttps://doi.org/10.1177/1094428109341993 (2009).
33. Parr, T., Lapusan, T. & Grover, P. dtreeviz: Decision Tree Visualization.
34. Lundberg, S. M. & Lee, S. -I. A Unified Approach to Interpreting Model Predictions. In Advances in Neural Information Processing
Systems 30 (eds Guyon, I. et al.), 4765–4774 (Curran Associates, Inc., 2017).
35. Štrumbelj, E. & Kononenko, I. Explaining prediction models and individual predictions with feature contributions. Knowl. Inf.
Syst. 41, 647–665. https://doi.org/10.1007/s10115-013-0679-x (2014).
36. Garnica Caparrós, M. & Memmert, D. Count-based football KPIs https://doi.org/10.6084/m9.figshare.13110746 (2020).
Acknowledgements
This study was possible thanks to a data collaboration with the Leuphana University of Lünenburg (Prof. Dr.
Ulf Brefeld).
Author contributions
M.G.C. and D.M. conceived the study. M.G.C. and D.M. conducted the features extraction from the raw data
sources and validation. M.G.C. implemented the data analysis framework and analyzed the results. All authors
reviewed the manuscript.
Funding
Open Access funding enabled and organized by Projekt DEAL. This research was supported by a Grant from the
Union of European Football Association (UEFA) to the second author.
Competing interests
The authors declare no competing interests.
Additional information
Correspondence and requests for materials should be addressed to M.G.-C.
Scientific Reports | (2021) 11:10805 | https://doi.org/10.1038/s41598-021-90264-w 13
Vol.:(0123456789)www.nature.com/scientificreports/
Reprints and permissions information is available at www.nature.com/reprints.
Publisher’s note Springer Nature remains neutral with regard to jurisdictional claims in published maps and
institutional affiliations.
Open Access This article is licensed under a Creative Commons Attribution 4.0 International
License, which permits use, sharing, adaptation, distribution and reproduction in any medium or
format, as long as you give appropriate credit to the original author(s) and the source, provide a link to the
Creative Commons licence, and indicate if changes were made. The images or other third party material in this
article are included in the article’s Creative Commons licence, unless indicated otherwise in a credit line to the
material. If material is not included in the article’s Creative Commons licence and your intended use is not
permitted by statutory regulation or exceeds the permitted use, you will need to obtain permission directly from
the copyright holder. To view a copy of this licence, visit http://creativecommons.org/licenses/by/4.0/.
© The Author(s) 2021
Scientific Reports | (2021) 11:10805 | https://doi.org/10.1038/s41598-021-90264-w 14
Vol:.(1234567890)You can also read