Understanding occupants' behaviour, engagement, emotion, and comfort indoors with heterogeneous sensors and wearables
←
→
Page content transcription
If your browser does not render page correctly, please read the page content below
Understanding occupants’ behaviour, engagement,
                                         emotion, and comfort indoors with heterogeneous
                                         sensors and wearables
                                         Nan Gao1 , Max Marschall2 , Jane Burry3 , Simon Watkins4 , and Flora D. Salim1
                                         1 RMIT University, School of Computing Technologies, Melbourne, 3000, Australia
                                         2 RMIT University, School of Architecture and Urban Design, Melbourne, 3000, Australia
                                         3 Swinburne University of Technology, School of Design, Melbourne, 3122, Australia
arXiv:2105.06637v1 [cs.HC] 14 May 2021

                                         4 RMIT University, School of Engineering, Melbourne, 3000, Australia

                                         ABSTRACT

                                         We conducted a field study at a K-12 private school in the suburbs of Melbourne, Australia. The data capture contained two
                                         elements: First, a 5-month longitudinal field study In-Gauge using two outdoor weather stations, as well as indoor weather
                                         stations in 17 classrooms and temperature sensors on the vents of occupant-controlled room air-conditioners; these were
                                         collated into individual datasets for each classroom at a 5-minute logging frequency, including additional data on occupant
                                         presence. The dataset was used to derive predictive models of how occupants operate room air-conditioning units. Second,
                                         we tracked 23 students and 6 teachers in a 4-week cross-sectional study En-Gage, using wearable sensors to log physiological
                                         data, as well as daily surveys to query the occupants’ thermal comfort, learning engagement, emotions and seating behaviours.
                                         This is the first publicly available dataset studying the daily behaviours and engagement of high school students using
                                         heterogeneous methods. The combined data could be used to analyse the relationships between indoor climates and mental
                                         states of school students.

                                         Background & Summary
                                         How can indoor spaces be designed in ways that increase occupant well-being while decreasing energy consumption? Answering
                                         this question requires a holistic understanding of indoor climates, occupant comfort and behaviour, as well as the dynamic
                                         relationships between these different aspects. The present study sits within a context of research that aims to gain insights
                                         by examining these themes using mixed methods of data capture within operational buildings. More specifically, the study
                                         contains two separate assays, each relating to a distinct body of existing research.
                                             The first assay is a 5-month longitudinal field study using outdoor and indoor weather stations as well as sensors to
                                         determine the use of occupant-controlled room air-conditioners. This assay was undertaken to contribute knowledge to the
                                         research field of occupant behaviour modelling in building performance simulation. During the design of buildings, engineers
                                         often use simulations to predict the indoor environmental quality and energy consumption of design options in order to inform
                                         decision-making. There are often large discrepancies between simulated and actual building performance1 . One of the main
                                         factors driving this so-called ’performance gap’ is the current misrepresentation of occupant behaviour in the simulations2 . The
                                         software is accurate at modelling deterministic systems like automated air-conditioning units that are governed by set point
                                         temperatures, but incapable of accurately modelling the probabilistic nature of human behaviour, for example, the manual
                                         operation of air-conditioners. Occupant behaviour tends to be modelled on simplistic, rule-of-thumb assumptions that are not
                                         backed by data3 , usually by using the same set point approaches that are applied to automated systems (e.g. occupant switches
                                         on the air-conditioner when the indoor temperature exceeds 24 °C). Actual human behaviour is less responsive and more varied;
                                         thus, researchers have conducted field studies in operational buildings, by measuring various environmental and other variables
                                         alongside an observed behaviour (for example, the operation of air-conditioners, windows, lights, fans, etc.). They use this
                                         data to derive statistical models of the observed behaviour based on one or several of the observed independent variables4–6 .
                                         The first assay of our study contributes data towards this endeavour, specifically enabling the creation of predictive models of
                                         occupants’ use of room air-conditioners in schools.
                                             The second assay is a 4-week cross-sectional study tracking 23 students and 6 teachers, using wearable sensors to log
                                         physiological data, as well as daily surveys to query the occupants’ thermal comfort, learning engagement, seating positions
                                         and emotions while at school. Buildings contribute about a third of world energy consumption, which is mainly due to indoor
                                         climate regulation using heating, ventilation and air-conditioning (HVAC) systems. Since we spend so much energy and effort
                                         on providing adequate environments to building occupants, it is worth investigating what exactly constitutes their comfort and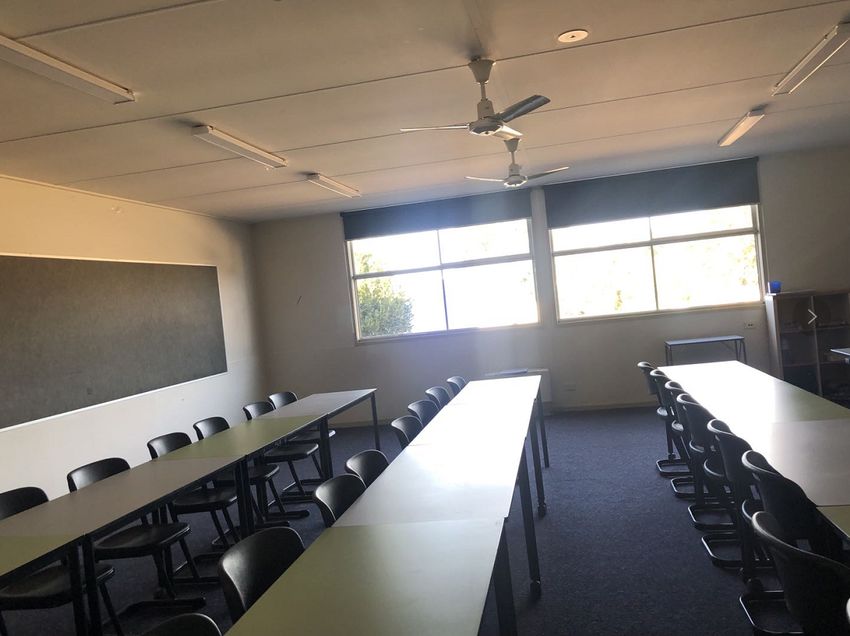
Name              Year   Par   Type    Modalities                  Annotations                 Duration      Scenario
 Driving-stress9   2005   24    Field   ECG, EDA, EMG, RESP         Stress level                >50 mins      Real-world driving tasks
                                                                    Arousal, valence, like/
                                        Videos, EEG, EDA, BVP,
 DEAP10            2011   32    Lab                                 dislike, dominance,         40 mins       Watch music videos
                                        RESP, ST, EMG and EOG
                                                                    familarity
 Driving-work11    2013   10    Field   EDA, HR, TEMP               Mental workload             30 mins       Drive a predefined route
 StudentLife12     2014   48    Field   Smartphone                  Stress, mood, happiness     10 weeks      Real life, student exams
                                        ECG, EMG, EOG, MEG,         Valence, arousal, and                     Watch music video and
 DECAF 13          2015   30    Lab                                                             >1 hour
                                        near-infrared face, video   dominance                                 movie clips
                                                                                                              Four types of stress
                                        ACC, EDA, HR, TEMP,
 Non-EEG14         2016   20    Lab                                 N/A                         6 mins
                                                                    personality                               three difficulty levels
                                                                    Cognitive load,
 CogLoad18         2020   23    Lab     ACC, BVP, EDA, TEMP                                     N/A           6 cognition load tasks
                                                                    personality
                                        Videos, audio, ACC,                                                   Social interaction
                                                                    Arousal, valence,           173 mins
 K-EmoCon19        2020   32    Lab     EDA, EEG, ECG, BVP,                                                   scenario involving
                                                                    stress, affect              (total)
                                        TEMP                                                                  two people
                                                                    Cognitive, behavioral,
                                        ACC, EDA, BVP, TEMP,                                    4 weeks
                                                                    emotion engagement,                       Real-world courses in
 En-Gage           2021   29    Field   In. TEMP, HUMID., CO2,                                  (1416 hours
                                                                    thermal comfort, arousal,                 a high school
                                        NOISE                                                   in total)
                                                                    valence

                                Table 1. Publicly available datasets in affective computing area

well-being. The above-mentioned building performance simulations tend to define comfort either by using deemed-to-satisfy
temperature thresholds or by using comfort models, most commonly the predicted mean vote (PMV) model. However, the
PMV model has not been updated since it was derived from laboratory experiments in the 1960s. It has been criticised for its
poor predictive performance in real-world contexts7 and does not appear to apply for all age groups8 . Furthermore, thermal
acceptance is clearly only one of several metrics for assessing indoor well-being.
    On the other hand, studying students’ learning engagement, emotions, and daily behaviours has attracted increasing interests
to address problems such as low academic performance and disaffection. Sensor-based physiological and behaviour recordings
provide great opportunities to unobtrusively measure students’ behaviours and emotional changes in classroom settings20, 21 .
In previous studies, various physiological signals such as electrodermal activity (EDA), heart rate variability (HRV) and
environmental data have been investigated to assess emotional arousal and engagement level. For example, EDA is generally
regarded as a good indicator of psychological arousal, which has been increasingly studied in affective computing area, such as
the detection of engagement20, 21 , emotion22 , and depression23 . Existing datasets in affective computing area provide limited
scope on understanding emotion responses in real-world settings. Or, they only consider a particular type of annotations to meet
their research goals (e.g., stress level, mental workload). Table 1 shows how En-Gage dataset is distinguished from existing
emotion datasets.
    Our second assay is the first publicly available dataset studying the daily behaviours and engagement of high school students
using heterogeneous methods. Together with the first assay data set, it offers a unique opportunity to analyse the relationships
between indoor climates and the mental states of school students – not only related to their thermal comfort but also their
emotions, engagement and productivity while at school. Especially, it’s unusual to combine individual sensor data with building
environmental data together, to study how indoor and outdoor environments influence the complex occupant behaviours and
physiological responses, which will benefit building scientists, behaviour psychologists and affective computing researchers.

                                                                                                                                   2/15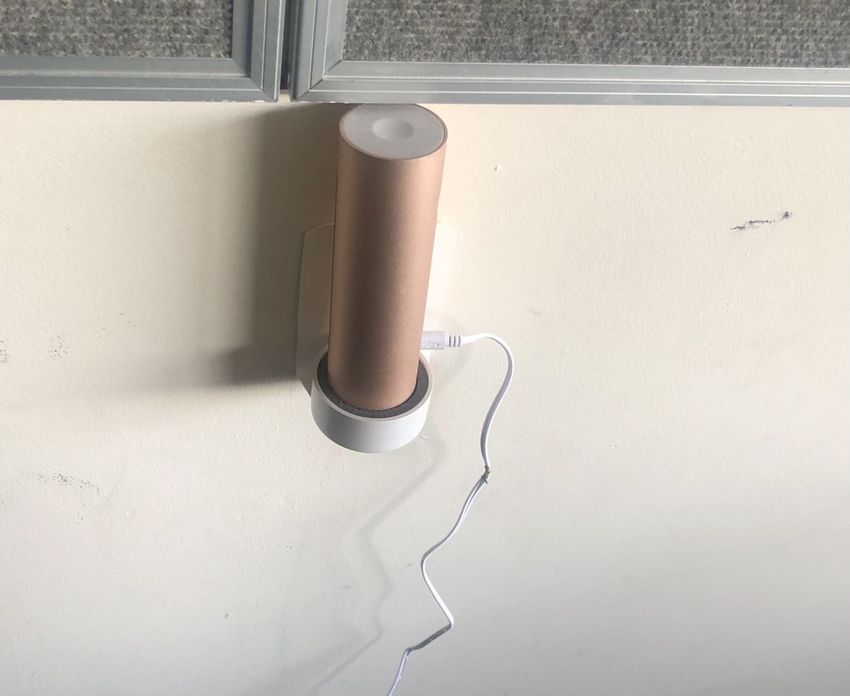
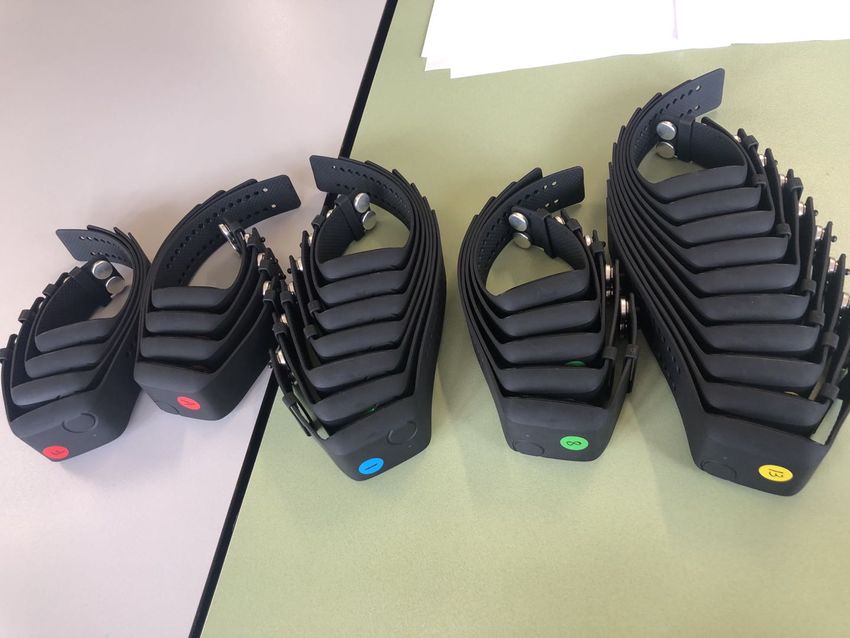
(a) Empatica E4 wristbands            (b) Netatmo indoor weather station       (c) Classroom for Year 10 students

                         Figure 1. Devices and environments for collecting wearable and indoor data.

                       Group         Room     Participant
                                     R1       P13, P14, P15, P16, P17, P18, P19, P20, P21, P22
                       Form          R2       P8, P9, P10, P11, P12, P23
                                     R3       P1, P2, P3, P4, P5, P6, P7
                                     R1       P2, P4, P5, P10, P11, P14, P18
                       Math          R2       P3, P6, P7, P8, P9, P15, P16, P17, P20
                                     R3       P1, P12, P13, P19, P21, P22, P23
                                     R1       P1, P2, P4, P7, P10, P13, P15, P17, P19, P20, P21, P22, P23
                                     R2       P9, P14
                       Language
                                     R3       P5, P6, P11, P12, P16
                                     R4       P3, P8 P18

                              Table 2. Distribution of student participants in different class groups.

Methods
Ethics approval
The data collection was approved by the Science, Engineering and Health College Human Ethics Advisory Network (SEH
CHEAN) of RMIT University. SEH CHEAN also reviewed and approved the participant consent form which included
information on the purpose and procedure of the research, the types of data that were collected, the compensation of the
involvement, and the protocol of privacy protection and data storage. The project was furthermore approved by the principal of
the school in which the study was conducted.

Participants and recruitment
For the cross-sectional assay in this study, we recruited 23 students (15-17 years old, 13 female and 10 male) in Year 10, and
6 teachers (33-62 years old, 4 female and 2 male). The recruitment occurred between August and September 2019. First,
we presented an introduction of the project to students and teachers in the school hall, and handed out information leaflets,
recruitment letters and consent forms - for students, their guardians and teachers. In the following days, we received the signed
consent forms from students and teachers who volunteered to participate. The volunteers were then asked to complete an
online background survey which was accessible through a web page link that we shared with them. In this survey, we collected
information on the participants’ age, gender, general thermal comfort and students’ classes. The students of year 10 at this
school were taught in separate class groups. They were separated into 3 "form" groups (for English, Science, Global Politics,
Physical Education, Health/Sport classes), 3 math groups and 4 language groups (see Table 2). Asking for each individual
student’s class group in the background survey allowed us to determine which classroom they were in at any given time. Among
the participating teachers, there were 3 math teachers, 1 English teacher, 1 Japanese teacher, and 1 science teacher.
    As a token of appreciation for their participation, we gave each of the participating students a certificate of participation and
four movie vouchers - one for each week of successful participation. Participation in this research project was voluntary, and
we communicated to the participants that they were free to withdraw from the project at any stage.

                                                                                                                                 3/15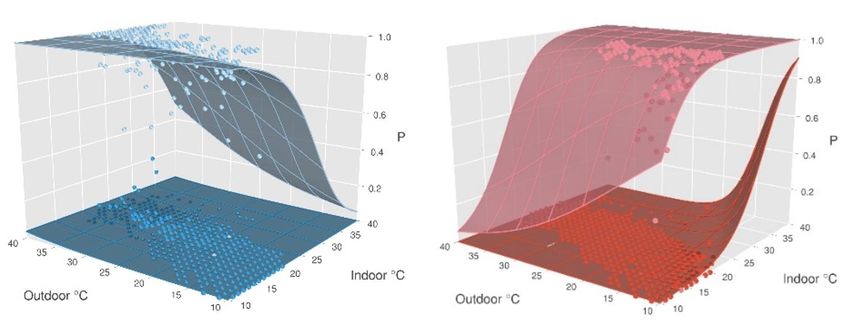
Devices                      Collected data                             Sampling rate       Time frame
                                           3-axis acceleration                        32 Hz
                                           Skin temperature                           4 Hz
              Empatica E4 wristband                                                                       4 weeks
                                           Electrodermal activity                     4 Hz
                                           Blood volume pulse                         64 Hz
              Netamo indoor weather
                                           Humidity, temperature, noise level, CO2    5 minutes           5.5 months
              station
                                           Temperature, humidity, barometric
              DigiTech XC0422 outdoor
                                           pressure, wind speed, wind direction,      5 minutes           5.5 months
              weather station
                                           solar radiation, UV, rainfall
              PHILIO Z-wave (attached
                                           Humidity, temperature                      5 minutes           5.5 months
              to air-conditioning vents)

                           Table 3. Data collected with sensors with respective sampling rate and time.

Figure 2. Data sample showing the indoor ambient temperature, the temperature reading at the air conditioning vent and the
inferred air conditioning states.

Experiment setup
We conducted our study at a mixed-gender K-12 private school.The longitudinal study was conducted for a 5.5-month period
from 7th October 2019 to 23rd March 2020, using the indoor and outdoor weather stations as well as temperature sensors
attached to air-conditioning outlets. The cross-sectional study included 4 weeks of data capture: the first two weeks of data
were collected in early September 2019 (winter in the southern hemisphere), and the second two weeks in November 2019
(spring in the southern hemisphere). Totally, we have collected 1415.56 hours of wearable data from all participants.
    In our data collection, we tracked participants using Empatica E4 1 wristbands measuring physiological data, as well as daily
surveys to query the occupants’ thermal comfort, learning engagement, and emotions while at school. 1 volunteer student was
chosen as the representative for each of the three form classes. Their job was to distribute the wristband sensors each morning,
collect them after school, and remind the participants to complete the online surveys at the appropriate times. We anonymised
the student’s data by assigning each student an ID. Occupancy schedules were obtained from individual classroom schedules
provided by the school. These schedules may be used to represent the actual occupancy patterns of the building, although
slight deviations from the planned schedule are to be expected in a school setting due to sickness and other circumstances. The
following is a description of the research instruments used in the study.
    DigiTech XC0422. We set up two outdoor weather stations on-site: one in the prevailing NNW windward direction located
at some distance from the buildings, and one on the SSE leeward side. These logged the data types shown in Table 2 at 5-minute
intervals via the school’s guest WIFI to WUnderground.com where it can be accessed remotely. Note that these weather stations
log solar irradiance values in W/m2 but only have a luminosity sensor. The method of conversion from lux to W/m2 is unclear
from the product’s datasheet, but we assumed that it was in line with a commonly used, simplified conversion rate (e.g. Michael,
2019)24 .
    Netatmo Healthy Home Coach. We collected indoor environmental data using Netatmo Healthy Home Coaches 2 installed
in 17 classrooms as shown in Figure 1(b) and Figure 1(c). These devices measure indoor temperature, relative humidity, CO2
and noise levels at a 5-minute logging frequency. The data is uploaded in real-time via the school’s guest WiFi to the Netatmo
cloud platform from which we could access the data remotely through our Netatmo account login. The analysed classrooms
  1 Empatica  E4 wristband: https://www.empatica.com/en-int/research/e4/
  2 Netatmo   Healthy Home Coach: https://www.netatmo.com/en-eu/aircare/homecoach

                                                                                                                            4/15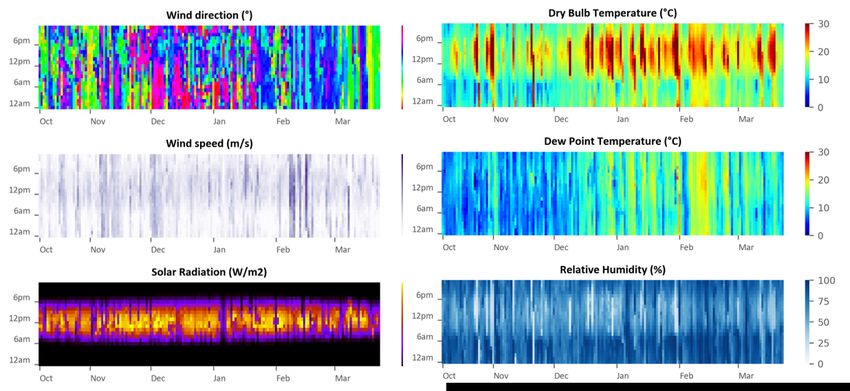
Figure 3. Daily indoor environmental trends by month.

differed from one another in several aspects including the room geometry and orientation, as well as the number and location of
windows. The placement of environmental sensor devices was therefore determined on a case-by-case basis, with the goal of
finding an optimal trade-off between several, partly conflicting considerations, most of which were suggested by Wagner et
al. (2017). For example, we tried placing the sensors close to the occupants but at the same time avoiding the sensors from
being obstructed, biased or obtrusive due to their proximity to the occupants, furniture, heating elements, vents or appliances.
ASHRAE Standard 55 recommends temperature sensor heights of 0.1, 0.6 and 1.1 m for ankles, waists and heads of seated
occupants, respectively. Since in this study only one device per room was installed and the head height of children is lower than
that of adults, we attempted to place the sensors at about 0.9 m height, while respecting the above considerations as well as
possible. Three of the classrooms with a Netatmo sensor were classrooms frequented by year 10 students, therefore this data
could be used in combination with the data captured by the Empatica E4 wristband sensors in the cross-sectional study assay. It
should be noted that we started using these 3 devices and the outdoor weather stations before beginning the full longitudinal
field study in all classrooms.
     Philio Temperature/Humidity Sensor. The classrooms had split-system remote-controlled air-conditioning units for
heating and cooling. We inferred their usage by measuring temperature fluctuations with Philio Temperature/Humidity Sensors
placed at the outlets of the vents of the remote-controlled room air conditioning units. The sensors logged data via Z-Wave to
Vera Edge hubs, several of which were placed throughout the school due to their limited range. Data was logged at 5-minute
intervals using custom LUA scripts via the VeraAlerts app within the Vera SmartHome app, which enabled sending the data to
the Pushbullet online platform from where they could be accessed remotely.
     Empatica E4 wristband. These wristband sensors (see Figure 1(a)) were first proposed for use in studies by Garbarino et
al.25 . The watch-like devices have multiple sensors: an electrodermal activity (EDA) sensor, a photoplethysmography (PPG)
sensor, a 3-axis accelerometer (ACC), and an optical thermometer. EDA refers to the constantly fluctuating changes in the
electrical properties of the skin at 4 Hz, when the level of sweat increases, the conductivity of the skin increases. PPG sensors
measure the blood volume pulse (BVP) at 64 Hz, from which the inter-beat interval (IBI) and heart rate variability (HRV)
can be derived. The ACC records 3-axis acceleration in the range of [-2g, 2g] at 32Hz and captures motion-based activity,
which has been widely used in smartphones, wearables, and other IoT devices26 . The optical thermometer reads peripheral skin
temperature (ST) at 4 Hz. In recording mode, E4 wristbands can store 60 hours of data in memory, with battery lifetimes of
over 32 hours. They are light-weight, comfortable and water-proof, thus especially suitable for continuous and unobtrusive
monitoring of the participants in our study. Before the data collection, all wristbands were synchronized with the E4 Manager
App, using a single laptop to ensure that the internal clocks were accurate. Each student was assigned a wristband sensor
marked with their unique study ID. The students were asked to wear the wristband on non-dominating hands, and to avoid
pressing the button or performing any unnecessary movements during class. The teaching participants were only required to
wear the wristbands while teaching the year 10 classes. Figure 4 shows the average wearable signals per school day for all
participants from 369 traces.
     Daily surveys. On each school day, student participants were asked to complete online surveys (either through tablets that
we placed in each of the study classrooms, or using their own digital devices) at 11:00, 13:25, 15:35 (directly after the 2nd ,
4th , and 5th lesson). The length of the 2nd and 4th lesson was either 40 minutes or 80 minutes depending on the day of the
week, and the 5th class always lasted 80 minutes. The class schedules at this school had a fortnightly rhythm. That is, week

                                                                                                                            5/15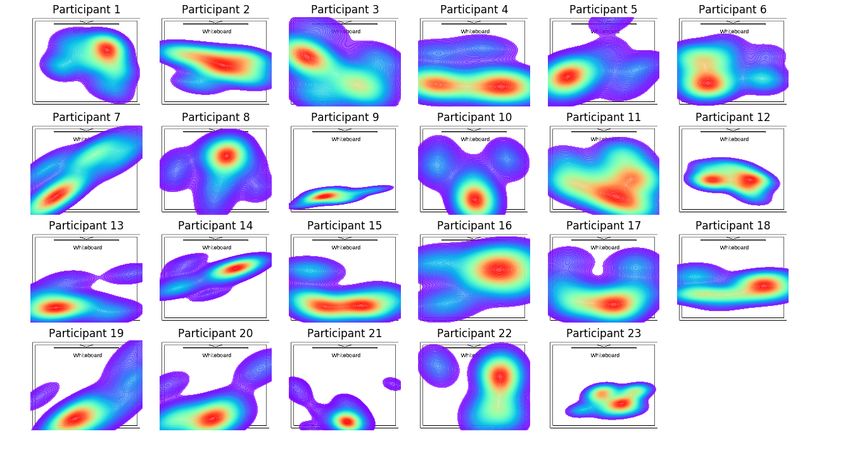
(a) Heart Rate                                          (b) Electrodermal Activity

                         (c) Skin Temperature                                  (d) 3-axis Acceleration (Magnitude)

                      Figure 4. Wearable signals per school day for all participants (369 traces in total).

1 and 2 had different timetables, but week 1 and 3 were identical, as were week 2 and 4 etc. The representative student was
tasked to remind the student participants to complete the online surveys on time. The collected annotations (thermal comfort,
learning engagement, emotion, etc.) are described in Table 4. Figure 6 shows the distribution of responses for the thermal
sensation (from -3 to 3), thermal preference and clothing level. The distribution of multi-dimensional (behavioural, emotional
and cognitive) engagement, and valence/arousal emotion are shown in the Figure 7.

Data post-processing
For the longitudinal study, we extracted the environmental data from their respective online platforms and rounded each data
point’s timestamp to the nearest 5-minute step to enable the aggregation of data from different sources, and interpolated over
missing data points. The data from the two weather stations were averaged for each time step. In cases where one of the
stations had missing data, we used the other weather station’s data point. The outdoor wind direction was originally given
in a 16-step scale of cardinal directions which we converted to numerical angle values in degrees. Within the context of this
field study, there was no way to directly monitor when the air conditioning units were in use. Instead, we measured their use
indirectly with the Philio temperature sensors mounted to the air conditioning outlets. Creating an algorithm that reliably
distinguishes all four event types (cooling switched on, cooling switched off, heating switched on and heating switched off) is a

 Annotation categories      Description                                    Measurement scale
                                                                           -3: cold, -2: cool, -1: slightly cool, 0: neutral,
 Thermal sensation          Commonly used ASHRAE thermal sensation27
                                                                           1: slightly warm, 2: warm, 3 = hot
 Thermal preference         Commonly used ASHRAE thermal preference27      Choose one (cooler, no change, warmer)
 Clothing level             Commonly used ASHRAE clothing insulation27     Choose multiple
 Seating position           Seating position in the classroom              Click one point
                                                                           -2: strongly disagree, -1: somewhat disagree,
 Behavioural/Emotional/     Adapted In-class Student Engagement
                                                                           0: neither agree nor disagree, 1: somewhat agree,
 Cognitive engagement       Questionnaires (ISEQ)28
                                                                           2: strongly agree
                            Commonly used affective dimensions from
 Arousal/Valence                                                           Choose one photo
                            the Photographic Affect Meter (PAM)29
                                                                           1: not confident, 2: slightly confident, 3: moderately
 Confidence level           Confidence level of the response
                                                                           confident, 4: very confident, 5: extremely confident

                                      Table 4. Collected annotations from the questionnaires.

                                                                                                                                    6/15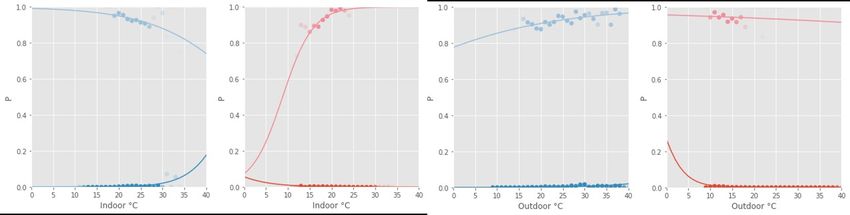
+LJK

                                                      2YHUDOO(QJDJHPHQW6FRUH


                                                                                                                                                                                                                                                                                                           (QJDJHPHQW/HYHO


                                                                                                                                                                                                                                                                                                         /RZ

                                                                                                                                                                                              3DUWLFLSDQW,'

                                                   Figure 5. Distribution of the overall engagement scores for 23 student participants.

task that would have exceeded the scope of our research. Instead, we used threshold values of the temperature slope to predict
events. If the current state was off, then a sudden rise would be classified as switching on the heating; if the current state was
cooling, the same rise in temperature would be classified as switching off the cooling. Since this crude method was limited
in its predictive capability, we relied on a visual assessment of the data and manually overwrote time frames with states that
appeared to have been incorrectly categorised by the algorithm. This is a potential source for error, but we assumed that the
assessment was sufficiently accurate for this study - an assumption that proved correct when testing it on site. We aggregated
all the data into spreadsheets for each classroom individually, and added several data, including columns that identified holiday
periods, occupancy and time frames of insufficient data coverage.
     In the cross-sectional study, for the wearable data, we converted the timestamps of the wristband sensor readings from
raw time intervals and Unix time to the local datetime format. Then we categorized the wearable data based on a different
date. We also extracted the wearable data according to the scheduled length for the 2nd , 4th , 5th class which ends at 11:00,
13:25, 15:35. For the online survey, we received a total of 488 valid online surveys from students with a response rate of 35.3%.
We also received 22 online surveys from teachers. We then aligned the survey data to one of the three classes. We set the
survey responses before 11:25 pm belong to the 2nd class, between 12:15 pm - 14:15 pm belong to the 4th class, after 14:15 pm
belongs to the 5th class.

Data Records
Summary
We are sharing 2 datasets: one for the longitudinal study and one for the cross-sectional study. For the latter, we have provided
two versions: the original raw data by date and a dataset based on the different class groups of the participants.
    The longitudinal study dataset consists of comma-separated variable (CSV) files - one for each classroom. Each classroom’s
spreadsheet contains time-related information and outdoor weather conditions (these are obviously identical for all classrooms).
Furthermore, each classroom has information on its own indoor climate, whether or not it is occupied according to the class
schedule, and information on whether its room air-conditioner is in heating or cooling mode.


      )UHTXHQF\

                                                                                                                                                           1XPEHUV

                                                                                                                                                                                                                                      1XPEHUV


                                                                                                                                                                         &RROHU 1RFKDQJH :DUPHU
                                           *HQHUDO7KHUPDO6HQVDWLRQ                                                                                               7KHUPDO3UHIHUHQFH                                6KLUW -XPSHU-DFNHW 3DQWV 6KRUWV 6NLUW 'UHVV 2WKHU

                                       (a) Thermal Sensation                                                                                                                         (b) Thermal preference                                                                        (c) Clothing level

                                                                                                                        Figure 6. Distribution of responses related to thermal comfort.

                                                                                                                                                                                                                                                                                                                                                               7/15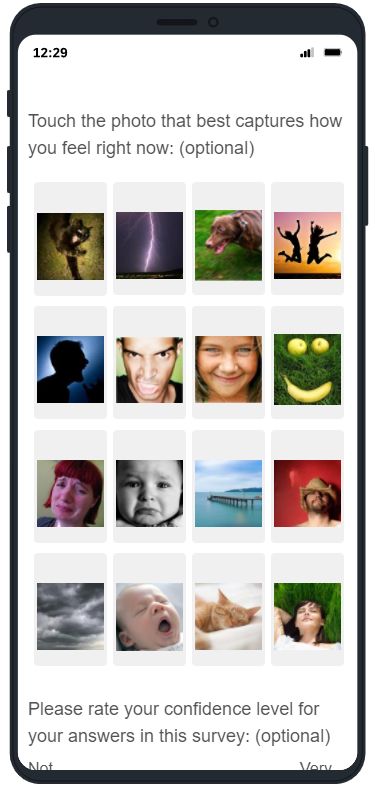
                                                                                              %HKDYLRXUDO


                                                                                                    (PRWLRQDO
                                                                                              &RJQLWLYH


                           'HQVLW\

                                                                                                                              $URXVDO


                                                                 (QJDJHPHQW6FRUH                                                            9DOHQFH
                                                     (a) Multi-dimensional Engagement                                                            (b) Valence and Arousal

                         Figure 7. Distribution of responses related to the engagement and emotion.

                       Figure 8. Hourly outdoor climate (averaged between the two weather stations).

   The cross-sectional study dataset includes physiological signals measured with the wristband sensors as well as self-reported
engagement, thermal comfort, seating locations, and emotion data from the student and teacher participants. It also lists the
outdoor and indoor environment data for the year 10 classrooms.

Contents
The In-Gauge and En-Gage datasets30 are available on Figshare (https://doi.org/10.25439/rmt.14578908). In the following, we
describe the directories and files in our datasets.

Longitudinal
This folder contains all data pertaining to the longitudinal field study. It consists of a TXT file describing the dataset and 16
CSV files - one for each classroom. The CSV file names correspond to the classroom names. Each CSV file has a single header
line and each of the following rows contains the following timestamped data at a resolution of 5 minutes per row:
    •   Timestamp: Local Datetime format e.g. ’2019-10-08 18:25:00’.
    •   Year: An integer of either 2019 or 2020.
    •   Month: An integer between 1 and 12.
    •   DayOfYear: An integer between 1 and 365.
    •   Occupied: ’0’ means that the room was not occupied at this time according to the classroom schedule; ’1’ means it was.
    •   SchoolDay: ’0’ means that this day was not a school day; ’1’ means it was.
    •   Hour: An integer representing the hour od day from 0 to 23.

                                                                                                                                                                                                          8/15
Figure 9. Multiple logistic regression modelling results for switching a room air-conditioner on (left) and off (right), based on
indoor and outdoor air temperature.
Units Range Accuracy Resolution
Dry Bulb Temperature °C -40 °C – 60 °C ±1 % 0.1 °C
Dew Point Temperature °C -40 °C – 60 °C ±1 % 0.1 °C
Relative Humidity % 1 % - 99 % ±5 % 1%
±1 m/s (= 5 m/s)
±1 m/s (= 5 m/s)
Wind Direction ° 0 ° - 360 ° ±22.5 ° 22.5 °
0.3 mm (= 1000 mm)
Light Lux 0k Lux - 400k Lux ±15 % 0.1 Lux
Solar Radiation W/m2 - - -
Table 5. DigiTech XC0422 logging specifications.
• LessonNumber: An integer signifying which lesson is currently taking place (note that each school day started with a
10-minute assembly referred to here as the ’0’th lesson): ’-1’ = outside of school hours; ’0’ = 8:50-9:00; ’1’ = 9:00-9:40;
’2’ = 9:40-10:20; ’3’ = 10:20-11:00; ’4’ = 11:25-12:05; ’5’ = 12:05-12:45; ’6’ = 12:45-13:25; ’7’ = 14:15-14:55; ’8’ =
14:55-15:35; ’9’ = Recess times or special "Breadth Studies" session on Wednesdays.
• LessonPct: A fraction between 0.0 and 1.0 describing how much of the current lesson has passed.
• IndoorTemperature: A decimal number representing the current indoor temperature in °C.
• IndoorHumidity: An integer representing the current indoor relative humidity in %.
• IndoorCO2: An integer representing the current indoor CO2 concentration in ppm.
• IndoorNoise: An integer representing the current indoor noise level in dB.
• OutdoorTemperature: A decimal number representing the current outdoor temperature in °C.
• OutdoorHumidity: An integer representing the current outdoor relative humidity in %.
• OutdoorDewpoint: A decimal number representing the current outdoor dewpoint temperature °C.
• OutdoorWindDirection: An integer representing the current outdoor wind direction in degrees, from 0 to 360 (0° = north
wind, 90° = east wind, etc.).
• OutdoorWindSpeed: A decimal number representing the current outdoor wind speed in m/s.
• OutdoorGustSpeed: A decimal number representing the current outdoor gust speed in m/s.
• Precipitation: A decimal number representing the current outdoor precipitation in mm.
• UvLevel: An integer between 0 and 11 representing the current outdoor Global Solar UV Index.
• SolarRadiation: An integer representing the current outdoor solar radiation intensity in W/m2 .
• CoolingState: ’0’ means that the room air-conditioner was currently not cooling the room; ’1’ means it was.
• HeatingState: ’0’ means that the room air-conditioner was currently not heating the room; ’1’ means it was.
• UsabilityMask: For timeframes where too much data was missing, we set this UsabilityMask field to "False" for the
entire day. During holidays, the UsabilityMask also reads "False".
9/15Units Range Accuracy Resolution
Dry Bulb Temperature °C 0 °C to 50 °C ± 0,3 °C 0.1 °C
Relative Humidity % 0 to 100 % ±3% 1%
±50 ppm (= 1,000 ppm)
Noise dB 35 dB to 120 dB - 1 dB
Table 6. Netatmo Healthy Home Coach logging specifications.
Figure 10. Simple logistic regression modelling results for switching a room air-conditioner on (first figure) and off (second
figure), based on indoor air temperature (third figure) or outdoor temperature (fourth figure).
Participant_class_info
This folder contains demographic information on the background questionnaires participants, and the class table. Note that for
several survey questions, we adopted the 5-point Likert scale: -2 = ’strongly disagree’, -1 = ’somewhat disagree’, 0 = ’neither
agree nor disagree’, 1 = ’somewhat agree’ and 2 = ’strongly agree’. The Participant_class_info folder contains the following
files:
1. Student.csv. Each row in this file contains a participant ID (Column A), gender (Column B), age in years (Column C),
form room, math room and language room (Columns D - F), and three background questions (Columns G - K) related to
their general thermal comfort and engagement in class. Specifically, Columns G to I represent, respectively, the questions
’What is your general feeling in the classroom?’ [-3 = cold, -2 = cool, -1 = slightly cool, 0 = neutral, 1 = slightly warm, 2
= warm, 3 = hot], ’When I am engaged in class, I usually don’t feel too hot or too cold’ and ’When I am engaged in class,
I could get distracted when the room is too hot or too cold’. For the latter 2 questions, we adopted the 5-point Likert
scale.
2. Teacher.csv. Each row in this file contains a participant ID (Column A), gender (Column B), age in years (Column C),
teaching subject (Columns D), and three background questions similar to the student.csv file, except that we changed the
last two questions slightly from ’When I am engaged in class, [...]’ to ’When I am engaged in teaching, [...]’.
3. Class_table.csv. We generate this file from the class schedule obtained from the school. Each row in this file contains the
information of one single class, including the unique class ID (Column A), classroom (Column B), date (Column C),
start time of the current class (Column D), finish time of the current class (Column E), length of the class (Column F),
week (Column G), weekday (Column H), the order of the class (Column I) and the course name (Column J). Specifically,
Column K shows whether students take this class in a form group, where ’0’ indicates they are not in a form group, ’all’
indicates all students take this class in one whole form group (i.e., Assembly, Chapel), the R1/R2/R3 means students take
this class in form groups and their form room is R1, R2 or R3.
Survey
This folder contains 2 files: Student_survey.csv and Teacher_survey.csv.
Student_survey.csv contains the 488 survey responses including 15 columns where Column A is participant ID and Column
B is the recorded time. There are columns containing thermal comfort-related information (Columns C - G), multi-dimensional
student engagement (Columns H - L), mood (Column M), and confidence level of the survey (Column N). The engagement
questions were rated using the Likert-scale. To calculate the engagement score, users should reverse the responses in item 2 and
item 4, then calculate the average of the 5-point Likert scale for each dimension of engagement. The specific columns relate to
the following questions:
10/15Figure 11. Distribution of seating positions across different participants.
• Column C: Thermal_sensation: "How do you feel right now in the classroom?" [-3 = cold, -2 = cool, -1 = slightly cool, 0
= neutral, 1 = slightly warm, 2 = warm, 3 = hot].
• Column D: Thermal_preference: "Would you like to be?" [Cooler, No change, Warmer].
• Column E: Clothing: "What are you wearing now? (multiple options allowed)" [Shirt, Jumper, Jacket, Pants, Shorts,
Skirt, Dress, Other].
• Columns F - G: Loc_x, Loc_y: "Where did you sit in the last class? (please click on the floorplan)" [x, y pixels in the
400*321 room thumbnail where x = y = 0 at the upper left corner].
• Columns H - L: Engage_1, 2, 3, 4, 5: "Please describe your engagement in the last class": [I paid attention in class], [I
pretended to participate in class but actually not], [I enjoyed learning new things in class], [I felt discouraged when we
worked on something], [I asked myself questions to make sure I understood the class content].
• Columns M - N: Arousal, Valence: "Touch the photo that best captures how you feel right now (optional)" [We assigned
the arousal and valence values from 1 - 4 to each picture. For instance, for the right bottom picture, valence = 4 and
arousal = 1].
• Column N: Confidence_level: "Please rate your confidence level for your answers in this survey (optional)" [5-point
Likert scales where 1 = Not confident, 2 = Slightly confident, 3 = Moderately confident, 4 = Very confident, 5 = Extremely
confident].
Teacher_survey.csv contains the 22 survey responses by the teachers. The file includes 11 columns where Column A is the
recorded time, Column B is the wristband ID, Columns C - E are the thermal comfort related information, Columns F - G are
the engagement related information, and Column K is the confidence level of the survey. For the wristband ID in Column B,
A/B/C/D represent the classrooms R1/R2/R3/R4. The specific columns relate to the following questions:
• Column B: Wristband_id: "Please enter your wristband ID." [A, B, C, D].
• Column C: Thermal_sensation: "How do you feel right now in the classroom?" [-3 = cold, -2 = cool, -1 = slightly cool, 0
= neutral, 1 = slightly warm, 2 = warm, 3 = hot].
• Column D: Thermal_preference: "Would you like to be?" [Cooler, No change, Warmer]
• Column E: Clothing: "What are you wearing now? (multiple options allowed)" [Shirt, Jumper, Jacket, Pants, Shorts,
Skirt, Dress, Other].
• Column F - G: Engage_1, 2, 3, 4, 5: "Please describe your engagement in the last class": [I was excited about teaching],
[I felt happy while teaching], [While teaching, I paid a lot of attention to my work], [I cared about the problems of my
students], [I was aware of my students’ feelings].
• Column K: Confidence_level: "Please rate your confidence level for your answers in this survey (optional)" [5-point
Likert scales where 1 = Not confident, 3 = Somewhat confident, 5 = Very confident].
11/15Figure 12. Screenshot of the mood question.
Raw_wearable_data
This folder contains 20 sub-folders from ’20190902’ to ’20191122’, containing the raw wearable data for each day during
the 4-week data collection. In each sub-folder, there are multiple sessions from different participants. Some participants
provided more than 1 session on the same day. The name of each session consists of two parts connected by an underscore: the
unique session ID and the participant ID. For example, the session named ’1567380164_18’ indicates the data is provided by
participant 18. There are 6 CSV files in each session, and each of these files (except IBI.csv) has the following format: the first
row is the initial time of the session expressed as a Unix timestamp in UTC. The second row is the sample rate expressed in Hz.
Specifically:
1. ACC.csv contains data from a 3-axis accelerometer sampled at 32Hz which is configured to measure accelerations in the
range of [-2g, 2g]. Acceleration is the rate of change of the velocity with respect to time, where SI (International System
of Units)31 derived unit for acceleration is the metre per second squared (m · s−2 ) where 1g is equal to 9.80665m · s−2 . The
unit in this file is 1/64g where the raw value of 64 indicates 1g. The 3 columns refer to the x, y, and z-axis, respectively.
2. BVP.csv contains Blood Volume Pulse (BVP) sampled at 64Hz which is the primary output from the photoplethysmograph
(PPG) sensor. BVP signals can be used to compute the inter-beat-intervals (IBI) and heart rate (HR)32 .
3. EDA.csv contains data from an electrodermal activity (EDA) sensor expressed as microsiemens (µS) sampled at 4Hz. The
variation of EDA values indicates the electrical changes of the skin surface and the EDA arises when the skin receives
nerve signals from the brain and sweat level increases33 .
4. HR.csv contains the average heart rate data extracted from the BVP signal, calculated in spans of 10 seconds. The first
row is the initial time of the session and it is 10 seconds after the beginning of the recording. The sampling rate of heart
rate is 1Hz.
5. IBI.csv contains the time intervals between a participant’s heartbeats extracted from the BVP signal. This file does not
have a sampling rate. The first column is the time (in respect to the starting time) of the detected inter-beat interval
expressed in seconds (s). The second column is the duration in seconds (s) of the detected inter-beat interval (i.e., the
distance in seconds from the previous beat).
6. TEMP.csv contains data from a temperature sensor expressed in degrees Celsius (◦C), sampled at 4Hz.
Class_wearable_data
The Class_wearable_data folder contains 221 sub-folders representing 221 different classes during which the wearable data
were recorded. Each sub-folder is named by the unique ’Class_id’ as shown in the Class_table.csv. Each sub-folder includes
further sub-folders named by the unique participant id or simply the label ’teacher’. These contain data from the wristband
sensors for each participant of this class. There are 6 CSV files in each sub-folder: ACC.csv, EDA.csv, BVP.csv, HR.csv, IBI.csv,
and TEMP.csv. The format of these files is identical to the ones in the Raw_wearable_data folder.
Technical Validation
Tables 5 and 6 show the specifications of the outdoor and indoor weather stations, respectively. Figure 2 shows a sample of
data captured from these sensors and the air-conditioning states that we inferred from the data. Figure 8 shows data captured
by the outdoor weather station; Figure 3 shows data captured by the indoor weather station. We were not able to find the
12/15accuracy of the Philio sensors in their datasheet, but assumed that it was sufficient for the purposes of our study. Figures 10
and 9 demonstrate a potential use case for the longitudinal dataset; here, we fitted different logistic regression models to the
air-conditioning usage data. Within the scope of our research, we were not able to validate these models. The figures serve
merely as an illustration of what the dataset may be used for.
Usage Notes
Our datasets include the outdoor/indoor/wearable sensing data and the self-report occupants’ thermal comfort, learning
engagement, and emotions while at school. This dataset is the first publicly available dataset for studying the daily behaviours
and engagement of high school students with heterogeneous sensing. For the longitudinal outdoor and indoor sensing data, the
most straightforward potential usage is to derive predictive models of how occupants operate room air-conditioning units34 .
Our dataset could potentially useful to examine the relationships between indoor/outdoor climates and physiological signals of
occupants, which provide opportunities for the future design of intelligent feedback systems to benefit both students and staffs
on campus.
Specifically, various data mining (e.g., segmentation35 , clustering36, 37 ) and modelling techniques38–40 could be applied to
build prediction models for measuring occupants’ mental state with the sensor-based physiological and behaviour recordings in
buildings. This could be further used for various applications, such as monitoring signs of frustration and disengagement20, 41 ,
proving better seating arrangements42 , improving teaching strategies by measuring the emotional climate in classrooms43 ,
ventilating the classrooms timely to prevent excessive carbon dioxide from affecting students’ concentration44–46 , providing a
thermally comfort environments for both students and staffs47 , etc.
Code Availability
Python code for prepossessing the data and implementing the segmentation based on different classes are available online
https://github.com/cruiseresearchgroup/InGauge-and-EnGage-Datasets.
References
1. Haldi, F. & Robinson, D. The impact of occupants’ behaviour on building energy demand. J. Build. Perform. Simul. 4,
323–338 (2011).
2. Rijal, H. B., Tuohy, P., Humphreys, M. A., Nicol, J. F. & Samuel, A. An algorithm to represent occupant use of windows
and fans including situation-specific motivations and constraints. In Building Simulation, vol. 4, 117–134 (Springer, 2011).
3. Schiavon, S. & Lee, K. H. Dynamic predictive clothing insulation models based on outdoor air and indoor operative
temperatures. Build. Environ. 59, 250–260 (2013).
4. Schweiker, M., Haldi, F., Shukuya, M. & Robinson, D. Verification of stochastic models of window opening behaviour for
residential buildings. J. Build. Perform. Simul. 5, 55–74 (2012).
5. Langevin, J., Gurian, P. L. & Wen, J. Tracking the human-building interaction: A longitudinal field study of occupant
behavior in air-conditioned offices. J. Environ. Psychol. 42, 94–115 (2015).
6. Reinhart, C. F. & Voss, K. Monitoring manual control of electric lighting and blinds. Light. research & technology 35,
243–258 (2003).
7. Cheung, T., Schiavon, S., Parkinson, T., Li, P. & Brager, G. Analysis of the accuracy on pmv–ppd model using the ashrae
global thermal comfort database ii. Build. Environ. 153, 205–217 (2019).
8. Kim, J. & de Dear, R. Thermal comfort expectations and adaptive behavioural characteristics of primary and secondary
school students. Build. Environ. 127, 13–22 (2018).
9. Healey, J. A. & Picard, R. W. Detecting stress during real-world driving tasks using physiological sensors. IEEE
Transactions on intelligent transportation systems 6, 156–166 (2005).
10. Koelstra, S. et al. Deap: A database for emotion analysis; using physiological signals. IEEE transactions on affective
computing 3, 18–31 (2011).
11. Schneegass, S., Pfleging, B., Broy, N., Heinrich, F. & Schmidt, A. A data set of real world driving to assess driver workload.
In Proceedings of the 5th international conference on automotive user interfaces and interactive vehicular applications,
150–157 (2013).
12. Wang, R. et al. Studentlife: assessing mental health, academic performance and behavioral trends of college students using
smartphones. In Proceedings of the 2014 ACM international joint conference on pervasive and ubiquitous computing,
3–14 (2014).
13/1513. Abadi, M. K. et al. Decaf: Meg-based multimodal database for decoding affective physiological responses. IEEE
Transactions on Affect. Comput. 6, 209–222 (2015).
14. Birjandtalab, J., Cogan, D., Pouyan, M. B. & Nourani, M. A non-eeg biosignals dataset for assessment and visualization of
neurological status. In 2016 IEEE International Workshop on Signal Processing Systems (SiPS), 110–114 (IEEE, 2016).
15. Subramanian, R. et al. Ascertain: Emotion and personality recognition using commercial sensors. IEEE Transactions on
Affect. Comput. 9, 147–160 (2016).
16. Gjoreski, M., Luštrek, M., Gams, M. & Gjoreski, H. Monitoring stress with a wrist device using context. J. biomedical
informatics 73, 159–170 (2017).
17. Schmidt, P., Reiss, A., Duerichen, R., Marberger, C. & Van Laerhoven, K. Introducing wesad, a multimodal dataset for
wearable stress and affect detection. In Proceedings of the 20th ACM international conference on multimodal interaction,
400–408 (2018).
18. Gjoreski, M. et al. Datasets for cognitive load inference using wearable sensors and psychological traits. Appl. Sci. 10,
3843 (2020).
19. Park, C. Y. et al. K-emocon, a multimodal sensor dataset for continuous emotion recognition in naturalistic conversations.
Sci. Data 7, 1–16 (2020).
20. Gao, N., Shao, W., Rahaman, M. S. & Salim, F. D. n-gage: Predicting in-class emotional, behavioural and cognitive
engagement in the wild. Proc. ACM on Interactive, Mobile, Wearable Ubiquitous Technol. 4, 1–26 (2020).
21. Di Lascio, E., Gashi, S. & Santini, S. Unobtrusive assessment of students’ emotional engagement during lectures using
electrodermal activity sensors. Proc. ACM on Interactive, Mobile, Wearable Ubiquitous Technol. 2, 1–21 (2018).
22. Bakker, J., Pechenizkiy, M. & Sidorova, N. What’s your current stress level? detection of stress patterns from gsr sensor
data. In 2011 IEEE 11th international conference on data mining workshops, 573–580 (IEEE, 2011).
23. Sarchiapone, M. et al. The association between electrodermal activity (eda), depression and suicidal behaviour: A
systematic review and narrative synthesis. BMC psychiatry 18, 1–27 (2018).
24. Michael, P. R., Johnston, D. E. & Moreno, W. A conversion guide: solar irradiance and lux illuminance. J. Meas. Eng. 8,
153–166 (2020).
25. Garbarino, M., Lai, M., Bender, D., Picard, R. W. & Tognetti, S. Empatica e3—a wearable wireless multi-sensor device
for real-time computerized biofeedback and data acquisition. In 2014 4th International Conference on Wireless Mobile
Communication and Healthcare-Transforming Healthcare Through Innovations in Mobile and Wireless Technologies
(MOBIHEALTH), 39–42 (IEEE, 2014).
26. Gao, N., Shao, W. & Salim, F. D. Predicting personality traits from physical activity intensity. Computer 52, 47–56 (2019).
27. Handbook-Fundamentals, A. American society of heating. Refrig. Air-Conditioning Eng. (2009).
28. Fuller, K. A. et al. Development of a self-report instrument for measuring in-class student engagement reveals that
pretending to engage is a significant unrecognized problem. PloS one 13, e0205828 (2018).
29. Pollak, J. P., Adams, P. & Gay, G. Pam: a photographic affect meter for frequent, in situ measurement of affect. In
Proceedings of the SIGCHI conference on Human factors in computing systems, 725–734 (2011).
30. Gao, N., Marschall, M., Burry, J., Watkins, S. & Salim, F. In-gauge and en-gage datasets. figshare https://doi.org/10.25439/
rmt.14578908, 10.25439/rmt.14578908 (2021).
31. of Weights, I. B., Measures, Taylor, B. N. & Thompson, A. The international system of units (SI) (US Department of
Commerce, Technology Administration, National Institute of . . . , 2001).
32. E4 data - bvp expected signal.
33. Braithwaite, J. J., Watson, D. G., Jones, R. & Rowe, M. A guide for analysing electrodermal activity (eda) & skin
conductance responses (scrs) for psychological experiments. Psychophysiology 49, 1017–1034 (2013).
34. Schwee, J. H. et al. Room-level occupant counts and environmental quality from heterogeneous sensing modalities in a
smart building. Sci. data 6, 1–11 (2019).
35. Deldari, S., Smith, D. V., Sadri, A. & Salim, F. Espresso: Entropy and shape aware time-series segmentation for processing
heterogeneous sensor data. Proc. ACM on Interactive, Mobile, Wearable Ubiquitous Technol. 4, 1–24 (2020).
36. Shao, W., Salim, F. D., Song, A. & Bouguettaya, A. Clustering big spatiotemporal-interval data. IEEE Transactions on Big
Data 2, 190–203 (2016).
14/1537. Shao, W. et al. Onlineairtrajclus: An online aircraft trajectory clustering for tarmac situation awareness. In 2019 IEEE
International Conference on Pervasive Computing and Communications (PerCom, 192–201 (IEEE, 2019).
38. Salim, F. D. et al. Modelling urban-scale occupant behaviour, mobility, and energy in buildings: A survey. Build. Environ.
183, 106964 (2020).
39. Carlucci, S. et al. Modeling occupant behavior in buildings. Build. Environ. 174, 106768 (2020).
40. Kjærgaard, M. B. et al. Current practices and infrastructure for open data based research on occupant-centric design and
operation of buildings. Build. Environ. 177, 106848 (2020).
41. Rahaman, M. S. et al. An ambient–physical system to infer concentration in open-plan workplace. IEEE Internet Things J.
7, 11576–11586 (2020).
42. Rahaman, M. S., Kudo, S., Rawling, T., Ren, Y. & Salim, F. D. Seating preference analysis for hybrid workplaces. arXiv
preprint arXiv:2007.15807 (2020).
43. Gashi, S., Di Lascio, E. & Santini, S. Using students’ physiological synchrony to quantify the classroom emotional climate.
In Proceedings of the 2018 ACM International Joint Conference and 2018 International Symposium on Pervasive and
Ubiquitous Computing and Wearable Computers, 698–701 (2018).
44. Arief-Ang, I. B., Salim, F. D. & Hamilton, M. Da-hoc: semi-supervised domain adaptation for room occupancy prediction
using co2 sensor data. In Proceedings of the 4th ACM International Conference on Systems for Energy-Efficient Built
Environments, 1–10 (2017).
45. Arief-Ang, I. B., Hamilton, M. & Salim, F. D. Rup: Large room utilisation prediction with carbon dioxide sensor. Pervasive
Mob. Comput. 46, 49–72 (2018).
46. Arief-Ang, I. B., Hamilton, M. & Salim, F. D. A scalable room occupancy prediction with transferable time series
decomposition of co2 sensor data. ACM Transactions on Sens. Networks (TOSN) 14, 1–28 (2018).
47. Gao, N. et al. Transfer learning for thermal comfort prediction in multiple cities. Build. Environ. 195, 107725 (2021).
Acknowledgements
This research is supported by the Australian Government through the Australian Research Council’s Linkage Projects funding
scheme (project LP150100246). This paper is also a contribution to the IEA EBC Annex 79.
Author contributions statement
N.G. designed, prepared, and conducted the cross-sectional study for wearable data collection, analysed the wearable and indoor
sensor data, and wrote the manuscript. M.M. designed, prepared and conducted the longitudinal data collection for outdoor and
indoor sensing, and processed the dataset and wrote the manuscript. J.B, S.W., and F.D.S supervised the data collection, dataset
design, and revised the manuscript. F.D.S advised N.G on the overall project and data analysis and modelling.
Competing interests
The authors declare no competing interests.
15/15You can also read