UNEQUAL PORTIONS Ending malnutrition for every last child

Page created by Marshall Torres
 
CONTINUE READING
UNEQUAL PORTIONS Ending malnutrition for every last child
UNEQUAL PORTIONS

Ending malnutrition for every last child
UNEQUAL PORTIONS Ending malnutrition for every last child
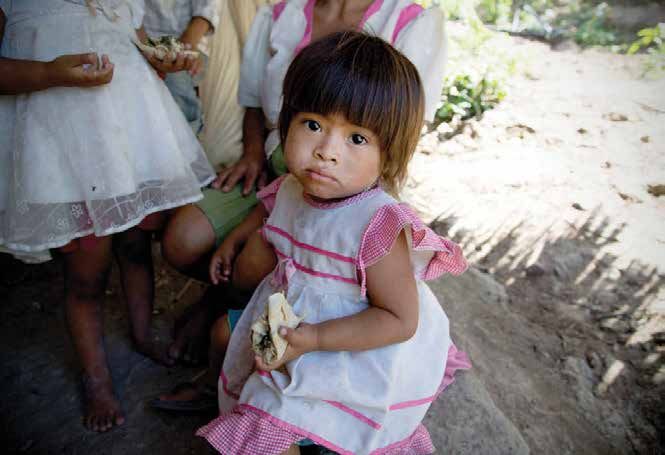
Every child has the right to a future. Save the Children
works in the UK and around the world to give children
a healthy start in life, the chance to learn and be safe.
We do whatever it takes to get children the things
they need – every day and in times of crisis.

Acknowledgements
This report is co-authored by Marie Rumsby and Katherine Richards. The new research has been
developed by José Manuel Roche, Dimitri Gugushvili and Alexis Le Nestour.
Considerable recognition must be given to the following people from across the Save the Children
movement for their substantial contributions: Phoebe Corrigan, Róisín Hinds, Fran Roberts,
Frances Mason, Sam Kennedy, Hugh Bagnall-Oakley, Joana Alfaiate, Amanda Lenhardt, Sylvia
Szabo, Giorgiana Rosa, Andrew Wainer, Nicola Hypher, Davina Jeffery, Assumpta Ndumi,
Lilly Schofield, Vanessa Self, Kjersti Koffeld, Cara Flowers, Mihir Mankad, Leah Finnegan,
George Graham and Mark Buttle.
We are delighted to include country examples, which are produced thanks to the inputs and
collaboration of colleagues across the Save the Children movement, including: John Kabongo,
Caroline Nenguke, Jorge Freyre, Michel Anglade, Angela Muriuki, Regina Mbochi, Hassan
Abdille, Beatrice Otieno, Solomon Bahiru, Olayinka Adekugbe, Matthew Tasker, Andrea
Menefee, Tatak Ujiyat, Pallavi Dhakal, Peter Oyloe, Bindu Gautam, Alice Atkins, Ramatu Jalloh,
Tahrim Chaudhury, Taskin Rahman, Ngo Thi Ngoc Chau, Inna Sacci, Abigail Beeson, Mot Sana,
Chamindri Katuwawala, Victoria Ward, Maritza Lily Lovo, Edith Rivera, Elizabeth Bocaletti,
Beat Rohr, Rodríguez Solís, Blanca Xmucané and Jorge Rios.
We are grateful to colleagues across the Save the Children movement for their comments and
suggestions, including: Richard Morgan, Jonathan Glennie, Annabel Fenn, Stephanie Bellack,
Julia Schilling, Smita Baruah, Karin Lapping, Catharina Bu and Alice Faye.
We would also like to thank our external reviewers for their very helpful guidance: Robert
Chambers, Institute of Development Studies; Tanya Khara, DFID; Margret Vidar, Right to Food
Unit, FAO.
We are grateful to Wenche Barth Eide and Asbjørn Eide for their valuable suggestions in the
earlier stages of this report’s development, and to Manuel Silva Santos and Marcello Perez of
Göttingen University and Anthrologica for their research contributions.

Some children’s names have been changed to protect identities.

Published by
Save the Children
1 St John’s Lane
London EC1M 4AR
UK
+44 (0)20 7012 6400
savethechildren.org.uk

First published 2016

© The Save the Children Fund 2016

The Save the Children Fund is a charity registered in England and Wales (213890) and
Scotland (SC039570). Registered Company No. 178159

This publication is copyright, but may be reproduced by any method without fee or prior
permission for teaching purposes, but not for resale. For copying in any other circumstances,
prior written permission must be obtained from the publisher, and a fee may be payable.

Cover: Marta, age nine, and Blanca, one, often go hungry. Their father has been out of work
since a plague of coffee rust destroyed coffee crops across Guatemala. (Photo: Ivy Lahon/
Save the Children)

Typeset by Grasshopper Design Company
UNEQUAL PORTIONS Ending malnutrition for every last child
Contents

Executive summary                                                                  v

The story in numbers                                                             viii

Overview of the report                                                             x

Key terms                                                                         xi

1 Introduction                                                                     1
    Why does exclusion matter?                                                     1
    Why must we address malnutrition?                                              1
    New findings and background research                                           2

2 Who are the malnourished children, where do they live,
  and why must we address exclusion to reach them?                                 3
    The global picture of malnutrition: some progress but too slow and unequal    3
    How are countries progressing in addressing malnutrition?                     5
    Which countries have done well in addressing malnutrition?                    5
    Which countries have struggled?                                               6
    How do inequality and exclusion impact malnutrition?                          7
    The lottery of childhood: country regions and urban and rural areas           8
    Unequal chances of malnutrition for the poor and rich                        11
    Children from excluded groups are at risk of being left behind               18
    Projections are a cause for concern                                          19

3 Why are children malnourished?                                                 24
    Why are some people vulnerable to malnutrition?                              26
    Poverty and income                                                           30
    Regional disadvantage                                                        31
    Gender                                                                       33
    Malnutrition from mother to child                                            34
    Disability                                                                   36
    Refugees, children on the move and children in conflict                      37
    Ethnicity                                                                    38
    National and global drivers of malnutrition                                  39

4 How to address malnutrition inclusively                                        44
 Nutrition commitments – are they inclusive?                                     44
 How to take an inclusive approach                                               46
		 4.1 The child: addressing the immediate drivers of malnutrition               46
UNEQUAL PORTIONS Ending malnutrition for every last child
4.2 The household: addressing the underlying drivers of malnutrition                            47
UNEQUAL PORTIONS

                   		 4.3 At national and global levels: basic structural and institutional drivers of malnutrition   55
                   		 4.4 Design principles for an inclusive approach                                                 59

                   5 Conclusions and recommendations for world leaders                                                60
                       1. Overcome exclusion through appropriate laws, policies and investment                        60
                       2. Break the intergenerational cycle of malnutrition – focus on mothers and adolescent girls   61
                       3. Address the large-scale drivers of malnutrition                                             62
                       4. Take a ‘leave no one behind’ approach – an appropriate policy and programme response
                       based on the national context                                                                  63
                       Save the Children’s steps for a Decade of Action on nutrition – starting at the second
                       Nutrition for Growth event                                                                     64

                   Appendices                                                                                         65
                       Appendix 1: Methodological note                                                                65
                       Appendix 2: Methodology to project SDG target 2.2 on ending all forms of malnutrition          67
                       Appendix 3: International human rights and the role of the state                               69

                   Endnotes                                                                                           70

    iv
UNEQUAL PORTIONS Ending malnutrition for every last child
Executive summary

Good nutrition – a healthy, balanced,                     MALNUTRITION – PROGRESS
adequate diet – is a matter of life or death.             AND PROSPECTS
And the difference between surviving
or thriving.                                              The world has made progress in addressing
                                                          undernutrition. The number of children with
It is essential for a healthy immune system,              stunted growth has fallen by more than a third
to protect against disease throughout life.               since 1990.
And it’s crucial for a country’s inclusive and
                                                          But progress has not been fast enough. Every
sustainable development.
                                                          year, 3.1 million children die because of undernutrition.
But progress in tackling malnutrition is far too slow.    Malnutrition is a daily global emergency. In the world
Millions of children are missing out on adequate          today, nearly a quarter of all children under five –
nutrition because of who they are and where they          159 million children – are stunted.1 A lack of food,
live. They are discriminated against because of their     poor health or unsanitary environments mean these
ethnicity or disability; they are excluded because of     children are not benefiting from the nutrients they
their parents’ lack of income or after being forced       need to develop to their full potential.
from their homes.
                                                          Without a dramatically different approach
This report tells the story of these forgotten            the world won’t meet its nutrition goals. The
children. And it sets out what is required to ensure      world has pledged to reduce stunting by 40% by
every last child gets the nutrition they need. If we      2025 and eliminate all forms of malnutrition by
are serious about creating a world where no child         2030. But if we carry on as we are, that simply won’t
is malnourished, we must tackle the discrimination        happen. Unless the world dramatically changes
and exclusion they face.                                  course, malnutrition is here to stay.
Save the Children has launched a new campaign to          While a reduction of 30 million over 16 years in the
help ensure that every last child survives and thrives.   number of malnourished children2 signifies some
We will work directly with excluded children, coming      progress, it is unacceptably slow. By 2030 there
up with innovative solutions and delivering world         will still be 129 million stunted children.
class programmes. We will advocate for increased          Low-income countries will account for more than
resources for nutrition. We will challenge the laws,      a quarter of this global burden.
norms and policies that have allowed malnutrition
                                                          What’s more, even at the turn of the next century –
and discrimination to persist. And we will campaign
                                                          70 years after the deadline to end malnutrition –
with and for the world’s forgotten children.
                                                          we are still likely to see 24 million children with
The need for action has never been more pressing.         stunted growth. Without a concerted change, the
Our new research shows that, despite a global             world is set to live through another century of
commitment to eradicate malnutrition by 2030,             wasted potential, damaging children’s education,
on current trends there will be 129 million children      life chances, income and productivity – and with
under five with stunted growth worldwide by that          serious consequences for the global economy.
date. And even in 100 years from now, without a
                                                          At the same time, the number of overweight
dramatic change of course there will still be millions
                                                          children is increasing. There are 41 million
of malnourished children in the world.
                                                          overweight under-fives in the world today –
                                                          10 million more than two decades ago.3 This is a

                                                                                                                      v
UNEQUAL PORTIONS Ending malnutrition for every last child
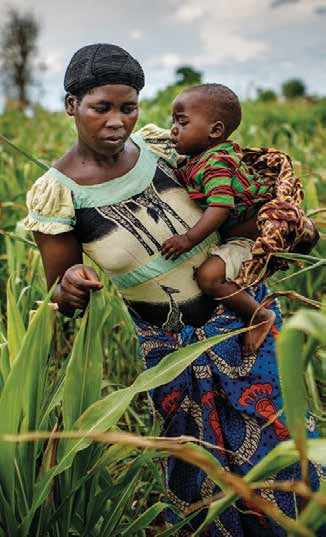
worrying trend, which will lead to greater morbidity      children living in rural areas are 1.37 times more
UNEQUAL PORTIONS

                   and mortality, and will have significant implications     likely to be stunted than children living in urban
                   for the global economy. Yet it’s a trend that could       areas. 5 In reality, these global averages mask even
                   and should be reversed.                                   greater inequalities between rural and urban areas.
                                                                             Family income has a significant influence over a
                                                                             child’s nutrition. So it comes as no surprise that the
                   HOW EQUAL HAS PROGRESS BEEN?
                                                                             poorest fifth of children have considerably higher
                   There are stark differences in malnutrition               stunting and wasting rates than the richest fifth.
                   rates between countries. In 44 developing                 Across developing countries and regions, young
                   countries – out of a total of 115 with available data –   children in the poorest 20% of families are more
                   30% or more of children suffer from stunted growth.       than twice as likely to die before their fifth birthday
                   In three of these countries – Burundi, Eritrea and        as children from families in the wealthiest fifth of
                   Timor-Leste – over half of children are stunted, and      the population.6
                   in 13 countries the problem has actually got worse        Exacerbating the problem of global malnutrition
                   since 2000.                                               is the strongest ever recorded El Niño, bringing
                   Within most developing countries it is                    drought to 15 countries and affecting more than
                   predicted that it will take much longer to                60 million people. Violence and persecution have
                   eliminate malnutrition in excluded groups of              also fuelled the worst refugee crisis since the second
                   children than among the best-performing groups            world war, forcing people from their homes and
                   or in the rest of the country – a continuation of the     making it more difficult for them to get the basic
                   unequal progress that the world has experienced           essentials they need to survive.
                   since 1990.4                                              So while there has never been greater worldwide
                   We know progress is possible. But progress                commitment to tackling malnutrition – with
                   on nutrition has often failed to include all              57 countries signing up to the Scaling Up Nutrition
                   children. Ghana, Peru and the Republic of Congo           movement 7 and a global goal agreed to end all
                   have seen a significant reduction in stunting in          forms of malnutrition by 2030 – these global trends
                   recent years. However, with the exception of rural        make the problem increasingly pressing.
                   areas in Ghana, disadvantaged groups in these
                   countries have lagged behind the more advantaged
                   ones, leading to an increasing gap between the            HOW IS EXCLUSION CONTRIBUTING
                   two. Peru, in particular, has growing inequalities in     TO MALNUTRITION?
                   stunting rates between regions, between rural and
                   urban areas and between ethnic groups.                    The drivers of malnutrition are well known. They
                                                                             include a child’s dietary intake and health, household
                                                                             food security, care practices, the broader health
                   WHY ARE SOME PEOPLE MORE                                  environment in which people live, poverty, the
                                                                             political context and environmental factors such as
                   VULNERABLE TO MALNUTRITION
                                                                             climate change.
                   THAN OTHERS?
                                                                             These drivers can intersect and overlap,
                   Discrimination and exclusion are helping                  exacerbating the exclusion of certain groups of
                   to create these inequalities. Where a child               children. For example, children living in remote
                   lives largely determines their access to services,        areas may not have access to healthcare. Disabled
                   education and food, their cultural and social             children living in these areas may be even less able
                   practices, their family’s income – and ultimately their   to get the services they need – particularly if they
                   nutrition levels. Our data shows that, on average,        require specialist care.

   vi
UNEQUAL PORTIONS Ending malnutrition for every last child
HOW TO ACCELERATE PROGRESS                                Policies that can contribute to inclusively addressing

                                                                                                                    EXECUTIVE SUMMARY
FOR ALL                                                   malnutrition through a multi-sectoral approach
                                                          include child-sensitive social protection; universal
States have a binding obligation, enshrined in            health coverage; improved water, sanitation and
international law, to respect, protect and realise        hygiene; education and building resilience; and
children’s right to survival. The UN Convention           enhancing food security and livelihoods.
on the Rights of the Child obliges states to do           A decade of action is required to end
everything they can to prevent children from dying.       malnutrition.11 The second Nutrition for Growth
To meet this commitment, states need to tackle            event marks the moment to prioritise and invest to
malnutrition. Yet, many countries lack a legal            end malnutrition for every last child.
framework that promotes child survival, and those
that do often fail to implement it.8                      Save the Children recommends that
                                                          governments:
Governments have signed up to numerous global
nutrition targets. While welcome, these goals are         1. Undertake a multi-sectoral contextual analysis
often the result of political negotiations rather            to understand:
than calculations based on trends in nutrition and           • the national drivers of and trends in
the context in which countries are operating. It                malnutrition
is therefore not surprising that the world is not            • which policies and practices will best address
on track to meet any of the six World Health                    malnutrition
Assembly nutrition targets. If we want to see real           • which groups of people are most marginalised
and equitable progress, these global goals must                 and vulnerable to malnutrition and the
be translated into national targets, with                       barriers they face.
adequate resources and plans that lay out                 2. Set national nutrition targets, aligned to global
how each country will reach its goals for                    goals, which include specific targets for all groups
all groups of society.                                       of society, based on national contexts and trends.
Economic growth can contribute to improved                3. Put in place appropriate policies and plans to
nutrition, and in low-income countries it is seen as an      reach those targets, for all groups of society.
essential weapon in the fight against malnutrition.9         This should form the basis of a ‘leave no one
However, there is a complex relationship between             behind strategy’ – ensuring malnutrition is
economic growth and nutrition, and growth alone              reduced across all groups of society.
is not sufficient to tackle malnutrition. Policies that
take account of the specific country context are          4. Work with relevant sectors and stakeholders
also essential – necessitating a national contextual         – including donors, academics, civil society and
analysis to understand both the immediate and                business – throughout the planning and policy
underlying causes of malnutrition and how to                 process on tackling malnutrition, from contextual
overcome them.                                               analysis, design of strategies and policies, to
                                                             implementation, monitoring and evaluation.
Commitments to address malnutrition should begin
with the moral and legal imperative for the right         5. Ensure appropriate finances are in place. Every
to food and nutrition for all. Countries that have           government should invest in the nutrition of
legally recognised the right to food tend to be more         their people. In addition, donors should prioritise
likely to implement programmes tackling child                nutrition as both a maker and a marker of
nutrition.10 The values of empowerment, equity,              sustainable development.
universality and accountability should also be at the
centre of efforts to reduce malnutrition.

                                                                                                                    vii
UNEQUAL PORTIONS Ending malnutrition for every last child
The story in numbers

       If we continue as we are…

         there will be 129   million stunted children in the world in 2030

         there will be 24   million stunted children in the world at the start of
         the next century

         75 out of 114 countries will fail to reduce stunting by 40% by 2025

         only three more countries will eradicate stunting between now and 2030

         in most countries it is projected to take much longer for excluded groups
         to reach the targets than the countries as a whole or the best-performing groups.

       Today there are…

         159 million stunted children in the world – 24% of all children

         50 million children too thin for their height (wasted)

         more obese than underweight adults in the world – for the first time
         in human history

         more than 1.9 billion adults – nearly 30% of the global population –
         overweight or obese.

viii
UNEQUAL PORTIONS Ending malnutrition for every last child
There has been some progress, but it has not been

                                                                                  THE STORY IN NUMBERS
fast enough or equal enough…

  100 out of the 115 countries for which we have data on the changes
  in stunting over time have reduced stunting

  The prevalence of wasting has increased in far more countries than stunting.
  Of 113 countries, we found that in 38 it has worsened

  No low-income countries feature on the list of the top 10 countries that have
  reduced stunting the fastest

  Children living in rural areas are 1.37 times more likely to be stunted
  than children living in urban areas (across 56 countries with relevant data)

  The poorest 20% of children are 2.26 times more likely to be stunted
  than the richest (across 56 countries with relevant data)

  Ethnic groups with the worst wasting rates are six times more likely
  to be wasted than ethnic groups with the best rates.

                                                                                     ix
UNEQUAL PORTIONS Ending malnutrition for every last child
Overview of the report

    In this report we will look at how groups of children are excluded
    from progress on malnutrition based on their gender, ethnicity,
    regional differences within countries, disability, which economic group
    they fall into or because they are on the move.
    In part 1 we introduce the approach, methodology and new research.
    In part 2 we look at the problem – which countries and which groups
    of children are furthest behind in nutrition outcomes – and why this
    exclusion must be addressed.
    In part 3 we explore the drivers that make some people vulnerable
    to malnutrition, and we look at how international commitments have
    attempted to promote inclusive progress to date.
    In part 4 we suggest how governments can overcome the burden
    of malnutrition in an inclusive and sustainable way. We show that
    economic growth alone is not enough – the right policies need to be
    in place.
    In part 5 we make recommendations and calls for world leaders to
    address the drivers of malnutrition and exclusion.

    This report is part of Save the Children’s Every Last Child campaign
    to tackle exclusion in a new era of development.

x
Key terms

1,000-day window                                         Overweight and obesity
The 1,000-day period is the time between                 The terms overweight and obesity refer to when a
conception and a child’s second birthday. The            person is too heavy for his/her height. That person
right nutrition during this critical period can have     may be defined as having abnormal or excessive fat
a profound impact on a child’s ability to develop        accumulation that may impair health. Body mass
mentally and physically, to learn and to rise out        index (BMI) is a simple index of weight-for-height
of poverty. It can also shape a society’s long-term      that is commonly used to classify overweight
health, stability and prosperity.1                       and obesity in adults. A BMI greater than or
                                                         equal to 25 is overweight. A BMI greater than
Hunger                                                   or equal to 30 is obesity. 5 This form of malnutrition
Hunger is the body’s way of signalling that it is        results from expending too few calories for the
running short of food and needs to eat something.        amount consumed, and increases the risk of
Sustained hunger can lead to undernutrition,             non-communicable disease later in life.6
although it is only one of many causes; others
include diarrhoea, malaria and HIV and AIDS.2            Stunting
                                                         Stunting refers to a child who is too short for his
Malnutrition                                             or her age. Stunting is the failure to grow both
Malnutrition is a broad term commonly used as            physically and cognitively and is the result of chronic
an alternative to undernutrition, but technically it     or recurrent malnutrition. The effects of stunting
also refers to overweight and obesity. People are        often last a lifetime.7
malnourished if their diet does not provide adequate
calories and protein for growth and maintenance,         Wasting
or if they are unable to fully utilise the food they     Wasting refers to a child who is too thin for his or
eat due to illness (undernutrition). They are also       her height. Wasting is the result of sudden or acute
malnourished if they consume too many calories3          malnutrition, where the child is not getting enough
compared to how many they expend. Good                   calories from food and faces an immediate risk
nutrition is when the right balance of nutrients         of death.8
enter, leave and are absorbed by the body.

Undernutrition
Undernutrition is defined as the outcome of
insufficient food intake and repeated infectious
diseases. It includes being underweight for one’s age,
too short for one’s age (stunted), dangerously thin
for one’s height (wasted), and deficient in vitamins
and minerals (micronutrient malnutrition).4

                                                                                                                   xi
PHOTO: CJ CLARKE/SAVE THE CHILDREN

      Selim, 12, left his home in Bangladesh when his brother beat him and now lives on the streets.

xii
1 Introduction

The world has made progress in addressing                self-identify in another way; what their culture is;
undernutrition. The number of children who               whether they have a disability; or whether they are
are stunted has fallen by more than a third              rich or poor. No child should be treated unfairly or
since 1990. But progress has not been fast               discriminated against on any basis.6
enough or inclusive enough.
The world is currently off track to meet its nutrition   WHY MUST WE ADDRESS
targets, including all six of those set at the 2012      MALNUTRITION?
World Health Assembly 1 (WHA) – which seek
improvements in stunting, anaemia, wasting,              Adequate nutrition is a case of life or death. It is a
low birth weight, childhood overweight and               case of surviving or thriving. Adequate nutrition is
breastfeeding by 2025; and the recently agreed           essential for a healthy immune system, to help protect
Sustainable Development Goals (SDGs) – which             against disease throughout life. A well-nourished
strive to end all forms of malnutrition by 2030.2        and productive population is the difference between
                                                         a country’s economy developing or stagnating.
Discrimination – whether intentional or not – means
                                                         Understanding the drivers of malnutrition and how
that progress has not been spread equally among
                                                         to ensure every child receives and is able to absorb
all children. Some groups of children are being
                                                         the nutrients they need is crucial for inclusive and
excluded, leaving them particularly vulnerable to
                                                         sustainable development everywhere.
malnutrition and the impact this has on their lives.
                                                         The moral imperative for addressing malnutrition
                                                         is well recognised. In fact, the very existence of
WHY DOES EXCLUSION MATTER?                               malnutrition can be presumed to be a violation of
                                                         the human right to food.7 Nutrition is a precondition
Exclusion is a clear violation of children’s rights.     for sustainable, social, economic and human
Discrimination – treating a person differently           development, as set out in the United Nations
because of who they are or where they are – stops        Charter, the Universal Declaration of Human
millions of children getting the food, healthcare        Rights, and subsequent international human rights
and education they need, leaving them vulnerable         conventions including the CRC.8
to malnutrition and its impacts. The impact of
exclusion on children can be severe, long-lasting and    Malnutrition has severe, long-term human and
wide-ranging, particularly so because of children’s      economic consequences. Ensuring the right
vulnerability and because childhood is such a critical   nutrients are received and absorbed during those
developmental period for nutrition.3                     first 1,000 days of life – between conception and a
                                                         child’s second birthday – can help shape a child’s –
All of the major international human rights              and wider society’s – long-term health, stability and
instruments explicitly protect rights of all groups.4    prosperity.9 Nutrients provide the biological building
The principle of equality and non-discrimination is      blocks for our organs, including the structural
at the heart of children’s rights. 5 The Convention      and functional development of the brain.10 45% of
on the Rights of the Child (CRC), for example,           deaths of children under the age of five are linked
applies to all children, whatever their race, religion   to malnutrition.11 The effects of malnutrition on
or abilities; whatever they think or say; whatever       physical stature, cognitive development, immune
type of family they come from. It does not matter        systems and the ability to do physical work can
where children live; what language they speak; what      lock children into poverty and entrench inequality.
their parents do; whether they are boys or girls or

                                                                                                                  1
Children who are poor and malnourished earn           PROJECTIONS BY 2025, 2030 AND BEYOND
UNEQUAL PORTIONS

                   20% less as adults than children who are              In collaboration with researchers from Göttingen
                   well nourished.12                                     University, we produced a series of projections
                   With a long-term impact on productivity, in some      at national level and for all social and economic
                   countries hunger and undernutrition can cost the      groups inside each country. We estimate what the
                   economy 10% of gross domestic product (GDP),13        stunting rates will be if countries continue ‘business
                   and costs the world up to US$2.1 trillion in lost     as usual’ by landmark moments: by 2025, to reach
                   global GDP.14 An investment in nutrition is a smart   the World Health Assembly target of reducing
                   investment – with a median return on investment       malnutrition by 40%; by 2030, to reach the nutrition
                   of US$16 for every US$1.15                            Sustainable Development Goal target of eliminating
                                                                         malnutrition; and project further into the future to
                                                                         estimate how long it would take for those countries
                   NEW FINDINGS AND                                      that are set to miss the target to achieve it. One
                                                                         important innovation in our projections is to move
                   BACKGROUND RESEARCH
                                                                         beyond national averages. We disaggregate
                   Conducting a global analysis on progress in           national projections for social and economic groups
                   eradicating malnutrition, where that analysis aims    inside each country to assess which groups are at
                   to look beyond national averages and intends to       risk of being left behind by progress.
                   focus on excluded groups of children, presents
                   numerous data challenges. We have made                CASE STUDIES
                   substantial efforts to compile existing statistics    This report also includes detail from 14 case studies
                   and produce additional data, in order to provide      developed by Save the Children to illustrate various
                   a global diagnostic of exclusion and to analyse       aspects of the report. These case studies highlight
                   inequalities in life chances between social and       practical ways to inclusively address malnutrition
                   economic groups.                                      by drawing from programme and beneficiary
                                                                         experience. They highlight learnings gained through
                   The evidence and findings presented in this report
                                                                         working in a number of countries with excluded
                   draw on the following research inputs (please see
                                                                         groups and communities. This report includes
                   appendix 1 for more detail):
                                                                         detail from case studies from Kenya, Nigeria,
                                                                         Zambia, Myanmar, Indonesia, Nepal, Cambodia,
                   THE GROUPS-BASED INEQUALITY DATABASE
                                                                         Sri Lanka, Bangladesh, Vietnam, Sierra Leone,
                   (GRID)
                                                                         Brazil, Guatemala and Honduras.
                   In this report we use available data on ethnicity,
                   sub-national regions, urban/rural areas and
                   economic groups from GRID, developed by
                   Save the Children in collaboration with the
                   Overseas Development Institute. GRID is based
                   on direct data processing of Demographic Health
                   Surveys (DHS) and Multiple Indicator Cluster
                   Surveys (MICS), and various aggregated public
                   sources (the UN Inter-agency Group for Child
                   Mortality Estimation, World Health Organization
                   (WHO), UNICEF, World Bank and the World
                   Inequality Database on Education).

   2
2 Who are the malnourished children,
  where do they live, and why must we
  address exclusion to reach them?

In this chapter we present the global picture                                      The distribution of the stunting burden across the
of malnutrition. We explore which countries                                        world’s regions is highly uneven. Half of the world’s
have done well in addressing malnutrition,                                         children aged under five live in sub-Saharan Africa
and which have struggled. We then look at                                          and South Asia, but these children account for 80%
trends in inequalities of nutrition outcomes                                       of all stunted children in the world.2
within groups of children, and present some                                        With the exception of sub-Saharan Africa, each
estimations projecting the current trends                                          region of the world has seen a reduction in the
into the future.                                                                   absolute number of stunted children since 1990.
                                                                                   The greatest reduction happened in East Asia where
                                                                                   the number of stunted children decreased from
THE GLOBAL PICTURE OF                                                              80 million to 16 million (Figure 2). In sub-Saharan
                                                                                   Africa the proportion of stunted children is reducing,
MALNUTRITION: SOME PROGRESS                                                        but at a slower rate than population growth. As
BUT TOO SLOW AND UNEQUAL                                                           a result, the total absolute number of stunted
                                                                                   children in sub-Saharan Africa has increased from
In 1990 there were 255 million children with stunted
                                                                                   43.5 million to 55 million (Figure 3).
growth in the world – representing 40% of all
children. The situation has improved since then,                                   Progress shows it is possible to address malnutrition
with an estimated 159 million stunted children in the                              successfully. In fact, a number of countries have
world in 2014 – 24% of all children (see Figure 1).1                               shown impressive progress towards their nutrition

  FIGURE 1 CHANGE IN THE PREVALENCE AND NUMBER OF STUNTED CHILDREN GLOBALLY
                                                 350
                                                                                                        50
                                                 300
        Number of affected children (millions)

                                                                                                        45
                                                 250

                                                                                                        40
                                                                                                             Prevalence (%)

                                                 200

                                                                                                        35
                                                 150

                                                                                                        30
                                                 100

                                                  50                                                    25
                                                                                                                              Number of
                                                                                                                              affected children

                                                   0                                                    20                    Prevalence
                                                       1990   1995   2000   2005     2010       2014

Source: UNICEF, WHO, World Bank Group, 2015. Levels and trends in child malnutrition.

                                                                                                                                                  3
UNEQUAL PORTIONS

                     FIGURE 2 DISTRIBUTION OF STUNTED CHILDREN ACROSS THE WORLD REGIONS
                                                                                                                     Europe and Central Asia
                                                                                                                     1.4%

                                                                                                                     East Asia and Pacific
                                                                                                                     10.6%
                                                                                                                     Latin America and Caribbean
                                                                                                                     3.2%
                       Sub-Saharan Africa                                                                            Middle East and North Africa
                       37.6%                                                                                         4.8%

                                                                                                                     South Asia
                                                                                                                     42.5%

                   Source: UNICEF, WHO, World Bank Group, 2015. Levels and trends in child malnutrition.

                   goals, and are reaping the benefits in many areas of                     16 million are severely wasted. This is approximately
                   society. But progress since 1990 has not been                            one out of every 13 children in the world. But, unlike
                   fast enough and has too often left excluded                              stunting, wasting is a short-term condition subject
                   children behind.                                                         to fast changes; therefore, it is highly likely that the
                                                                                            number of children who have experienced wasting
                   Globally, 7.5% of children are too thin for their
                                                                                            at some point in their lives is considerably higher.3
                   height (wasted) – 50 million children – of whom

                     FIGURE 3 CHANGE IN THE NUMBER OF STUNTED CHILDREN ACROSS THE WORLD REGIONS
                                                     300

                                                     250
                       Stunted children (millions)

                                                     200

                                                     150

                                                                                                                     Sub-Saharan Africa
                                                     100
                                                                                                                     South Asia
                                                                                                                     Middle East and North Africa
                                                      50                                                             Latin America and Caribbean
                                                                                                                     Europe and Central Asia
                                                                                                                     East Asia and Pacific
                                                       0
                                                           1990   1995   2000   2005        2010           2014

                   Source: UNICEF, WHO, World Bank Group, 2015. Levels and trends in child malnutrition.

  4
HOW ARE COUNTRIES PROGRESSING                                      children under five of whom 5.8 million are stunted),

                                                                                                                                                           2 WHO ARE THE MALNOURISHED CHILDREN, WHERE DO THEY LIVE, AND WHY MUST WE ADDRESS EXCLUSION TO REACH THEM?
IN ADDRESSING MALNUTRITION?                                        the Democratic Republic of Congo (13.2 million
                                                                   children under five of whom 5.6 million are stunted)
Inequalities in nutrition outcomes are even more                   and Bangladesh (15.4 million children under five
apparent as we turn to the country level. Only                     of whom 5.5 million are stunted).4 The greatest
nine out of 115 countries for which we have data                   prevalence of wasting is found in South Sudan
(Australia, Chile, Czech Republic, Germany,                        (22.7%), Djibouti (21.5%) and Sri Lanka (21.4%),
Republic of Korea, Saint Lucia, Singapore, Ukraine                 where every fifth child is wasted. In half of our
and the USA) have stunting rates below 3% and                      sample (57 countries), the wasting prevalence
nearly all of these are high-income countries. In                  exceeds the WHO threshold of 5% for ‘public
44 countries, the prevalence of stunted growth in                  health significance’. 5
children is high – more than 30%. In three of these
countries – Burundi, Eritrea and Timor-Leste – over
half of the children have stunted growth.                          WHICH COUNTRIES HAVE
Some of the countries with the highest rates of
                                                                   DONE WELL IN ADDRESSING
stunting are also home to very large numbers                       MALNUTRITION?
of children aged under five, leading to very high
                                                                   The vast majority of countries (100 out of 115)
absolute numbers of children being stunted as
                                                                   in our sample have reduced stunting since 2000.
a whole. These countries include India (with
                                                                   Some of these countries have achieved exceptional
124.4 million children under five of whom
                                                                   progress. South Africa reduced its stunting
48.2 million are stunted), Nigeria (30.5 million
                                                                   prevalence from 33% to 24% between 2004 and
children under five of whom 10 million are stunted),
                                                                   2008. Afghanistan cut stunting prevalence from
Pakistan (23.7 million children under five of whom
                                                                   59% to 41% between 2004 and 2013. Three out of
10.7 million are stunted), Ethiopia (14.4 million

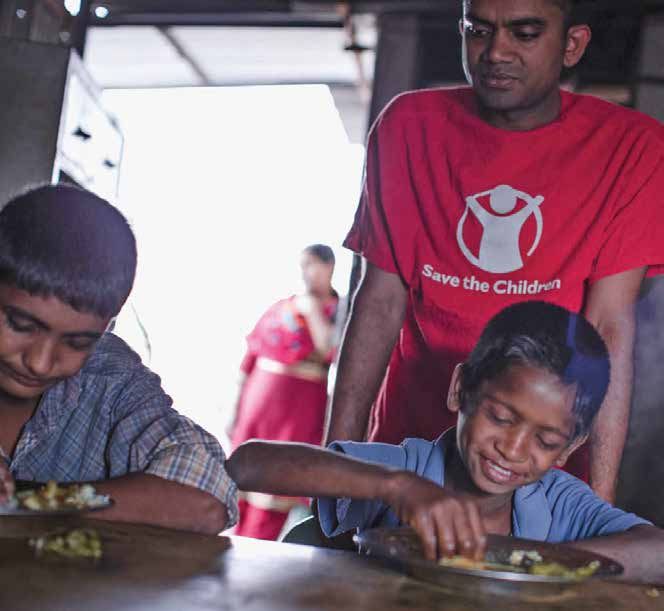
                                                                                                                      PHOTO: IVY LAHON/SAVE THE CHILDREN

Sara, 3, eats a tortilla with herbs. Her family can’t afford enough food since a plague of coffee rust
destroyed coffee crops across Guatemala.

                                                                                                                                                                                                    5
the ten best performers are low-income countries –                     increase in stunting. The largest annual increase
UNEQUAL PORTIONS

                   Afghanistan, Korea PDR and Nepal – and four are                        was observed in Papua New Guinea, where the
                   in sub-Saharan Africa – South Africa, Côte d’Ivoire,                   stunting prevalence increased from 44% to 49%
                   Equatorial Guinea and Ghana.                                           between 2005 and 2010. Stunting prevalence also
                                                                                          increased considerably in Eritrea (from 44% to 50%
                   For wasting, the best performer has been Togo,
                                                                                          in the period 2002–10) and in Djibouti (from 26.5%
                   which more than halved the prevalence between
                                                                                          to 33.5% between 2002 and 2012). These negative
                   2006 and 2014, though from a very high rate of 16%
                                                                                          trends are highly worrying, especially given that
                   to 7%. Burkina Faso nearly halved wasting between
                                                                                          in all but three of those 13 countries (Kuwait,
                   2003 and 2012, from an even higher prevalence
                                                                                          Montenegro, Thailand) the stunting rate is more
                   of 21% to 11%. The list of ten best performers
                                                                                          than 20%.
                   is dominated by low- and lower-middle income
                   countries – not surprising given that these countries                  Compared to stunting, wasting has increased in a
                   usually tend to have a higher prevalence of wasting                    much larger number of countries – 38 out of 113.
                   and therefore larger scope for improvement.                            The greatest increase was observed in Papua New
                                                                                          Guinea: within the five-year period 2005 to 2010,
                                                                                          wasting prevalence tripled from 4.4% to 14.3%.
                   WHICH COUNTRIES HAVE                                                   São Tomé and Principe also experienced a large
                   STRUGGLED?                                                             increase as the wasting prevalence nearly tripled
                                                                                          from 4% to 11% from 2000 to 2008. Interestingly,
                   While countries from all regions and income groups                     with the exception of low-income Mali and upper-
                   have made significant progress in reducing the                         middle income Thailand, all countries in the list of
                   prevalence of stunting, two countries (Romania                         ten worst performers are lower-middle-income
                   and Republic of Korea) have seen no change,                            economies.
                   and 13 countries have actually experienced an

                     FIGURE 4 BEST AND WORST PERFORMING COUNTRIES IN REDUCING STUNTING
                                                           Best performers                                     Worst performers
                                                70

                                               60

                                               50
                            Stunting rate, %

                                               40

                                               30

                                               20

                                                10

                                                 0
                                                                   PD 0 04 8

                                                                                          3

                                                                                         12

                                                                               0 0 13

                                                                                          9

                                                                                         12

                                                                 N 20 0 12

                                                                            20 014

                                                                                          4

                                                                 jib 20 0 10
                                                                   h a 0 03 0

                                                                                          0

                                                                                         12

                                                                                          2

                                                                                05 9
                                                                                          3

                                                                                        09

                                                                                          3
                                                                            20 0 07

                                                                                          0
                                                                                       01

                                                                                       01

                                                                                       01

                                                                                       01
                                                                                       01
                                                                                         1

                                                              Va ti 2 201

                                                                                       01
                                                             l G e 2 20 0

                                                                                        0
                                                                                      00

                                                                                       0
                                                                                     20

                                                                                     20

                                                                                       0

                                                                                     20
                                                                                       0
                                                                                     20

                                                                                     20
                                                                                     20
                                                                                   –2

                                                E q ô t e n i a 0 –2

                                                                                     2

                                                                                   –2

                                                                                   –2
                                                                                   –2

                                                           B o r i a 7– 2

                                                                                   –2
                                                                                   –2

                                                                                     2
                                                                                     2
                                                                                   –2

                                                                                  3–
                                                                                  0–

                                                                     ne 0 6 –

                                                                                  2–
                                                                                  0–

                                                                                  2–

                                                                                  0–
                                                                                 0–
                                                                                   –

                                                                      gr 0 2 –
                                                                     an 0 0 –
                                                                                01

                                                                                01
                                                                   itr 0 05
                                                                               04

                                                                                0
                                                                              00
                                                                                0
                                                                              00

                                                                B o 20 0

                                                                             00
                                                                             00
                                                                            20

                                                                            20
                                                                              0
                                                                            20

                                                                            20
                                          20

                                                                            20

                                                                            20
                                                                            2
                                                                            2

                                                                            2
                                                             Vi R 2

                                                             or ia 2
                                                             Pa a 2
                                                                          u
                                                                         al

                                                                          n
                                                                        na
                                                                         ia

                                                                        ea
                                                                          n

                                                                          o
                                                                          a
                                                                        m

                                                                        te
                                                                          a
                                   a

                                                                       at

                                                                        a
                                                         r ia oir
                                                         Ko ista

                                                                     ou
                                                                     ne
                           r ic

                                                                     ep
                                                                     liv
                                                                    na

                                                                    en

                                                                    es
                                                                     st
                                                                  Sy
                                                                  nu
                                                                  ba

                                                                  ne
                                                                  ui
                                                                  ui

                                                                  w
                                                                  Iv
                         Af

                                                                  ki

                                                                 -L
                                                                 m
                                                                et

                                                                Er
                                               an

                                                                G
                                                                a

                                                               G

                                                               ts
                                                               d’
                                                              Al

                                                              te
                                                              D

                                                             Ar
                                                             re
                       h
                                  gh

                                                          ew

                                                          on
                      ut

                                                          m
                           Af
                    So

                                                       Ti

                                                       M
                                                       N
                                                      to
                                                       C

                                                     a
                                                   ua

                                                  pu
                                               Pa

                           Initial rate              Latest rate

                   Source: UNICEF, WHO, World Bank Group 2015: Joint child malnutrition estimates, http://www.who.int/nutrition/publications/
                   jointchildmalnutrition_2015_estimates/en/

   6
2 WHO ARE THE MALNOURISHED CHILDREN, WHERE DO THEY LIVE, AND WHY MUST WE ADDRESS EXCLUSION TO REACH THEM?
  FIGURE 5 BEST AND WORST PERFORMING COUNTRIES IN REDUCING WASTING
                                      Best performers                                       Worst performers
                         25

                         20
       Wasting rate, %

                         15

                         10

                          5

                          0
                                                                          4

                                                                         12

                                                     o c 0 01 6

                                                                         14
                                      an o P 20 0 13

                                                                         11

                                                     PD 0 02 1

                                                                          2

                                                               06 8

                                                                          4

                                                                          0

                                                                          8

                                                                          9

                                                                          9

                                                               08 3

                                                               01 0

                                                   Eg 0 0 0 6

                                                              0 0 12

                                                               06 4

                                                                          2
                                                                       01
                                                                       01

                                                                       01

                                                                       01
                                                                       01

                                                                       01

                                                                       01
                                                                      01

                                                                        1
                                                                      00
                                                                      00

                                                            20 0 0
                                                                        0

                                                            20 0 0
                                                                     20

                                                                     20
                                                                     20

                                                                       0

                                                                     20
                                                                     20

                                                                      0
                                                                    20
                                                                     2
                               Re Uzb aso 6 –2

                                                                   –2

                                                                   –2

                                                        a n 0 –2
                                                                     2

                                                                   –2

                                                                   –2
                                                                   –2

                                                                  –2
                                                                  –2

                                                                  –2

                                                                  –2
                                                                    2
                                                                 3–

                                                                 0–

                                                                   –
                                          ic i s t a 03 –

                                                                 0–

                                                                 0–
                                                                   –
                                                                  –

                                                                 0–

                                                                 3
                                        T i ncip 0 5

                                                               02
                                                    on 0 02

                                                    ne 0 0 0
                                                    In 0 04
                                                               0

                                                               0

                                                               0
                                                  Af 20 0

                                                  - L 20 0
                                                            20
                    20

                                                            20
                                                            20

                                                            20
                                                            20

                                                i L i 20
                                                            20
                                                            2

                                                            2

                                                           t2
                                                            2
                                                            2

                                                            2

                                                            2
                                                        go

                                                         co

                                                          a
             o

                                                          a
                                                          R

                                                        nd
                                                        ea

                                                        sia
                                                          R

                                                        ka
                                                         te
                                                          n

                                                          a

                                            I n r ia
                                                          e

                                                          l

                                                       yp
                                                       az

                                                        a
                                                       di
         g

                                                     r ic
                                                       D

                                                     es
                                        an uin

                                                    an

                                                     la
                                                     M
      To

                                                     ut
                                                    Sy
                                                    G
                                                     F

                                                  ai
                                                 or

                                                Bh
                                                 C
                                                ek

                                                  a

                                               do
                         a

                                                G

                                                  i
                                                d

                                               Pr

                                              Th
                                              or
                                  t B La

                                              re
                 in

                                               h
                                              M

                                             an
                                             of

                                             Sr
                                           ew
                                            ut
         rk

                                           m
                                          Ko

                                            d
                                          k

                                       So
      Bu

                                        N
                                       bl

                                     a
                                   pu

                                     é
                                   m
                                 pu
                              To
                               es

                              Pa
                           W
                         t ic

                            o
                         Sã
                     ra
            oc
      em
     D

      Initial rate              Latest rate

Source: UNICEF, WHO, World Bank Group 2015: Joint child malnutrition estimates, http://www.who.int/nutrition/publications/
jointchildmalnutrition_2015_estimates/en/

HOW DO INEQUALITY AND                                                  The relative ratio between Dodoma and Dar es
EXCLUSION IMPACT MALNUTRITION?                                         Salam is 2.85, which means that children in Dodoma
                                                                       are 2.85 times more likely to be stunted than
How do we measure inequalities in nutrition                            children in Dar es Salam. Reduction in the ratio tells
between groups?                                                        us more directly about equalisation in life chances,
                                                                       as the measures effectively show how more likely
This section considers two main metrics for the
                                                                       a child from one group is to be malnourished than a
analysis of inequalities between groups: the absolute
                                                                       child from another group.
gap and the relative ratio. The absolute gap simply
measures absolute difference in the given indicator                    There are three additional factors that support
between disadvantaged and reference groups. The                        our decision to use ratio as the main metric in our
relative ratio measures how much more likely the                       analysis. Any differences in nutrition outcomes
disadvantaged group is to experience the given                         between groups can be ascribed to systematic
condition compared to the reference group.                             differences in life chances, and are fundamentally
                                                                       unjust and are a sign of systematic discrimination.
For instance, in Tanzania, the stunting rate is 57% in
                                                                       This means that the ratio between the top and
Dodoma, the most affected region in the country,
                                                                       bottom groups is revealing of the extent of inequity
and 20% in Dar es Salam, the least affected region.
                                                                       in life chances. Second, the gap between the most
This means that the absolute gap between the
                                                                       and least advantaged groups is easy for both
two regions is 37 percentage points. If the gap in
                                                                       politicians and citizens to understand, and should
percentage points between Dodoma and Dar es
                                                                       therefore motivate action. Third, examining the
Salam increases to, say, 15% for Dar es Salam and
                                                                       performance of the top-performing group in society
60% for Dodoma – a gap of 45% – then the absolute
                                                                       shows what level and pace of progress is possible
gap has increased.
                                                                       within a given country context.

                                                                                                                                                                            7
It is also worth noting that although the gap and          rural areas are three times more likely to be stunted
UNEQUAL PORTIONS

                   the ratio are correlated, the absolute gap tends           than children in urban settings, with stunting rates of
                   to be larger in countries with high malnutrition           33% and 11% respectively.
                   rates, whereas ratios are not affected by the level
                   of malnutrition.                                           WHICH COUNTRIES HAVE THE HIGHEST
                                                                              GEOGRAPHICAL INEQUALITIES?
                   In our analysis, we use the best performing group
                   as the reference point in almost all cases – for           Countries with high geographical inequalities in
                   example, the regions and ethnicities with the lowest       stunting tend also to have similar inequalities in
                   malnutrition rates. In the case of economic groups         wasting – almost systematically. For instance, Egypt,
                   and urban/rural areas, we use the richest quintile         Cameroon, Honduras and Guyana are ranked
                   and urban areas; it is worth noting that in a very         among the ten countries with the highest regional
                   few cases, these groups may not have the lowest            inequalities in both stunting and wasting.
                   malnutrition rate.                                         Peru, Cameroon, Bolivia, Honduras and Guyana
                                                                              have high geographical inequalities in multiple
                                                                              malnutrition indicators. These countries are
                   THE LOTTERY OF CHILDHOOD:                                  particularly affected by the lottery of where a
                   COUNTRY REGIONS AND                                        child lives in determining that child’s chances of
                   URBAN AND RURAL AREAS                                      avoiding malnutrition.

                   Where a child lives within any given country               BUT GEOGRAPHICAL INEQUALITIES
                   remains a high determinant of that child’s chances         ARE NOT INEVITABLE
                   of avoiding malnutrition. Children in rural areas          The good news is that geographical inequalities
                   or remote regions may have considerably lower              are not inevitable. Countries with similar levels of
                   nutrition status. In Peru, for example, children in        malnutrition may have remarkably different levels
                   Huancavelica region are 16 times more likely to            of geographical inequality, demonstrating that it is
                   be stunted than children from the region of Tacna,         possible to overcome these inequalities. Consider,
                   with stunting rates of 48% and 3% respectively.            Democratic Republic of Congo and Niger. Both
                   These geographical inequalities are often                  countries have similar prevalence of stunting (of about
                   related to differences in infrastructure or access         43%) but geographical inequalities are considerably
                   to services.                                               larger in the Democratic Republic of Congo. Children
                   Our analysis shows considerable geographical               in Sud-Kivu region in the Democratic Republic of
                   inequalities, whether large urban/rural gaps, or           Congo are 3.7 times more likely to be malnourished
                   wide disparities between regions inside each               than children from Kinshasa. In Niger, children
                   country. In about a third of the countries for which       living in Diffa region are 2.4 times more likely to be
                   data is available (19 out of 56), children living in the   malnourished in comparison with those in the capital
                   worst region for malnutrition are more than three          Niamey. Cameroon and Liberia also have similar
                   times more likely to be malnourished than those            prevalence of stunting (33% and 32% respectively),
                   living in the best region. This is the case in large       but in Cameroon, rural areas have nearly twice the
                   countries with high stunting rates such as Nigeria,        prevalence as urban areas, whereas in Liberia the
                   Democratic Republic of Congo, Pakistan and Egypt,          difference between the two is minimal. Figures 6 and
                   and means that internal geographical inequalities          7 below show the level of geographical inequality
                   in stunting are a major issue for millions of children     in the countries for which we have this level of
                   in the world.                                              data disaggregation.

                   The gap between urban and rural areas is also              Many countries have been able to sustain lower
                   important in most countries, and further highlights        levels of internal geographical inequalities. This
                   the exclusion that children experience when living in      shows that overcoming the exclusion that children
                   remote and isolated places. In our sample, children        experience because of where they live is possible.
                   living in rural areas are 1.37 times more likely to be     However, countries that have vast differences
                   stunted compared with children living in urban areas,      in geography and climate conditions will face
                   But there is huge variability between countries.6 It is    challenges in overcoming these differences to
                   again interesting to consider Peru, where children in      reduce inequalities in nutrition outcomes.

   8
2 WHO ARE THE MALNOURISHED CHILDREN, WHERE DO THEY LIVE, AND WHY MUST WE ADDRESS EXCLUSION TO REACH THEM?
  FIGURE 6 DIFFERENCES IN STUNTING BETWEEN REGIONS WITHIN COUNTRIES

                       Pakistan
                    Guatemala
                            Peru
                     Honduras
                  Timor-Leste
                    Azerbaijan
             Republic of Yemen
  Democratic Republic of Congo
                        Nigeria
        Arab Republic of Egypt
                      Tanzania
                  Mozambique
                        Burundi
                    Cameroon
                           India
                         Bolivia
                          Niger
                       Ethiopia
                     Cambodia
                       Armenia
                       Rwanda
                 Burkina Faso
                         Ghana
                        Senegal
        São Tomé and Principe
                       Lesotho
                       Namibia
                  The Gambia
                        Guinea
                           Togo
                  Madagascar
                   Bangladesh
                  Sierra Leone
                 Côte d’Ivoire
                         Gabon
                       Uganda
                      Comoros
                          Nepal
                          Kenya
             Republic of Congo
                        Albania
                           Haiti
                        Zambia
               Kyrgyz Republic
                     Swaziland
                      Tajikistan
                     Zimbabwe
           Dominican Republic
                       Maldives
                       Moldova
                         Liberia
                         Jordan
                     Colombia
                        Malawi

                                   0      10        20          30   40      50       60   70   80   90   100
                                                                      Stunting rate (%)

    Best region       Worst region        National average

Source: Save the Children UK, Group and Inequalities Database

                                                                                                                                                       9
UNEQUAL PORTIONS

                     FIGURE 7 DIFFERENCES IN STUNTING BETWEEN URBAN AND RURAL AREAS

                                               Peru
                                           Burundi
                                            Bolivia
                                       Cameroon
                                          Rwanda
                                       Guatemala
                                              Togo
                                Republic of Yemen
                                           Guinea
                                          Uganda
                                           Nigeria
                                    Burkina Faso
                     Democratic Republic of Congo
                                            Gabon
                                             Niger
                                        Honduras
                                          Ethiopia
                                    Côte d’Ivoire
                                             Nepal
                                         Tanzania
                                     Timor-Leste
                                          Lesotho
                                          Pakistan
                                              India
                                Republic of Congo
                                             Kenya
                                           Senegal
                                        Cambodia
                                     Mozambique
                                       Azerbaijan
                                     The Gambia
                                     Sierra Leone
                                            Ghana
                                           Malawi
                                          Namibia
                                              Haiti
                                     Madagascar
                                         Comoros
                                      Bangladesh
                                         Tajikistan
                                           Zambia
                                        Swaziland
                                          Maldives
                                        Colombia
                                        Zimbabwe
                                          Armenia
                           Arab Republic of Egypt
                                          Moldova
                                            Liberia
                           São Tomé and Principe
                                            Jordan
                                           Albania
                              Dominican Republic
                                  Kyrgyz Republic

                                                      0          10                20   30            40    50   60   70
                                                                                        Stunting rate (%)

                       Urban       Rural       National average

                   Source: Save the Children UK, Group and Inequalities Database

  10
UNEQUAL CHANCES OF                                             For example, Ghana and Peru have an almost

                                                                                                                                                                 2 WHO ARE THE MALNOURISHED CHILDREN, WHERE DO THEY LIVE, AND WHY MUST WE ADDRESS EXCLUSION TO REACH THEM?
MALNUTRITION FOR                                               identical national prevalence of stunting at 19%
                                                               and 18% respectively. This is despite Peru having
THE POOR AND RICH                                              three times higher gross national income per
Family income is a strong determinant of a child’s             capita. However, disparities between the richest
nutrition status globally, so it comes as no surprise          and poorest children are much more pronounced in
that in many countries the poorest fifth of children           Peru, where 40% of the poorest children are stunted;
have considerably higher stunting and wasting                  the risk of stunting is much lower for the poorest
rates than the richest fifth. Our analysis shows               children in Ghana – 26%.
that across our sample of 56 countries, the poorest
children are 2.26 times more likely to be stunted              WHICH COUNTRIES ARE MOST UNEQUAL FOR
and 1.89 more likely to be wasted than the richest             THE POOREST AND THE RICHEST CHILDREN?
children.7 Equally, 17% of poor children are wasted            In Peru, inequalities in stunting among economic
in contrast to 9% of the richest children. The high            groups are exceptionally high, with poor children
rates of undernutrition experienced even by the                11 times more likely to be stunted than those who
richest children in many of our sample countries               are rich. This type of inequality is also very high in
clearly illustrate that being rich – relative to others        Jordan, Bolivia, Honduras and Gabon, where the
in poor countries – does not necessarily guarantee             ratio exceeds 5:1.
adequate nutrition.
                                                               Cameroon and Armenia top the list of countries
But, again, the story is not quite so simple. Some             with the highest levels of inequalities in wasting,
countries have much lower inequalities, indicating             with poor children six times more likely to have
it is possible to ease the economic constraints that           low weight for height than rich children. They are
poor households experience.                                    followed by Kenya, Mozambique and Swaziland,
                                                               each with ratios exceeding 3:1.

                                                                                                                        PHOTO: COLIN CROWLEY/SAVE THE CHILDREN

Two-year-old Melvin is being treated for malnutrition in north-western Kenya, where successive droughts
have made it hard for many families to make a living.

                                                                                                                                                                         11
UNEQUAL PORTIONS

                     FIGURE 8 DIFFERENCES IN STUNTING BETWEEN THE RICH AND THE POOR

                                       Guatemala
                                            Bolivia
                                          Pakistan
                                       Cameroon
                                               Peru
                                           Nigeria
                                        Honduras
                                              India
                                Republic of Yemen
                                             Nepal
                     Democratic Republic of Congo
                                          Rwanda
                                           Burundi
                                      Bangladesh
                                     Mozambique
                                            Gabon
                                Republic of Congo
                                              Haiti
                                    Côte d’Ivoire
                                    Burkina Faso
                                              Togo
                                        Cambodia
                                         Tanzania
                                          Namibia
                                           Malawi
                                        Swaziland
                                           Senegal
                                          Ethiopia
                           São Tomé and Principe
                                             Kenya
                                           Zambia
                                       Azerbaijan
                                           Guinea
                                            Ghana
                                          Lesotho
                                         Comoros
                                           Albania
                                     Timor-Leste
                                            Liberia
                                     Sierra Leone
                                          Uganda
                                     The Gambia
                                        Colombia
                                            Jordan
                                         Tajikistan
                                        Zimbabwe
                                             Niger
                              Dominican Republic
                                          Maldives
                                          Armenia
                                          Moldova
                                     Madagascar
                                  Kyrgyz Republic
                           Arab Republic of Egypt

                                                      0         10           20    30          40           50   60   70   80
                                                                                        Stunting rate (%)

                       Bottom 20%         Top 20%         National average

                   Source: Save the Children UK, Group and Inequalities Database

  12
2 WHO ARE THE MALNOURISHED CHILDREN, WHERE DO THEY LIVE, AND WHY MUST WE ADDRESS EXCLUSION TO REACH THEM?
  FIGURE 9 COUNTRIES WITH THE HIGHEST INEQUALITIES IN STUNTING AND WASTING
  BETWEEN RICH AND POOR
                           Inequalities in stunting                                       Inequalities in wasting

                   Peru                                                      Cameroon

                                                                               Armenia
                 Jordan

                                                                                 Kenya
                 Bolivia
                                                                            Mozambique
              Honduras
                                                                              Swaziland
                 Gabon
                                                                             Azerbaijan
                   Haiti
                                                                             Zimbabwe
             Cameroon
                                                                               Namibia

      Republic of Congo                                                           Haiti

               Namibia                                                         Ethiopia

    Dominican Republic                                                        Colombia

                     		          2:1    4:1    6:1    8:1    10:1    12:1            		           2:1        4:1         6:1       8:1
                            Ratio poorest quintile to richest quintile                    Ratio poorest quintile to richest quintile

Source: Save the Children UK, Group and Inequalities Database

    ETHNICITY, RACE, RELIGION AND CASTE
    Similar to geographical location and family’s                        Inequalities in wasting are even more
    economic status, children’s chances of avoiding                      pronounced across ethnic groups. In Cameroon,
    malnutrition are highly determined by their                          11% of Biu-Mandara ethnicity children are
    ethnic background.                                                   wasted, while wasting occurs in 1% of children
                                                                         from the Bamilike ethnic group. In Ethiopia,
    In nearly all the countries for which we have data,
                                                                         24% of Nuwe ethnicity children are wasted,
    we found considerable disparities in malnutrition
                                                                         compared to 3% of Kefficho ethnicity children.
    prevalence between children in different ethnic
                                                                         In many cases, geographical inequalities interlink
    groups. Our research shows that in our sample
                                                                         with inequality between ethnic groups.
    of 48 countries with available data on ethnicity,
    children in the ethnic groups with the worst                         Ethnic inequalities also appear to be increasing
    nutrition outcomes, on average, have 2.8 times                       in many countries. Ten out of 21 countries in our
    higher rates of stunting and six times higher rates                  sample have experienced an increase in ethnic
    of wasting than their more advantaged peers.                         inequalities in stunting since 2000; the average
                                                                         ratio of inequality increased from 1.5:1 to 1.6:1.
    But in some countries, disparities are
                                                                         Ethnic inequalities in wasting increased in 14 out
    considerably higher. For example, in Nigeria
                                                                         of 20 countries and the average inequality grew
    52% of Hausa ethnicity children are stunted,
                                                                         from 2.2:1 to 2.8:1. Yet some countries have
    compared to 14% Igbo ethnic group children.
                                                                         managed to make significant progress in reducing
    In Ghana, 33% of Gruma ethnic group children
                                                                         these inequalities. In Kenya, for example,
    are stunted, compared to 10% of children from
    Ga/Adangbe ethnic group.                                                                                       continued overleaf

                                                                                                                                           13
UNEQUAL PORTIONS

                   ETHNICITY, RACE, RELIGION AND CASTE continued
                   inequality in stunting between the Mijikenda/                         between the worst- and best-performing groups
                   Swahili and Kikuyu groups decreased from a                            dropped from a ratio of 2:1 to 1.2:1 between
                   ratio of 1.7:1 to 1.6:1 between 1998 and 2009. In                     1999 and 2012.
                   Côte d’Ivoire, the relative difference in wasting

                   FIGURE 10 DIFFERENCES IN STUNTING BY ETHNICITY

                                        Ethiopia

                              Republic of Congo

                                        Pakistan

                                       Honduras

                                    Mozambique

                                          Liberia

                   Democratic Republic of Congo

                                          Nepal

                                          Gabon

                                      Azerbaijan

                                         Nigeria

                                            Peru

                                         Uganda

                                    Burkina Faso

                                      Cameroon

                                     Guatemala

                                    Sierra Leone

                                          Ghana

                                         Zambia

                                           Togo

                                         Malawi

                                       Colombia

                                          Kenya

                                    The Gambia

                                    Côte d’Ivoire

                                            India

                                         Guinea

                                        Moldova

                                         Senegal

                                                    0         10      20          30      40       50       60   70   80     90    100
                                                                                            Stunting rate (%)

                    Least affected ethnicity            Most affected ethnicity        National average

                   Source: Save the Children UK, Group and Inequalities Database

  14
2 WHO ARE THE MALNOURISHED CHILDREN, WHERE DO THEY LIVE, AND WHY MUST WE ADDRESS EXCLUSION TO REACH THEM?
      THE INCREASING PROBLEM OF OVERWEIGHT AND OBESITY
      Overweight and obesity are also forms of                                THE LOTTERY OF CHILDHOOD
      malnutrition. Indeed, these types of malnutrition                       OVERWEIGHT AND OBESITY
      are increasingly recognised as one of today’s                           Our analysis demonstrates that overweight and
      most visible – yet most neglected – public health                       obesity are related to geography, economic
      problems because of the mortality, morbidity                            status and ethnicity in various ways.
      and extraordinary healthcare costs brought by
      their links to diet-related non-communicable                            Geography
      diseases. For example, 2.8 million people die
                                                                              The vast majority of overweight or obese children
      each year as a result being overweight or obese
                                                                              live in developing countries, where the rate of
      (5% of all deaths worldwide),8 at an estimated
                                                                              increase has been more than 30% higher than that
      economic cost of US$2 trillion a year.9
                                                                              in developed countries.12 Geographic inequalities
      Rates of overweight and obesity have                                    inside countries can be high: in Pakistan, 40% of
      skyrocketed over the last four decades and                              children in the most-affected regions are
      now, for the first time, there are more obese                           overweight, whereas in the least-affected regions
      than underweight adults.10 More than 1.9 billion                        the prevalence is 2.5%. In Egypt, in the region
      adults – nearly 30% of the global population –                          with the highest prevalence, 32% of children are
      are overweight, and 600 million are obese.11                            overweight, and less than 1% are overweight in
      And overweight in infants and young children                            the region with the lowest prevalence.
      (aged 0 to 5 years) is becoming increasingly
                                                                                                                               continued overleaf
      prevalent, increasing from 31.2 million in 1990
      to 40.7 million in 2014. Worrying, this upward
      trend is apparent in all regions of the world,
      particularly in Africa and Asia.

        FIGURE 11 CHANGES IN OVERWEIGHT IN CHILDREN – GLOBALLY
                                         45                                                         10

                                                                                          40.7
                                         40
                                                                             37
                                                                                                    8
                                         35
                                                                   33.1
Number of children affected (millions)

                                              31.2   30.7   30.6
                                         30
                                                                                          6.1
                                                                             5.7                    6
                                                                                                         Prevalence (%)

                                         25                        5.3
                                                             5.1
                                              4.8    4.9

                                         20
                                                                                                    4

                                         15

                                         10
                                                                                                    2

                                          5
                                                                                                                          Number of
                                                                                                                          children affected

                                          0                                                         0                     Prevalence
                                              1990   1995   2000   2005    2010          2014

        Source: UNICEF, WHO, World Bank Group, 2015. Levels and trends in child malnutrition. Joint child malnutrition estimates

                                                                                                                                                      15
UNEQUAL PORTIONS

                   THE INCREASING PROBLEM OF OVERWEIGHT AND OBESITY continued
                   FIGURE 12 DIFFERENCES IN OVERWEIGHT BETWEEN REGIONS WITHIN COUNTRIES

                                        Pakistan
                         Arab Republic of Egypt
                                        Armenia
                                     Azerbaijan
                                             Peru
                                        Lesotho
                                   Timor-Leste
                                       Tajikistan
                                         Albania
                                     Cameroon
                                       Comoros
                                            India
                   Democratic Republic of Congo
                         São Tomé and Principe
                                        Maldives
                                          Bolivia
                                       Tanzania
                                      Zimbabwe
                                   Mozambique
                            Dominican Republic
                                        Namibia
                                      Swaziland
                                   Sierra Leone
                                  Burkina Faso
                                      Honduras
                                      Cambodia
                                         Senegal
                                          Gabon
                                         Zambia
                                        Ethiopia
                              Republic of Yemen
                                         Nigeria
                                          Jordan
                                         Burundi
                                          Ghana
                                Kyrgyz Republic
                                           Kenya
                                           Niger
                                         Malawi
                                         Guinea
                                  Côte d’Ivoire
                                        Moldova
                                        Uganda
                                            Haiti
                                   The Gambia
                                      Colombia
                                          Liberia
                                        Rwanda
                              Republic of Congo
                                            Togo
                                           Nepal
                                    Bangladesh

                                                    0               10             20              30    40   50
                                                                                   Overweight rate (%)

                    Best region       Worst region        National average

                   Source: Save the Children UK, Group and Inequalities Database

  16
You can also read