United In Science High-level synthesis report of latest climate science information convened by the Science Advisory Group of the UN Climate ...
←
→
Page content transcription
If your browser does not render page correctly, please read the page content below

United In Science
High-level synthesis report of latest climate science information
          convened by the Science Advisory Group of
              the UN Climate Action Summit 2019
This report has been compiled by the World Meteorological Organization under the auspices of the Science Advisory Group of the UN
Climate Action Summit 2019, to bring together the latest climate science related updates from a group of key global partner
organizations - The World Meteorological Organization (WMO), UN Environment (UNEP), Intergovernmental Panel on Climate
Change (IPCC), Global Carbon Project, Future Earth, Earth League and the Global Framework for Climate Services (GFCS). The
content of each chapter of this report is attributable to published information from the respective organizations. Overall content
compilation of this material has been carried out by the World Meteorological Organization.

This report is available electronically, together with more extended background reports and additional supporting material at:
public.wmo.int/en/resources/united_in_science

Cover illustration: View from above; Photographer: Leslie-Ann Boisselle (Trinidad and Tobago); Location: Somewhere over the
North Atlantic

Lead Authors and Contributors:
WMO (overall coordination, scientific and graphical editing): Pavel Kabat, Paul Egerton, Omar Baddour, Laura Paterson, Clare Nullis,
Sylvie Castonguay, Melissa Walsh
WMO (Global Climate 2015-2019): Peter Siegmund, lead author (Royal Netherlands Meteorological Institute), Jacob Abermann
(University of Graz, Austria), Omar Baddour (WMO), Anny Cazenave (Laboratoire d’Etudes en Géophysique et Océanographie
Spatiales CNES and Observatoire Midi-Pyrénées, France), Chris Derksen (Environment and Climate Change Canada), Arthur
Garreau (Météo-France), Stephen Howell (Environment and Climate Change Canada), Kirsten Isensee (IOC-UNESCO), John
Kennedy (UK Met Office), Ruth Mottram (Danish Meteorological Institute), Matthias Huss (ETH Zürich), Rodica Nitu (WMO), Selvaraju
Ramasamy (Food and Agriculture Organization of the United Nations (FAO)), Katherina Schoo (IOC-UNESCO), Michael Sparrow
(WMO), Blair Trewin (Bureau of Meteorology, Australia), Markus Ziese (Deutscher Wetterdienst (DWD))

Global Carbon Project: Pep Canadell (CSIRO, Australia), Rob Jackson (Stanford University, USA), Pierre Friedlingstein (University of
Exeter, UK), Glen Peters (CICERO, Norway), Corinne Le Quere (University of East Anglia, UK), Robbie Andrew (CICERO, Norway).
WMO-Global Atmosphere Watch (GAW): Oksana Tarasova (WMO), Alex Vermeulen (Lund University, Sweden), Ed Dlugokencky
(NOAA, USA), Pieter Tans (NOAA, USA), Doug Worthy (Environment and Climate Change Canada, Canada), Gordon Brailsford
(NIWA, New Zealand)
UN Environment Programme (UNEP): Anne Olhoff (UNEP DTU Partnership), John M. Christensen (UNEP DTU Partnership), Maarten
Kappelle, Jian Liu, Joeri Rogelj (Imperial College London), Pinya Sarasas
Intergovernmental Panel on Climate Change (IPCC): IPCC contributors
Future Earth and Earth League: Review editors: Dr. Tanja Blome, Climate Service Center Germany (GERICS), Dr. Wendy Broadgate,
Global Hub Director, Sweden, Future Earth, Dr. Josep Canadell, Executive Director, Global Carbon Project, Prof. Kristie L. Ebi, MPH,
Department of Global Health, School of Public Health, University of Washington, Prof. Dr. Ottmar Edenhofer, Director of the Mercator
Research Institute on Global Commons and Climate Change, co-director of the Potsdam Institute for Climate Impact Research,
professor at Technische Universität Berlin, Owen Gaffney, Director of International Media and Strategy, Stockholm Resilience Centre ,
Dr. Maria A. Martin, Postdoctoral Research Fellow and Research Analyst in the Director’s Office, Potsdam Institute for Climate Impact
Research, Prof. Johan Rockström, co-director, Potsdam Institute for Climate Impact Research, Co-chair of Future Earth Advisory
Committee, Chair of the Earth League, Dr. Joyashree Roy, Bangabandhu chair professor, Asian Institute of Technology (AIT),
Professor of Economics, Jadavpur University, Prof. Leena Shrivastava, co-chair of Future Earth Advisory Committee, Incoming DDG
Science, International Institute for Applied Systems Analysis (IIASA), Charlotte Unger, Climate Action in National and International
Processes, Institute for Advanced Sustainability Studies, Editor: Andréa Ventimiglia (Future Earth)
Global Framework of Climate Services (GFCS): Filipe Lucio (WMO), Maxx Dilley (WMO), Veronica Grasso (WMO)
Foreword by António Guterres, United Nations Secretary-General

              Climate change is the defining challenge of our time.

       This important document by the United Nations and global partner
  organizations, prepared under the auspices of the Science Advisory Group of
the Climate Action Summit, features the latest critical data and scientific findings
     on the climate crisis. It shows how our climate is already changing, and
      highlights the far-reaching and dangerous impacts that will unfold for
                                generations to come.

Science informs governments in their decision-making and commitments. I urge
leaders to heed these facts, unite behind the science and take ambitious, urgent
  action to halt global heating and set a path towards a safer, more sustainable
                                   future for all.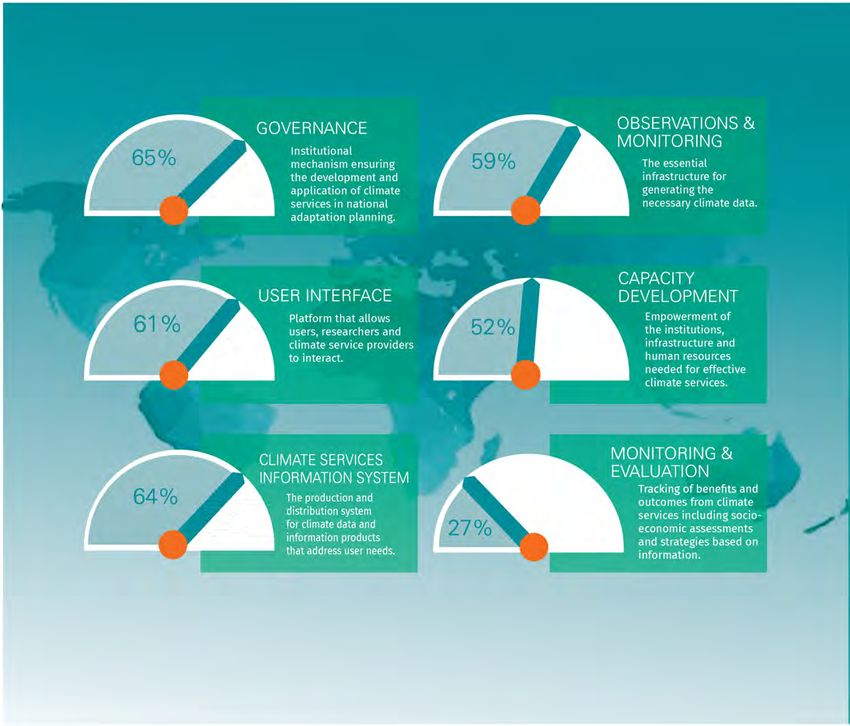
Statement by the Science Advisory Group
          Co-Chairs Prof Petteri Taalas (WMO) and Dr Leena Srivastava (IIASA)1

The UN Climate Action Summit 2019 Science Advisory Group called for this High Level
Synthesis Report, to assemble the key scientific findings of recent work undertaken by major
partner organizations in the domain of global climate change research, including the World
Meteorological Organization, UN Environment, Global Carbon Project, the Intergovernmental
Panel on Climate Change, Future Earth, Earth League and the Global Framework for Climate
Services. The Report provides a unified assessment of the state of our Earth system under the
increasing influence of anthropogenic climate change, of humanity’s response thus far and of the
far-reaching changes that science projects for our global climate in the future. The scientific data
and findings presented in the report represent the very latest authoritative information on these
topics. It is provided as a scientific contribution to the UN Climate Action Summit 2019, and
highlights the urgent need for the development of concrete actions that halt the worst effects of
climate change.

The Synthesis Report is an example of the international scientific community’s commitment to
strategic collaboration in order to advance the use of scientific evidence in global policy,
discourse and action. The Science Advisory Group will remain committed to providing its
expertise to support the global community in tackling climate change on the road to COP 25 in
Santiago and beyond.

Science Advisory Group Members:
Dr Navroz K. Dubash Center for Policy Research, New Delhi India

Dr Heide Hackmann International Science Council
Dr Brigitte Knopf Mercator Research Institute on Global Commons and Climate Change
Dr Thelma Krug Intergovernmental Panel on Climate Change
Dr Margaret Leinen Scripps Institute of Oceanography University of California
Dr Jian Liu UN Environment (UNEP)
Dr Yacob Mulugetta University College London
Dr Joeri Rogelj Imperial College London
Dr Maisa Rojas Corradi University of Chile
Dr Lisa Schipper University of Oxford

                                                                                  1As   of November 2019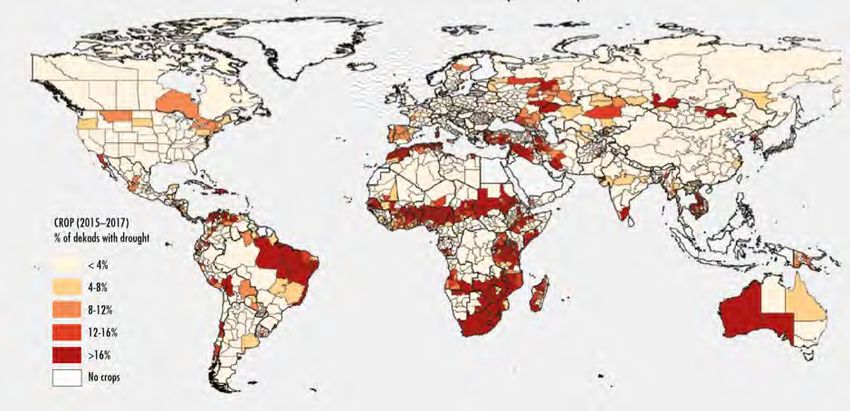
Key Messages

The Global Climate in 2015 - 2019
• Average global temperature for 2015-2019 is on track to be the warmest of any equivalent period on record. It is
  currently estimated to be 1.1°C above pre-industrial (1850-1900) times and 0.2°C warmer than 2011-2015
• Observations show that global mean sea level rise is accelerating and an overall
  increase of 26% in ocean acidity since the beginning of the industrial era

Global Fossil CO2 Emissions
• CO2 emissions from fossil fuel use continue to grow by over                 REDUCTIONS IN GHG     2015–2019
                                                                              EMISSIONS REQUIRED    WARMEST FIVE-YEAR
  1% annually and 2% in 2018 reaching a new high                                FROM ALL SECTORS    PERIOD
                                                                                                                            +1.1°C
• Growth of coal emissions resumed in 2017
• Despite extraordinary growth in renewable energy,
  fossil fuels still dominate the global energy system        POLICIES TO LOWER
                                                          EMISSIONS MUST TRIPLE                                     1.1 °C ABOVE
                                                               TO MEET 2 °C LIMIT                                   PRE-INDUSTRIAL
                                                                                                                    LEVELS
Greenhouse Gas Concentrations                                 FIVEFOLD TO ALIGN
                                                            WITH THE 1.5 °C LIMIT
• Increases in CO2 concentrations continue to              ZERO
                                                                                            UNITED
  accelerate                                                                                   IN
• Current levels of CO2, CH4 and N2O represent                    EMISSIONS NOT             SCIENCE                 CLIMATE IMPACTS
  146%, 257% and 122% respectively of pre-                          ESTIMATED TO                                    HITTING HARDER
  industrial levels (pre-1750)                                       PEAK IN 2030,                                  AND SOONER
                                                                  LET ALONE 2020                                    THAN PREDICTED
                                                                                                                    A DECADE AGO

Emissions Gap
• Global emissions are not estimated to peak by 2030,
  let alone by 2020                                                                    RECORD OF    2% ANNUAL
                                                                               37 BILLION TONNES    GROWTH IN
• Implementing current unconditional NDCs would lead to a                          OF CO₂ IN 2018   CO₂ EMISSIONS
  global mean temperature rise between 2.9°C and 3.4°C by
  2100 relative to pre-industrial levels, and continuing thereafter
• The current level of NDC ambition needs to be roughly tripled for                          CO2     CO2
  emission reduction to be in line with the 2°C goal and increased fivefold
  for the 1.5°C goal. Technically it is still possible to bridge the gap

Intergovernmental Panel on Climate Change 2018 & 2019 Special Reports
• Limiting temperature to 1.5°C above pre-industrial levels would go hand-in-hand with reaching other world goals
  such as achieving sustainable development and eradicating poverty
• Climate change puts additional pressure on land and its ability to support and supply food, water, health and
  wellbeing. At the same time, agriculture, food production, and deforestation are major drivers of climate change

Climate Insights
• Growing climate impacts increase the risk of crossing critical tipping points
• There is a growing recognition that climate impacts are hitting harder and sooner than climate assessments
  indicated even a decade ago
• Meeting the Paris Agreement requires immediate and all-inclusive action encompassing deep decarbonisation
  complemented by ambitious policy measures, protection and enhancement of carbon sinks and biodiversity, and
  effort to remove CO2 from the atmosphere

Global Framework for Climate Services
• Climate and early warning information services should underpin decision-making on climate action for adaptation
• The capacities of countries to deliver climate and early warning information services varies across regions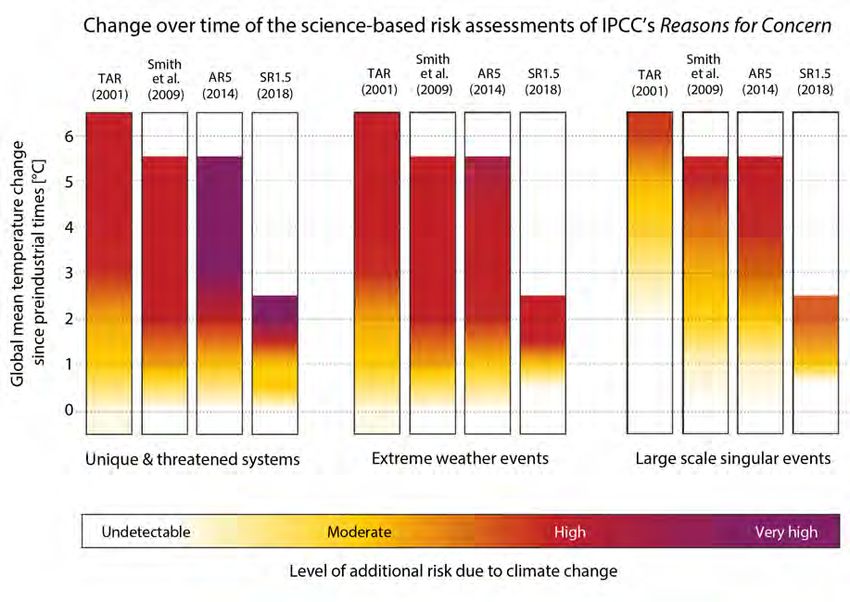
The Global Climate in 2015–2019

Warmest five-year period on
record
The average global temperature for 2015–
2019 is on track to be the warmest of any
equivalent period on record. It is currently
estimated to be 1.1°Celsius (± 0.1 °C)
above pre-industrial (1850–1900) times
and 0.20 ±0.08 °C warmer than the global
average temperature for 2011–2015.
The 2015-2019 five-year average
temperatures were the highest on record
for large areas of the United States,
including Alaska, eastern parts of South
America, most of Europe and the Middle
East, northern Eurasia, Australia, and
                                                       Five-year running average of global temperature anomalies (relative to pre-industrial) from 1854 to 2019
areas of Africa south of the Sahara. July
                                                       for five data sets: HadCRUT.4.6.0.0, NOAAGlobalTemp v5, GISTEMP v4, ERA5, and JRA-55. Data for
2019 was the hottest month on record                   2019 to June
globally.

Sea-level rise is accelerating,
sea water is becoming more
acidic
The observed rate of global mean sea-
level rise increased from 3.04 millimeters
per year (mm/yr) during the period 1997–
2006 to approximately 4 mm/yr during the
period 2007–2016. The accelerated rate in
sea level rise as shown by altimeter
satellites is attributed to the increased rate
of ocean warming and land ice melt from
the Greenland and West Antarctica ice
sheets.
                                                           2015-2019 five-year average temperature anomalies relative to the 1981-2010 average.
The ocean absorbs nearly 25% of the                        Data are from NASA GISTEMP v4. Data for 2019 to June.
annual emissions of anthropogenic CO2
thereby helping to alleviate the impacts of
climate change on the planet. The
absorbed CO2 reacts with seawater and
increases the acidity of the ocean.

Figure opposite: Time series of altimetry-based
global mean sea level from January 1993–May 2019.
The thin black line is a quadratic function showing
the mean sea-level rise acceleration. Data source:
European Space Agency (ESA) Climate Change
Initiative (CCI) sea-level data until December 2015,
extended by data from the Copernicus Marine
Service (CMEMS) as of January 2016 and near real-
time Jason-3 as of April 2019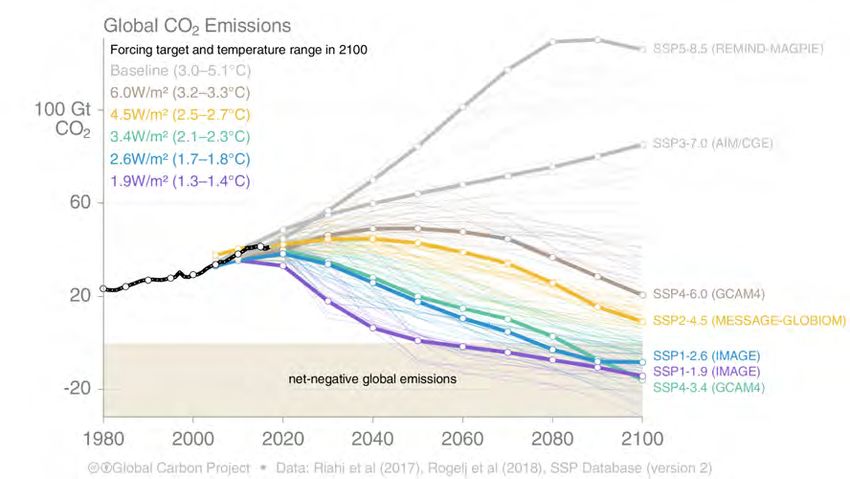
The Global Climate in 2015–2019

Observations show an overall increase of 26% in ocean acidity since the beginning of the industrial era. The
ecological cost to the ocean, however, is high, as the changes in acidity are linked to shifts in other carbonate
chemistry parameters, such as the saturation state of aragonite. This process, detrimental to marine life and ocean
services, needs to be constantly monitored through sustained ocean observations.

Continued decrease of sea ice and ice mass
The long-term trend over the 1979-2018 period indicates that Arctic summer sea-ice extent has declined at a rate of
approximately 12% per decade. In every year from 2015 to 2019, the Arctic average summer minimum and winter
maximum sea-ice extent were well below the 1981–2010 average. The four lowest values for winter sea-ice extent
occurred in these five years.
Summer sea ice in Antarctica reached its lowest and second lowest extent on record in 2017 and 2018, respectively.
The second lowest winter extent ever recorded was also experienced in 2017. Most remarkably sea ice extent values
for the February minimum (summer) and September maximum (winter) in the period from 2015-2019 have been
well below the 1981-2010 average since 2016. This is a sharp contrast with the 2011-2015 period and the long term
1979-2018 values that exhibited increasing trends in both seasons.
Overall, the amount of ice lost annually from the Antarctic ice sheet increased at least six-fold between 1979 and
2017. The total mass loss from the ice sheet increased from 40 Gigatons (Gt) average per year in 1979–1990 to 252
Gt per year in 2009–2017.
Sea level rise contribution from Antarctica averaged 3.6 ± 0.5 mm per decade with a cumulative 14.0 ± 2.0 mm since
1979. Most of the ice loss takes place by melting the ice shelves from below, due to incursions of relatively warm
ocean water, especially in West Antarctica and to a lesser extent along the Peninsula and in East Antarctica.

                        200                                                                                                                   Report
 Specific mass-change

                                                                                                                                              period
                          0
   rate (kg m-2 yr-1)

                        -200
                        -400
                        -600
                        -800
                                  Reference glaciers of the WGMS
                    -1000

                               1960        1970                 1980                 1990                  2000                 2010                 2020
                                                                                     Year
     Time series of average of observed annual specific mass-change rate of all WGMS reference glaciers, including five-year averages (data source: WGMS)

Analysis of long-term variations in glacier mass often relies on a set of global reference glaciers, defined as sites with
continuous high-quality in situ observations of more than 30 years. Results from these time series are, however, only
partly representative for glacier mass changes at the global scale as they are biased to well-accessible regions such
as the European Alps, Scandinavia and the Rocky Mountains. Nevertheless, they provide direct information on the
year-to-year variability in glacier mass balance in these regions. For the period 2015–2018, data from the World
Glacier Monitoring Service (WGMS) reference glaciers indicate an average specific mass change of −908 mm water
equivalent per year. This depicts a greater mass loss than in all other five-year periods since 1950, including the
2011-2015 period. Warm air from a heatwave in Europe in July 2019 reached Greenland, sending temperature and
surface melting to record levels.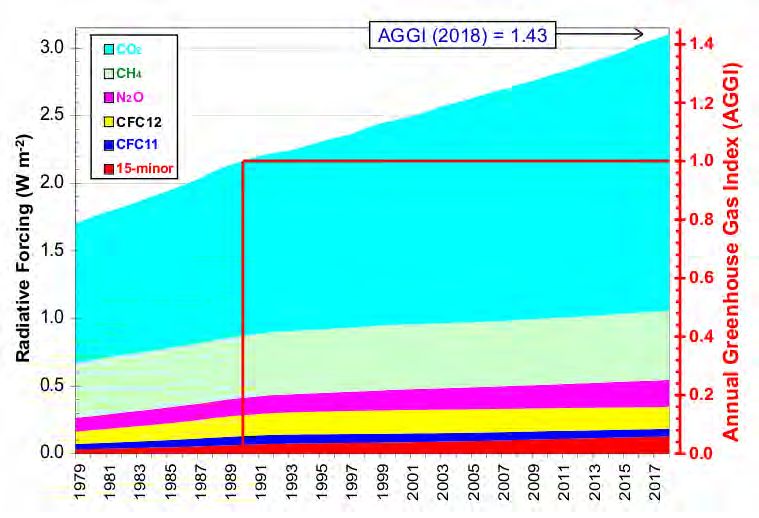
The Global Climate in 2015–2019

Intense heatwaves and wild fires
Heatwaves were the deadliest meteorological
hazard in the 2015–2019 period, affecting all
continents and setting many new national
temperature records. Summer 2019 saw
unprecedented wildfires in the Arctic region. In
June alone, these fires emitted 50 megatons
(Mt) of carbon dioxide into the atmosphere.
This is more than was released by Arctic fires
in the same month from 2010 to 2018 put
together.

There were multiple fires in the Amazon
rainforest in 2019, in particular in August.

Costly tropical cyclones
Overall, the largest economic losses were
associated with tropical cyclones.

The 2018 season was especially active, with
the largest number of tropical cyclones of any            The Fire Radiative Power (Gigawats)– a measure of heat output from wildfires shown in June for 2019 (red)
                                                          and the 2003–2018 average (grey) (Source: Copernicus Atmospheric Monitoring Services (CAMS)).
year in the twenty-first century. All Northern
Hemisphere basins experienced above-
average activity – the Northeast Pacific
recorded its largest Accumulated Cyclone
Energy (ACE) value ever.

The 2017 Atlantic hurricane season was one of the most devastating on record with more than US$ 125 billion in
losses associated with Hurricane Harvey alone. Unprecedented back-to-back Indian Ocean tropical cyclones hit
Mozambique in March and April 2019.

Food insecurity increasing
According to the Food and Agriculture
Organization of the United Nations (FAO)
report on the State of Food Security and
Nutrition in the World, climate variability and
extremes are among the key drivers behind
the recent rises in global hunger after a
prolonged decline and one of the leading
contributors to severe food crises. Climate
variability and extremes are negatively
affecting all dimensions of food security –
food availability, access, utilization and         Number of undernourished people in the world, 2015–2018 (FAO, IFAD, UNICEF and WHO,
                                                   2019).
stability. The frequency of drought conditions
from 2015–2017 show the impact of the
2015–2016 El Niño on agricultural
vegetation. The following map shows that
large areas in Africa, parts of central America, Brazil and the Caribbean, as well as Australia and parts of the Near
East, experienced a large increase in frequency of drought conditions in 2015–2017 compared to the 14-year
average.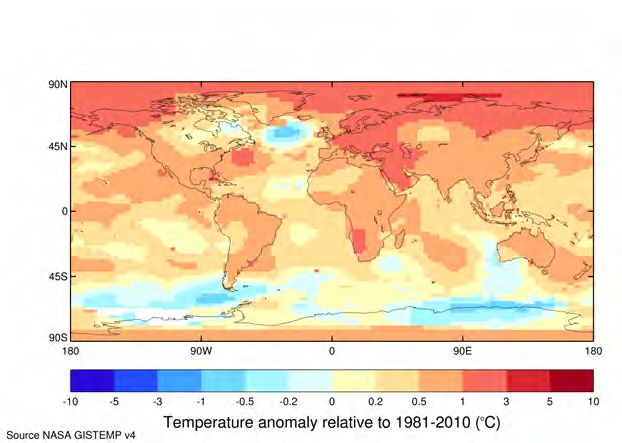
The Global Climate in 2015–2019

        Percentage of time (dekad is a 10-day period) with active vegetation when the Anomaly Hot Spots of Agricultural Production (ASAP) was
        signaling possible agricultural production anomalies according to NDVI (Normalized Difference Vegetation Index) for more than 25% of the
        crop areas in 2015–2017 (FAO, IFAD, UNICEF, WFP and WHO, 2018)

Overall risk of climate-related
illness or death increasing
Based on data and analysis from the World
Health Organisation (WHO), between 2000
and 2016, the number of people exposed to
heatwaves was estimated to have increased
by around 125 million. The average length of
individual heatwave events was 0.37 days
longer, compared to the period between 1986
and 2008, contributing to an increased risk of
heat-related illness or death.

                                                                 The change in the number of people exposed to heatwaves in millions per year from 2000 to
                                                                 2017, relative to the 1986–2005 average. Source: Watts et al., 2018.

Gross domestic product is falling in developing countries due to increasing
temperatures
The International Monetary Fund found that for a medium and low-income developing country with an annual
average temperature of 25 °C, the effect of a 1 °C increase in temperature is a fall in growth by 1.2%. Countries
whose economies are projected to be hard hit by an increase in temperature accounted for only about 20% of global
Gross Domestic Product (GDP) in 2016. But they are home to nearly 60% of the global population, and this is
expected to rise to more than 75% by the end of the century.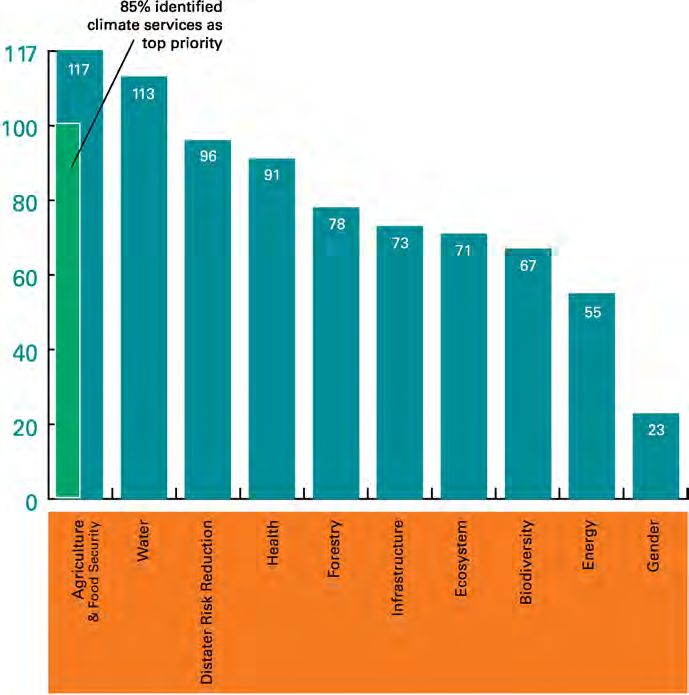
Global Fossil CO2 Emissions

Fossil fuel combustion and cement production
release about 90% of all carbon dioxide (CO2)
emissions and about 70% of all greenhouse gas
emissions from human activities. Fossil CO2
emissions continue to grow by over 1% annually
and grew by 2% in 2018, reaching a record high
of 37 billion tonnes of CO2. Although emissions
are growing slower than growth in the global
economy, showing continued progress in
reducing the carbon intensity of economic activity,
there is still no sign of a peak in global emissions.

Current economic and energy trends suggest that
emissions will be at least as high in 2019 as in
2018. Global GDP is expected to grow at 3.2% in
2019, and if the global economy decarbonized at
the same rate as in the last 10 years, that would
still lead to an increase in global emissions.
However the outlook for Chinese emissions is
quite uncertain in 2019; there are risks
associated with a potential US-China trade-war;
the carbon price in the European Union
Emissions Trading system is higher than the last
few years; and there is uncertainty over Brexit – all suggest that the global economy could grow slower than
expected. Thus, while global emissions are expected to grow in 2019, the size of the growth remains uncertain.
Emissions from the combustion of coal were thought to have peaked in 2013 and were responsible for a slowdown in
the growth rate of global emissions, but growth of coal emissions resumed in 2017. Emissions from oil and gas
continue to grow rapidly.
Global Fossil CO2 Emissions

Despite the global upward trend, emissions
from the USA and the European Union have
declined over the past decade, and growth
in China’s emissions has slowed
significantly compared to the 2000s. Indian
emissions are the fourth highest, and are
growing strongly at annual rates in excess
of 5%, albeit starting from a much lower
base of per capita emissions. More than a
hundred other countries, mainly developing,
are responsible for the remaining 40% of
emissions which also continue to grow
strongly on aggregate.
The highest per capita emissions are found
in the USA, Australia and top oil-producers
such as Saudi Arabia. Increases in energy
efficiency and renewable energy production
have led to declines in per capita emissions
in most developed economies. Per capita
emissions are rapidly growing in India and
in other developing economies.

Despite extraordinary growth in renewable
energy over the past decade, the global
energy system is still dominated by fossil
fuel sources. The annual increase in global
energy use is greater than the increase in
renewable energy, meaning fossil fuel use
and CO2 emissions continue to grow. The
net-zero emissions needed to stabilize the
climate requires both an acceleration in the
deployment of non-carbon fuels and a rapid
decline in the global share of fossil fuels in
the energy mix (or of their emissions if
technologies such as carbon capture and
storage are deployed). This dual
requirement to stabilize the climate system
illustrates the scale of the challenge.
Natural gas use is growing strongly at over
2% per year since 2013. Natural gas,
despite being the cleanest of the fossil
fuels, is still a major contributor to global
growth in CO 2 emissions and leaks
contribute to growth in methane emissions.
Global Fossil CO2 Emissions

The “waterfall” plot shows the historical contribution of CO2 emissions from different sources to the concentration of
atmospheric CO2 (measured in parts per million; ppm). Natural CO2 sinks, such as vegetation and oceans, remove
about half of all emissions from human activities. This important benefit underscores the need to reduce
deforestation and expand natural CO2 sinks, particularly those in forests and soils that can be improved by better
management and habitat restoration.

Overall, if current trends in CO2 and other greenhouse gas emissions continue over the coming decade (see figure
above), the Earth’s mean global temperature is likely to warm well above the climate targets of the Paris Agreement.
Immediate and sustained action is needed to slash fossil fuel emissions.
Greenhouse Gas Concentrations in the Atmosphere
Global Atmosphere Watch Programme (GAW)

CO2 and other greenhouse gas (GHG) concentrations continue their upward trend
Levels of carbon dioxide (CO2), methane (CH4) and nitrous oxide (N2O) have reached new highs. In 2018, global
CO2 concentration was 407.8 parts per million (ppm), 2.2 ppm higher than 2017. Preliminary data from a subset of
GHG monitoring sites for 2019 indicate that CO2 concentrations are on track to reach or even exceed 410 ppm by
the end of 2019.

               Annual Greenhouse Gas Index from 1990 to 2018 showing radiative forcing by long-lived greenhouse gases (GHGs) which
               increased by 43%, with CO2 accounting for about 80% of this increase (Source NOAA).

A full analysis for 2017 for the three main GHG shows that globally averaged atmospheric concentrations of CO2
were 405.6 ±0.1 ppm, CH4 at 1859 ±2 parts per billion (ppb) and N2O at 329.9 ±0.1 ppb. These values constitute,
respectively, 146%, 257% and 122% of pre-industrial levels (pre-1750).

CO2 is the single most important anthropogenic greenhouse gas in the atmosphere, contributing about 66% of the
radiative forcing by long-lived greenhouse gases. It is responsible for about 82% of the increase in radiative forcing
over the past decade and over the past five years. The atmospheric CO2 concentration levels always represent a
balance between emissions in the atmosphere and sinks in the oceans and the land biosphere.
The growth rate of CO2 averaged over three consecutive decades (1985–1995, 1995–2005 and 2005–2015)
increased from 1.42 ppm/yr to 1.86 ppm/yr and to 2.06 ppm/yr with the highest annual growth rates observed during
El Niño events. The globally averaged CO2 mole fraction in 2017 was 2.2 ppm higher than the previous year.

Methane contributes ~17% of the radiative forcing by long-lived greenhouse gases. Approximately 40% of methane
is emitted into the atmosphere by natural sources (for example, wetlands and termites), and about 60% comes from
anthropogenic sources (for example, ruminants, rice agriculture, fossil fuel exploitation, landfills and biomass
burning). Globally averaged CH4 calculated from in-situ observations in 2017 was 7 ppb higher with respect to the
previous year.
Greenhouse Gas Concentrations in the Atmosphere
Global Atmosphere Watch Programme (GAW)
Globally averaged CO2 mole fraction (ppm) from 1984 to 2017. Observations
from 129 stations have been used for this analysis, (Source:GAW) Globally averaged CH4 mole fraction (ppb) from 1984 to 2017. Observations
from 126 stations have been used for this analysis ( Source: GAW).
Globally averaged N2O mole fraction (ppb) from 1984 to 2017. Observations from
96 stations have been used for this analysis (Source:GAW).
The mean annual increase of CH4 decreased from ~12 ppb/yr during the late 1980s to near zero during 1999–2006.
However, since 2007, atmospheric CH4 has been increasing again.
Nitrous oxide contributes ~6% of the radiative forcing by long-lived GHGs. It is the third most important individual
contributor to the combined forcing. N2O is emitted into the atmosphere from both natural (about 60%) and
anthropogenic sources (approximately 40%), including oceans, soils, biomass burning, fertilizer use, and various
industrial processes. The globally averaged N2O mole fraction in 2017 was 0.9 ppb above the previous year.The Emissions Gap - Where we are and where we need to be
Global emissions show no sign of peaking Global greenhouse gas emissions per type of gas
60
Global greenhouse gas emissions have grown at a rate of GHG w LUC
1.6% per year from 2008 to 2017, reaching a record high of GHG w/o LUC
53.5 Gigatons of CO2 equivalent (GtCO2e) in 2017, including 50 CO2 w/o LUC
emissions from land-use change. Preliminary findings from the CH4
LUC
Emission Gap Report 2019 indicate that emissions continued N2O
to rise in 2018. Global emissions are not estimated to peak by 40 F-gas
2030, let alone by 2020, if current climate policies and ambition
GtCO2e
levels of the Nationally Determined Contributions (NDCs) are
continued. 30
Collectively, G20 members are projected to achieve the
Cancun pledges, which consist of economy-wide emission 20
reduction targets, by 2020, but they are not yet on track to
realize their NDCs for 2030.
Concerns about the current level of both ambition and action 10
are amplified in the 2018 and forthcoming 2019 Emissions Gap
Reports compared to previous reports.
0
1970 1980 1990 2000 2010 2017
Source: UNEP Emissions Gap Report (2018)
The gap is larger than ever 70
The Emissions Gap in 2030
The emissions gap in 2030 between
No policy baseline
emission levels under full
implementation of conditional NDCs 60
Current policy scenario
and levels consistent with least-cost Unconditional NDC scenario
pathways to the 2 °C target is 13
GtCO2e. If only the unconditional NDCs Conditional
50
NDC scenario 15
are implemented, the gap increases to
Uncond. NDC case
13 32
GtCO2e
Cond. NDC case
15 GtCO2e. The gap in the case of the 29
GtCO2e
GtCO2e
Remaining gap GtCO2e
1.5 °C target is 29 GtCO2e and 32 Turquoise area shows to stay within
Uncond. NDC case
pathways limiting global 2°C 2°C limit
Cond. NDC case
GtCO2e respectively. The gap numbers 40 temperature increase to
below 2°C by 2100 with
range
Remaining gap
increased in 2018 compared with 2017, about 66% chance
to stay within
mainly as a result of the more detailed Green area shows pathways 1.5°C
1.5°C limit
and diverse literature on 1.5 °C and 2°C limiting global temperature range
30 increase to below 1.5°C by
2100 with about 66% chance
pathways prepared for the IPCC
Special Report on 1.5 °C. Only minor
changes to the gap numbers are 70
expected in the 2019 report. 20 No policy baseline
2015 2020 2025 2030 60 Current policy scenario
Unconditional NDC scenario
Conditional NDC scenario
50
2°C
40 range
30
20
1.5°C
range
10
0
Source: UNEP Emissions Gap Report (2018) 2010 2020 2030 2040 2050The Emissions Gap - Where we are and where we need to be
The current NDCs are estimated to lower global emissions in 2030 by up to 6 GtCO2e compared to a continuation of
current policies. This level of ambition needs to be roughly tripled to be aligned with the 2 °C goal and increased
around fivefold to align with the 1.5 °C goal.
Implementing the unconditional NDCs, and assuming that climate action continues consistently throughout the
twenty-first century, would lead to a global mean temperature rise between 2.9 °C and 3.4 °C by 2100 relative to pre-
industrial levels, and continuing thereafter. Implementation of the conditional NDCs would reduce these estimates by
0.2 °C in 2100.
Technically, it is still possible to bridge the gap in 2030 to ensure global warming stays below 2 °C and 1.5 °C. The
sectoral emission reduction potential in 2030 is estimated to be up to between 30 and 40 GtCO2e.
However, if NDC ambitions are not increased urgently and backed up by immediate action, exceeding the 1.5 °C goal
can no longer be avoided. If the emissions gap is not closed by 2030, it is very plausible that the goal of a well-below
2°C temperature increase is also out of reach.
A substantial part of the technical potential can be realized through scaling up and replicating existing, well-proven
policies that simultaneously contribute to key sustainable development goals. Remarkably, the potential available in
just six relatively well-developed areas as shown (below left) present a combined potential of up to 21 GtCO2e per
year by 2030.
Total emission reduction basic potentials compared to the current
policy scenario for 2030
Annual Global Total Greenhouse Gas Emissions (GtCO₂e) Sectoral emission reduction potentials in 2030
70
Energy
sector
Industry
60 Forestry
Emission
reduction
potential (2030) Transport
- basic options
Buildings
50
Current
policy scenario
Agriculture
Other
40
2015 2020 2025 2030 2035 0 2 4 6 8 10 12 14
Source: UNEP Emissions Gap Report (2017)
The use of carbon pricing to reduce greenhouse gas emissions is still only emerging in many countries and is
generally not applied at a sufficient level to facilitate a real shift towards low-carbon societies. Even when considering
energy-specific taxes together with explicit carbon pricing policies, half of the emissions from fossil fuels are not
priced at all, and only 10% of global emissions from fossil fuels are estimated to be priced at a level consistent with
limiting global warming to 2 °C.
If all fossil fuel subsidies were phased out, it would lead to a reduction of global carbon emissions of up to about 10%
by 2030.The Emissions Gap - Where we are and where we need to be
Effective carbon rates on energy use across 42 OECD and G20 countries (estimate
for 2018) and the minimum carbon price range needed in 2020 for the 2°C target
200
180
160
Effective carbon rate (€/tCO2)
140 Effective
Carbon Rate
120
100
80
€34 - 68
60 2020 Minimum carbon price
range for the 2°C target
40
20
0
0% 10% 20% 30% 40% 50% 60% 70% 80% 90% 100%
CO2-emissions from energy use
Only about 10% of emissions
For almost 50% of emissions, are priced at a level consistent
the effective carbon rate is zero. with the 2°C target.
Source: UNEP Emissions Gap Report
At the global scale, the stock of coal-fired power plants is still increasing, as are emissions from coal. The existing
stocks, in combination with what is currently planned and under construction (assuming standard lifetimes and usage
rates), account for a significant share of the available carbon budget for a 2 °C target, and would make a 1.5 °C
target infeasible.
Avoiding further lock-in and facilitating a balanced transition out of coal for power production will therefore be
essential for the success of global mitigation efforts.
Emissions committed to the atmosphere from coal-fired power plants
(existing, under construction and planned) and other economic sectors, by region
2°C budget with
>66% probability
1150-1250 GtCO�
from 2016
1.5°C budget with
>50% probability
560-660 GtCO�
from 2016
Source: UNEP Emissions Gap Report (2017)
Finally, non-state and subnational action plays an important role in delivering national pledges. Emission reduction
potential from non-state and subnational action could ultimately be significant, allowing countries to raise ambition,
but currently such impacts are extremely limited and poorly documented. Coordinated, comparable and transparent
reporting and verification of actions by all actors is essential to clarify effects and possible overlaps.Intergovernmental Panel on Climate Change (IPCC)
2018 and 2019 Special Reports
The Intergovernmental Panel on Climate Change (IPCC) assesses the state of
knowledge about climate change. It is currently preparing its Sixth Assessment Report.
The three Working Group contributions will be released in 2021, followed by the
Synthesis Report in early 2022, in time for the Global Stocktake in 2023 when
governments will review the Paris Agreement and their NDCs under the Agreement. In
addition, three Special IPCC Reports released in 2018 and 2019 take a deeper dive into
assessing complementary and specific aspects of climate change.
Limiting temperature to 1.5 ºC above pre-industrial levels would provide benefits
and avoid significant risks
Global Warming of 1.5 ºC: An IPCC Special Report on the impacts of global warming of 1.5 ºC above pre-industrial
levels and related global greenhouse gas emission pathways, in the context of strengthening the global response to
the threat of climate change, sustainable development, and efforts to eradicate poverty was released in October
2018 and transformed the public discussion around climate change. Key findings include:
• Climate change is already affecting people, ecosystems and livelihoods all around the world.
• Limiting warming to 1.5 ºC is not physically impossible but would require unprecedented transitions in all aspects of
society.
• There are clear benefits to keeping warming to 1.5 ºC compared to 2 ºC or higher. Every bit of warming matters.
• Limiting warming to 1.5 ºC can go hand in hand with reaching other world goals such as achieving sustainable
development and eradicating poverty.
Climate change exacerbates the effect of a growing human pressure on land,
coordination on improved land use is needed
Climate Change and Land, an IPCC special report on climate change, desertification, land degradation, sustainable
land management, food security, and greenhouse gas fluxes in terrestrial ecosystems was released on 8 August
2019. Key findings include:
• Land is a critical resource – we rely on it for food, water, health and wellbeing – but it is already under growing
human pressure. Climate change is adding to these pressures. Agriculture, food production, and deforestation
are major drivers of climate change.
• Coordinated action to tackle climate change can simultaneously improve land, food security and nutrition, and
help to end hunger.
• The way we produce our food matters; dietary choice can help reduce emissions and pressure on land.
• There are things we can do to both tackle land degradation and prevent or adapt to further climate change.
• The land that we are already using could feed the world in a changed climate and provide biomass for renewable
energy, but it would require early, far-reaching action across several fronts.
• Better land management also supports biodiversity conservation.
• Tackling this challenge requires a coordinated response.
• Better land management can play its part in tackling climate change, but it cannot do it all.Intergovernmental Panel on Climate Change (IPCC)
2018 and 2019 Special Reports
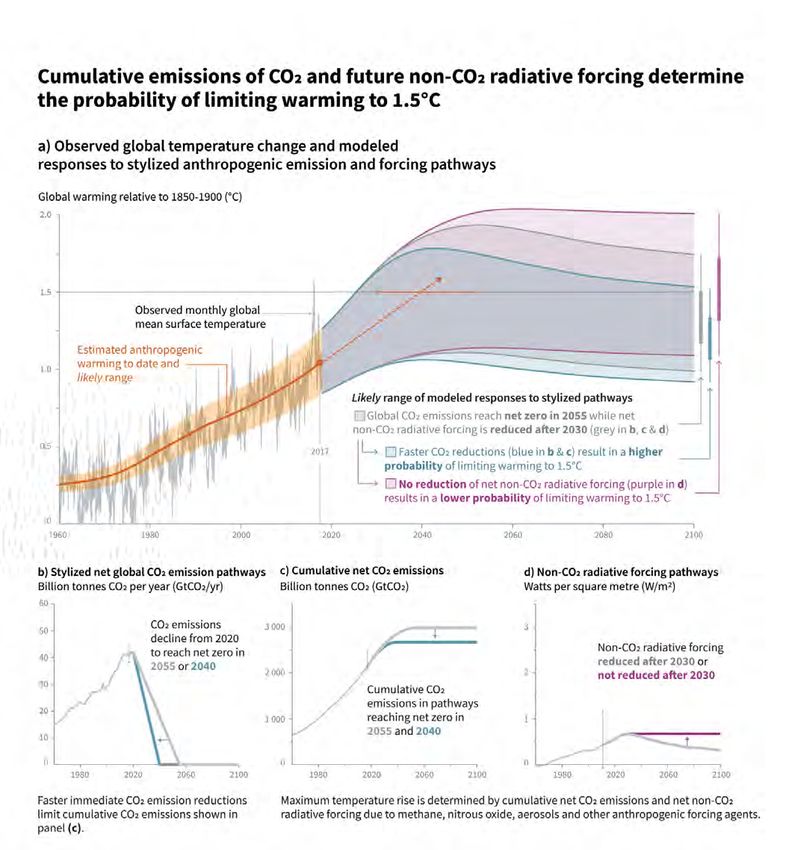
Figure (SPM.1) from the Summary for Policy Makers report of the IPCC special report on Global Warming of 1.5 °C Panel a: Observed monthly global
mean surface temperature (GMST, grey line up to 2017, from the HadCRUT4, GISTEMP, Cowtan–Way, and NOAA datasets) change and estimated
anthropogenic global warming (solid orange line up to 2017, with orange shading indicating assessed likely range). Orange dashed arrow and
horizontal orange error bar show respectively the central estimate and likely range of the time at which 1.5°C is reached if the current rate of warming
continues. The grey plume on the right of panel a shows the likely range of warming responses, computed with a simple climate model, to a stylized
pathway (hypothetical future) in which net CO2 emissions (grey line in panels b and c) decline in a straight line from 2020 to reach net zero in 2055
and net nonCO2 radiative forcing (grey line in panel d) increases to 2030 and then declines. The blue plume in panel a) shows the response to faster
CO2 emissions reductions (blue line in panel b), reaching net zero in 2040, reducing cumulative CO2 emissions (panel c). The purple plume shows the
response to net CO2 emissions declining to zero in 2055, with net non-CO2 forcing remaining constant after 2030. The vertical error bars on right of
panel a) show the likely ranges (thin lines) and central terciles (33rd – 66th percentiles, thick lines) of the estimated distribution of warming in 2100
under these three stylized pathways. Vertical dotted error bars in panels b, c and d show the likely range of historical annual and cumulative global net
CO2 emissions in 2017 (data from the Global Carbon Project) and of net non-CO2 radiative forcing in 2011 from AR5, respectively. Vertical axes in
panels c and d are scaled to represent approximately equal effects on GMSTIntergovernmental Panel on Climate Change (IPCC)
2018 and 2019 Special Reports
On 25 September 2019, the IPCC is due to release a Special Report on the Ocean and Cryosphere
in a Changing Climate. The cryosphere comprises the frozen components of the Earth system
including snow, glaciers, ice sheets and ice shelves, icebergs and sea ice, ice on lakes and rivers
and permafrost and seasonally frozen ground. The report will examine high mountain areas; polar
regions; sea-level rise and implications for low-lying islands, coasts and communities; the changing
ocean, marine ecosystems and dependent communities; and extremes, abrupt changes and
managing risks.Climate Insights Future Earth and Earth League Consolidated evidence (on climate, extreme weather, oceans and land) reinforces human influence as the dominant cause of changes to the Earth system, in a new geological epoch, the Anthropocene. New research shows that the current CO2 concentration in the atmosphere is unprecedented over the past three million years and that global temperature never exceeded the preindustrial value by more than 2 °C during that time. A combination of Earth’s orbital cycles in constant interplay with biogeochemical processes, such as greenhouse gas regulation on land and in the ocean, accounted for the long-term stability during that time, and there is new understanding that these interactions are changing. The effect of anthropogenic climate change on the increasing frequency and/or intensity of extreme events is becoming more compelling in a number of case studies. For example, science has improved our understanding of how interconnections among ocean currents, ice sheets, and heat exchange in the atmosphere and land play a major role in accelerating warming and extreme weather events. Recent examples include confirmation that a slow- down of the jet stream – fast moving winds in the upper atmosphere - was directly related to record-breaking heatwaves across North America, Europe and Asia in 2018 and 2019, and that a series of extreme rainfall events were connected, despite being thousands of kilometres apart, and were also linked to the jet-stream pattern. Sea-level rise and ocean acidification are other important indicators of climate change, and both are accelerating with major consequences for coastal communities and habitats. The rate of sea-level rise has increased in the period 2007-2016 to approximately 4mm/yr, well above the long term trend of 3mm/yr. Ocean acidification is progressing an order of magnitude faster today than at any previous time. We now also know that human land use directly affects more than 70% of Earth’s ice-free land surface and that an estimated 23% of total greenhouse gas emissions (2007-2016) originate from agriculture, forestry and other land use activities. Land use and land use change also impact systems beyond climate, causing loss of biodiversity and ecosystem services. Growing climate impacts increase the risks of crossing critical tipping points. Tipping points in the Earth System refer to thresholds that, if crossed, lead to far-reaching, in some cases abrupt and/or irreversible changes. With continued warming, systems can reach tipping points where they rapidly collapse or a major, largely unstoppable transformation is initiated. Scientists have studied plausible pathways to a “Hothouse Earth” scenario, where interacting tipping points could potentially lead to a cascading effect where Earth’s temperature heats up to a catastrophic 4 °C – 5 °C. Another study estimates that unmitigated emissions could reverse a multimillion-year cooling trend in less than two centuries. There are large differences in the magnitude and risks of climate change impacts between 1.5°C and 2°C of warming. For example, limiting warming to 1.5°C relative to 2°C can avoid the inundation of lands currently home to about five million people, including 60,000 people currently residing in Small Island Developing States.
Climate Insights
  Future Earth and Earth League

Half a degree of additional warming can also heighten risk in our social systems with impacts like large-scale
migration and civil unrest. Extreme and changing weather can undermine livelihoods, threaten infrastructure
increase food insecurity and compromise the ability of states to provide conditions for human security, especially
where there is existing political instability.

Key processes that currently keep the climate stable are weakening, risking the establishment of feedback loops
(e.g. loss of Arctic sea ice or forest dieback) that could hinder efforts to stabilize the climate, even as emissions are
reduced. For example, the extreme case of a complete disappearance of Arctic sea ice during the sunlit part of the
year, while unlikely in the short term, could accelerate warming by 25 years.
The stability of the Earth system is influenced by feedbacks between the climate system and carbon-regulating
processes such as frozen soils in permafrost or carbon uptake by forests. There is a growing understanding of the
critical role of these biosphere carbon feedbacks in stabilizing the climate system and that those processes are
loosing strength, thereby increasing the risk that self-reinforcing mechanisms become relevant and counterplay
efforts to mitigate further climate change. Examples include the reduced carbon sink and carbon retention capacity
of land and soils in the tropics, or the release of CO2 and methane from thawing permafrost soils.

There is a growing recognition that climate impacts are hitting harder and sooner
than climate assessments indicated even a decade ago.
Since 2001, the IPCC has published a science-based risk assessment of several Reasons for Concern (RFC) to
illustrate the impacts of different levels of warming for people, ecosystems and economies worldwide. A comparison
of these from 2001 to 2018 (including an update in 2009) shows the evolution of the assessment - the level of risk
has increased with each subsequent analysis.
Climate Insights
 Future Earth and Earth League

As climate change intensifies, cities are particularly vulnerable to impacts such as
heat stress and can play a key role in reducing emissions locally and globally.
Heatwaves now pose a recurring challenge on all inhabited continents and generate an increasing range of threats
to human lives and well-being, particularly in cities where built environments magnify heat exposure. This matters
because close to 70% of the world’s population is expected to live in cities by 2050 and will be exposed to extreme
heat if no actions are taken to modify urban environments. A study of the 1692 largest cities in the world found that
about 60% of the urban population has already experienced warming twice as large as the world during the
1950-2015 period.
As cities consume about 78% of the world’s energy and produce more than 60% of all CO2 emissions their actions
are central to minimizing the rise in global mean temperature. In particular, shifts towards cleaner energies will not
only reduce greenhouse gas emissions, but will also reduce localized air pollution and heat island effects within
cities.

The cities of the world are thus key players for stepping up climate action. Commitments have been made by more
than 9,000 cities in 128 countries, home to 16 % of the global population.

Strategies for mitigation and for upscaling adaptive risk management are
necessary going forward. Neither is adequate in isolation given the pace of climate
change and magnitude of its impacts.
A mitigation-only strategy will not be effective because many changes are already underway and are now
unavoidable. Similarly, an adaptation-only strategy will become more costly (the annual cost of adaptation is
estimated in the range of US$ 140 - US$ 300 billion by 2030) as the magnitude of climate change increases.
Currently only 40 developing countries have quantifiable adaptation targets in their current Nationally Determined
Contributions and many existing targets are relatively short-term, not going beyond 2020. So, our resilience and
adaptive capacities must still be strengthened to deal with committed climate impacts and to plan to manage residual
risks that will remain in the long term despite mitigation actions.

Only immediate and all-inclusive action encompassing: deep decarbonization
complemented by ambitious policy measures, protection and enhancement of
carbon sinks and biodiversity, and efforts to remove CO2 from the atmosphere, will
enable us to meet the Paris Agreement.

      Deep decarbonization
      Pathways to limit warming to 1.5 °C require halving global emissions every decade from 2020 onward
      and respecting a global carbon budget – around 420–570 billion tons total net CO2 emitted to the
      atmosphere. Such deep decarbonisation also requires major transformations in all of society’s socio-
      technical systems starting with the energy and food sectors as pivotal first adopters.
      In the energy sector, social and technological innovations coupled with strong efficiency standards can
      potentially reduce the energy demand without compromising global living standards, especially as
      readily-available technological substitutions already exist for more than 70% of today’s emissions. The
      speed of the transformation will also be decided by the growing political, technological and economic
      momentum of renewable energy. Between 2006 and 2016, solar and wind power have gone from a
      combined 0.7% to 5% share of global electricity production, doubling their output every 3 years while
      dropping in price.
Climate Insights
Future Earth and Earth League
In the food sector, new research confirms that a global transformation to healthier diets (including
reduced meat consumption) and a more sustainable food production system is critical to achieve the
Paris Agreement and could avert up to 11 million deaths per year.
Ambitious policy measures
Stronger and more diverse policy measures for rapid decarbonization are essential elements of climate
policy to achieve the Paris Agreement:
• Fiscal reforms: Both tax reforms and emissions trading systems (ETS) can be elements of the
necessary transformation towards a single, cross-sectoral carbon price, along with a phase out of
fossil fuel subsidies. To achieve social acceptability, fiscal reforms should consider social balance and
benefit low-income households.
• Sector-specific policy instruments: New standards and practices, incentives, moratoriums in traffic,
building and energy sectors can mediate market or policy failures and tilt development towards a
sustainable path.
Protection and enhancement of carbon sinks and of biodiversity
Protecting existing carbon sinks and biodiversity, and expanding lands from source to sink, is possible
via natural solutions that promote conservation of landscapes, restoration of degraded forested land at
global scale, and improved land management actions. Such actions could provide over one-third of the
climate mitigation needed between now and 2030 to stabilize warming to below 2 °C and can help
reverse some of the adverse impacts of climate change on land degradation.
CO2 removal
To achieve the 1.5°C target, approximately 100–1000 billion tons of CO2 must be removed from the air
during this century. To do so, a range of negative emissions technologies (NETs) have been proposed,
from re- and afforestation to bioenergy with carbon capture and storage (BECCS) or direct air capture of
CO2. These differ widely in terms of maturity, potentials, costs, risks, co-benefits and trade-offs. NETs
play an essential role in mitigation scenarios in accordance with the Paris Agreement – but to a scale
much larger than currently tested and deployed. There is also a risk that they may be used to delay
implementing emissions reduction policies. While NETs will be indispensable in combination with other
mitigation efforts, especially to counterbalance emissions sources such as from aircraft or cattle, large-
scale deployment options are limited with feasibility constraints and increasing sustainability trade-offs.
Furthermore, new assessments indicate that few of these large-scale removal options could be available
before 2050, thus such techniques cannot be relied on over the next several decades, which is the
timescale relevant for achieving the Paris Agreement.Global Climate Services Capacity
A global report on the State of Climate Services capacities will be released for the first
time at COP 25 in December, in Chile. In addition to WMO, current contributors include
the Adaptation Fund, CGIAR Research Program on Climate Change Agriculture and
Food Security (CCAFS), Food and Agriculture Organization, the Green Climate Fund, the
Global Environment Facility, the World Bank Group (WBG), the World Bank Global
Facility for Disaster Reduction and Recovery and World Food Programme (WFP)
Climate and early warning information services should underpin decision-making
on climate action for adaptation.
The Global Framework for Climate
Services was established in 2009 with
the vision to enable better management
of the risks of climate variability and
change, through the development and
incorporation of science-based climate
information and prediction into planning,
policy and practice addresses the critical
elements for effective provision and
uptake of seamless weather, water and
climate services, namely: observations
and monitoring; research; modelling and
prediction; climate services information
system; user interface platform; and
capacity building.
With the appropriate capacities,
countries will provide tailored, science-
based information that helps people
from policymakers to farmers make
better decisions about how to adapt to
the challenges of climate variability and
change.
Availability of this information is
essential in addressing the adaptation
needs highlighted in NDCs.
The majority of countries’ NDCs
highlight agriculture, food security and
water as the top priority sectors for
climate change adaptation (WMO and
FAO, 2019). In the area of agriculture
and food security, 85% of countries
(100/117) identified “climate services” as
being a valuable part of planning and
decision-making.Global Climate Services Capacity The capacities of countries to deliver climate and early warning information services varies across regions. The capacity of countries to benefit from climate services depends on several factors. These range from the observations and monitoring of weather and climate events to the aggregation and combination of climate data with socio-economic data and effective delivery of services to end users. As highlighted by the FAO and the WFP, the accessibility of these services, such as covering last mile delivery to farmers, is especially critical. Equally important, according to CCAFS, is the continual refining and improvement of raw data for climate information to ensure the information is both accurate and actionable. The capacities of countries to deliver climate and early warning information services varies across regions. Overall, available data suggest that there has been progress on governance, implementation of basic hydro-meteorological systems and stakeholder engagement for the implementation of climate services but the set of functional capacities focused on monitoring and evaluation of the results and benefits of the use of climate services remains weak. WMO Member capacities across selected hydro-meteorological system functions across 137 functional areas (Source: WMO)
For more information please visit:

public.wmo.int/en/resources/united_in_science
You can also read