Universal Credit and Crime - IZA DP No. 13484 JULY 2020 Rocco d'Este Alex Harvey - Institute of Labor Economics
←
→
Page content transcription
If your browser does not render page correctly, please read the page content below
DISCUSSION PAPER SERIES

IZA DP No. 13484

Universal Credit and Crime

Rocco d’Este
Alex Harvey

JULY 2020
DISCUSSION PAPER SERIES

IZA DP No. 13484

Universal Credit and Crime

Rocco d’Este
University of Sussex and IZA
Alex Harvey
University of Sussex

JULY 2020

Any opinions expressed in this paper are those of the author(s) and not those of IZA. Research published in this series may
include views on policy, but IZA takes no institutional policy positions. The IZA research network is committed to the IZA
Guiding Principles of Research Integrity.
The IZA Institute of Labor Economics is an independent economic research institute that conducts research in labor economics
and offers evidence-based policy advice on labor market issues. Supported by the Deutsche Post Foundation, IZA runs the
world’s largest network of economists, whose research aims to provide answers to the global labor market challenges of our
time. Our key objective is to build bridges between academic research, policymakers and society.
IZA Discussion Papers often represent preliminary work and are circulated to encourage discussion. Citation of such a paper
should account for its provisional character. A revised version may be available directly from the author.

                                                     ISSN: 2365-9793

                                           IZA – Institute of Labor Economics
Schaumburg-Lippe-Straße 5–9                      Phone: +49-228-3894-0
53113 Bonn, Germany                             Email: publications@iza.org                                    www.iza.org
IZA DP No. 13484 JULY 2020
ABSTRACT
Universal Credit and Crime*
We evaluate the criminogenic effects of Universal Credit (UC), a monumental welfare
reform designed to radically change the social security payment system in the United
Kingdom. We exploit the UC rollout across constituencies using monthly data from 2010
to 2019 for England and Wales. We find UC has caused around 45,000 burglaries, with
criminogenic effects lasting until the end of the sample period and expected to grow
considerably by the time UC is fully rolled out when 6.5 million more individuals will use
the system. The analysis suggests the worsening of benefit recipients’ financial conditions
as the key mechanism.
JEL Classification: K14, K42
Keywords: universal credit, benefits, welfare system, crime
Corresponding author:
Rocco d’Este
Department of Economics
University of Sussex
Brighton BN1 9RH
United Kingdom
E-mail: R.D-Este@sussex.ac.uk
* This paper builds upon, improves, and supersedes Alex Harvey’s MSc in Economics Dissertation at The University
of Sussex (Academic Year 2018/2019).1. Introduction
Universal Credit (UC) is a monumental welfare reform that has drastically changed the
social security payment system in the United Kingdom. The main objective of Universal
Credit is to reduce welfare dependency through greater incentives for claimants to enter
employment and take greater responsibilities for their finances. UC is designed to replace
six benefits for working-age people with low-income, currently administered separately. It
has introduced major changes to the previous benefit schemes. Including a fully digitised
service, monthly payments in arrears rather than prospectively each week or fortnight,
increased conditionality, a tougher regime of sanctions, and reduced payments to some
claimant groups (Brewer et al., 2019). The impact of Universal Credit has been widely
criticized and it has generated enormous controversy. Mounting evidence in sociology,
political science, and medical literature suggests Universal Credit has led to increased food
bank usage, consultations in general practices, landlord repossession rates, and created
mental health difficulties amongst claimants (Arie, 2018; Loopstra et al., 2018; Cheetham
et al., 2019; Hardie, 2020; Wickham et al., 2020).
This paper contributes to the Economics literature by providing the first empirical
evaluation of the criminogenic effects of Universal Credit based on quasi-experimental
methods and high-frequency data. In particular, we exploit the staggered rollout of the
welfare reform across parliamentary constituencies using monthly data for all
constituencies in England and Wales from December 2010 to February 2019. We conduct
difference-in-differences and instrumental variable (IV) analysis that allow to identify
credible estimates of the impact of Universal Credit on crime.
2We argue our analysis is of timely importance for two reasons. Firstly, UC will directly
affect the lives of around eight million low-income benefit recipients by the time it is fully
rolled out in 2024 (Kennedy and Keen, 2018). Therefore, even minor individual
criminogenic effects will likely have major societal implications due to the growing number
of recipients soon to be exposed to the new system. Second, other countries are evaluating
possible reforms to their benefit schemes mirroring the new practices adopted by Universal
Credit (Wickham et al., 2020). Arguably, the need for such reforms has recently intensified
due to the extreme pressure that welfare systems are experiencing worldwide because of
the health pandemic. Thus, a credible evaluation of the criminogenic impacts of Universal
Credit is critical as it can inform policy makers across the globe regarding possible criminal
consequences of analogous welfare reforms, and it can help designing ad hoc measures that
minimize these unwarranted effects.
We find Universal Credit has caused around 45,000 burglaries since its implementation.
Effects are precisely estimated and hold against numerous robustness checks such as
including an extensive set of socio-economic covariates, constituency-specific linear and
quadratic trends, constituency-by-month fixed effects, changes to the sample of analysis
and the functional forms used. Also, a placebo test randomly permutes the month of
adoption across constituencies and confirms that the criminogenic effects we detect are
not driven by spurious correlations.
An event study analysis provides further reassurance regarding the validity of our
difference-in-differences design and it reduces the concerns ‘pre-trends’ in crime might be
confounding the causal interpretation of our estimates, or inflating the results. This analysis
also shows the criminogenic effects of the reform emerge ‘on impact’, grow over time, and
last until the end of the sample period. These long lasting effects are not surprising given
3the increase in the number of benefit claimants exposed to the new reform that has grown
from 220,000 in April 2016, when Universal Credit was first offered in all constituencies
but only to a selected number of applicants, to over 1.5 million claimants in February 2019,
the final month in our sample.
This evidence leads us to investigate the criminogenic effects at the intensive margin,
that is the number of benefit recipients enrolled in the new welfare system. A simple
Ordinary Least Square (OLS) regression could be biased because of the possible correlation
between changes in the number of UC claimants and unobservable crime determinants.
We address endogeneity concerns by implementing an IV design exploiting quasi-
experimental variation in the number of claimants provided by the staggered rollout of the
program across constituencies. Compared to the findings in the literature, we find
moderate crime elasticities, precisely estimated (Draca and Machin, 2015). This suggests
small individual criminogenic effects driven by a minority of Universal Credit recipients.
Results are robust to the inclusion of an extensive set of socio-economic covariates and
fixed effects, reducing the concerns our IV estimates may be biased upward due to
violation of the exclusion restriction.
Overall, the evidence points toward a unique conclusion. The criminogenic effects of
Universal Credit are likely due to a substantial worsening of the financial conditions of
some UC recipients: This has increased their incentives to commit crime to supplement
their income. The income loss is likely due to the regressive distributional effects of
Universal Credit (Brewer et al., 2019); the payment delays that arguably hit harder poorer
recipients at the bottom of the distribution; and the increased number and severity of
sanctions towards young males reducing income available to a subpopulation of claimants
likely characterized by high criminal propensity (Grogger, 1998).
4Our findings are important for policy makers and academics alike. The estimated crime
elasticity and the upward trajectory of the criminogenic impacts highlight the urgency of
addressing underlying issues responsible for the rise in crime. In fact, around 6.5 million
more low-income individuals will use the new system by 2024. Arguably, this increases the
likelihood of observing larger criminogenic impacts in the near future. It also outlines the
importance of considering measures aimed at re-balancing the incentives of benefit
recipients, particularly of those belonging to categories at risk of high criminal propensity.
This could be achieved by smoothing the distributional impact of Universal Credit as it is
currently affecting recipients at the bottom of the income distribution to a greater extent
(Brewer et al., 2019). Undoubtedly, the decision to implement such measures will have to
take into account other possible individual responses, such as those along the employment
margin, not examined in this paper. However, we are convinced that our findings provide
impetus for government measures aimed at minimizing the inappropriate operational
practices of Universal Credit, such as payment delays, that are unnecessarily affecting the
financial position of poor beneficiaries at the margins of crime.
Related Literature. By providing the first empirical evaluation of the criminogenic
effects of Universal Credit, our paper contributes to the existing literature examining the
effects of welfare systems on crime. Our results are consistent with Machin and Marie
(2006) who study the impact of Jobseeker’s Allowance (JSA) in the UK labour market in
1996. JSA simplified the employment benefit system and brought a more stringent, tougher
regime. The researchers use quarterly data for 45 areas in England and Wales and employ
both quasi-experimental designs and qualitative evidence to show the reform generates an
increase in crime. Foley (2011) exploits plausibly exogenous variation in the timing of
benefit payments from the Food Stamp Program across twelve US cities. Temporal
5patterns in crime are observed in jurisdictions where disbursements happen with monthly-
frequency, but not in jurisdictions in which disbursements are relatively more staggered,
suggesting benefit recipients consume welfare related income quickly and then commit
crime to overcome hardship later in the month. Carr and Packham (2019) look at the
impact on crime of the Supplemental Nutrition Assistance Program (SNAP)—an in-kind
transfer providing food-purchasing assistance for around 45-million low income
Americans each year. Similar to Foley (2011), they find the timing of nutritional aid
disbursement has an effect on crime, and staggering benefits disbursement over the month
leads to large reductions in theft crimes at grocery stores. Universal Credit has also altered
the frequency of payments, from weekly or fortnightly, to monthly. Therefore, this can be
a possible channel behind our results. However, we note UC still allows payments to be
staggered during the month in a wide variety of circumstances. In fact, this happens in the
most problematic cases, when the ‘work coach’ identifies the claimant has addiction
problems, rent arrears, was previously homeless, or any situation where the claimant
request it with a valid reason (Department for Work and Pensions, 2020). This leads us to
believe that the change in payment frequency may not be the major force behind our
results.3
Our analysis detects the criminogenic effects of Universal Credit, a welfare program
directly affecting the lives of low-income individuals. We also show effects are stronger
when only unmarried, unemployed, younger claimants without children are admitted to the
program, and in constituencies with house prices below the national median. Therefore,
3
Another compelling analysis is conducted by Bindler (2016) who studies the relationship between
unemployment benefits, labour market conditions and crime in the light of increasing unemployment
durations and temporary benefit extensions in the US. Interestingly, she detects a longer time in benefit
leads to an increase in criminal activity. This is because longer benefits increase unemployment durations
that, in turn, contributes to the increased criminal propensity.
6our paper contributes to the literature examining economic incentives affecting individuals
at the bottom of the income distribution with high-criminal propensity, such as young
unskilled individuals or individuals with criminal records. Grogger (1998) presents a
complete picture of the choice to supply labour to either the illegal or the formal labour
market. He focuses on the National Longitudinal Survey of Youth (NLSY) cohort data
and finds a high-proportion of individuals committing crime are also employed in the
labour market, and are therefore sensitive to changes in legal wages. Gould et al. (2002)
investigate the effects of unemployment and wages on the criminal behaviour of less
educated young males using a Bartik type of approach. They find both wages and
unemployment are significantly related to crime, but wages have larger criminogenic
effects. Machin and Meghir (2004) examine the extent to which crime is related to the
worsening of labour market conditions of less skilled workers in England and Wales from
the mid-1970s to the mid-1990s. They use a wage measure based on the 25th percentile of
the distribution for the retail trade sector as this sector is a major employer of low-skill
workers and show changes in wages at the bottom of the distribution lead to significant
changes in crime. Our findings, showing an increase in acquisitive crimes likely due to the
worsening of benefit recipients’ financial conditions associated with the introduction of
Universal Credit, are consistent with all these results.4
This paper unfolds as follows: Section 2 describes the institutional background; Section
3 presents the data; Section 4 discusses the research designs; Section 5 reports the results;
Section 6 discusses underlying channels; Section 7 concludes.
4Other work in the area includes Bell et al. (2014) who show recessionary conditions at the point of school
exit influence participation in crime by comparing outcomes across cohorts using both US and UK data.
Schnepel (2018) finds increases in construction and manufacturing working opportunities at the time of
release from prisons are associated with significant reductions in recidivism. For a comprehensive review
of the impact of economic incentives on criminal activity see Draca and Machin (2015).
72. Institutional Background
UC Main Features. Universal Credit is a UK social security payment system legislated
in the Welfare Reform Act 2012. It is designed to fully replace the still functioning ‘Legacy
system’, by combining six benefits for working-age people with low income that are
currently administered separately.5 The integration of many benefits into one single
payment aims to simplify the payment process by avoiding multiple claims to different
government departments, also arising when claimants’ circumstances change.
Other than attempting to create a unified, more flexible system, Universal Credit aims
to incentivise claimants to take greater responsibilities for their finances and, whenever
possible, enter employment and reduce welfare dependency. To achieve these objectives,
Universal Credit has radically transformed various key features of the Legacy system, which
is scheduled to disappear by the end of 2024 (Kennedy and Keen, 2018).
First, it has reduced the marginal deduction rate: As claimants start to earn or increase
earnings, the benefit payments reduce at a slower rate compared to the Legacy system. This
aims to ease the employment transition and to ensure that taking on even a small amount
of working hours could be financially rewarding. Solving a known issue with the Legacy
system.
5 These are: Jobseekers Allowance, a transfer for unemployed individuals looking for work; Employment
and Support Allowance, a transfer for individuals that cannot find work full-time; Child Tax Credit, a means
tested transfer to families with children below an income threshold; Income Support, a means tested
transfer to individuals working fewer than 16 hours a week; Housing Benefit, a means tested transfer to
support individuals living in rented accommodation, typically claiming other benefit transfers alongside;
Working Tax Credit, a means tested transfer for individuals on low income working part time or full time.
8Second, it has introduced the Claimant Commitment, a contract between the benefit
recipient and the State, which reflects individual circumstances and defines the essential
actions the claimants must undertake to continue receiving benefits. These actions range
from not being required to find work at all (e.g. severely disabled claimants and carers) to
those required to spend up to 35 hours a week job searching. Importantly, the payment
conditionality introduced by the Claimant Commitment is complemented with a tougher
regime of sanctions. For instance, the maximum sanction of disqualification from receiving
any benefits for up to three years can be applied to those who persistently refuse to comply
with the Claimant Commitment.
Third, to mimic a typical salary, payments are made in arrears once a month directly into
the claimants bank account. Also, Housing Benefit granted as part of the overall benefit
calculation is included in the monthly payment. In the Legacy system, payments are made
weekly or fortnightly and Housing Benefit is paid directly to the landlord. In section 6, we
will discuss in more depth some of the UC measures that disproportionally affect the
financial condition of poorer households and are therefore likely to be key determinants
of the increase in criminal activity.
UC Rollout. UC was introduced as a pilot in April 2013 in selected Jobcentres in the
North West. Jobcentres, one for constituency, are government funded employment
agencies run by the Department for Work and Pensions (DWP). Jobcentres included in
the pilot scheme were selected on an administrative basis, to allow for the refinement and
the evaluation of the best practices to be exported when scaling up the program nationally.6
The policy then spread to the rest of the country following the capacity of Jobcentres,
6Universal Credit was launched as a Pathfinder in areas of the North West commencing in April 2013. The
four initial Pathfinder offices are Ashton-under-Lyne, Oldham, Warrington, and Wigan. Six further sites
rolled out between October and the spring of 2014.
9administrators, and employees to take up and absorb new methods and IT practices
connected with the implementation of Universal Credit.7 To facilitate the transition to the
new welfare system, the initial eligibility criteria for claiming UC benefits focused on the
simplest cases: New claimants, single, unemployed, non-home-owning and without
children.8 By April 2016, the national rollout of Universal Credit was completed. That is,
UC was available for new claims from single unemployed individuals in Jobcentres across
the country. In May 2016, the DWP started the expansion of Universal Credit to new
claims taken from all claimants groups, including people with health conditions, disabilities,
parents, carers, and those in employment (Kennedy and Keen, 2018). This has led to a
large increase in the number of UC recipients in each constituency.
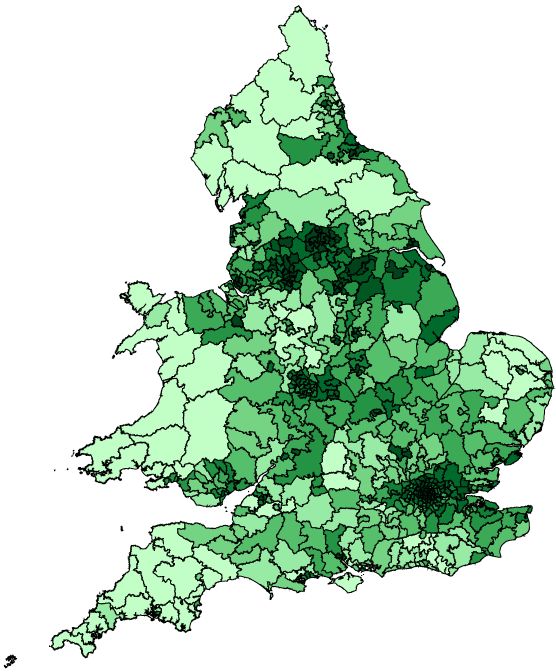
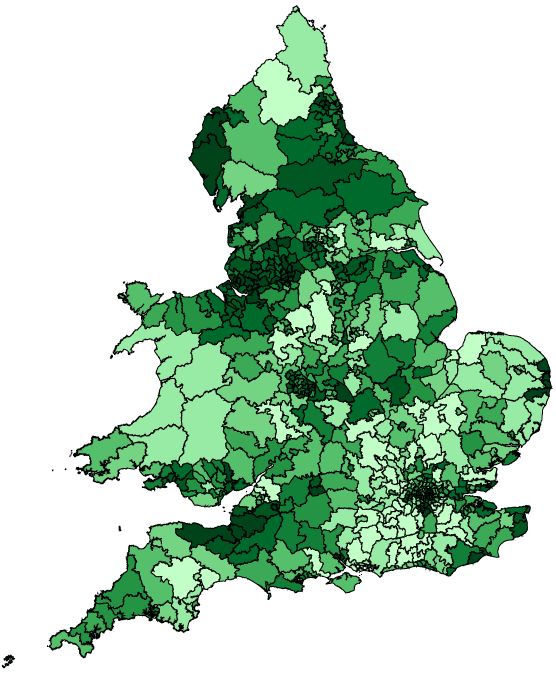
Panel A of Figure I shows the monthly rollout of Universal Credit as well as the number
of Universal Credit claims in England and Wales. As discussed, there were no UC recipients
prior to the initial rollout in the Spring of 2013. In April 2016, when Universal Credit was
offered in all constituencies for a selected category of applicants, around 220,000 claimants
were enrolled in the system. After that date, UC started to accept new applications from a
wider range of claimants, reaching over 1.5 million claimants in February 2019.9
7 The date of adoption in each jobcentre was mainly due to administrative reasons, reducing the concerns
that the introduction of Universal Credit was driven by pre-existing crime trends in the area. This hypothesis
is further supported by estimates that are robust to the inclusion of constituency-specific linear and
quadratic trends, and by the event study analysis showing that the increase in burglaries is emerging ‘on
impact’ and it is not inflated by upward crime trajectories prior to the program implementation.
8 New claimants are defined as claimants who were not enrolled in the Legacy system when UC was
operating in a constituency. It is possible these claimants were receiving benefits before the introduction of
Universal Credit but that—for any reason—left the welfare system some time prior its start.
9 The number of Legacy claims dropped from around 6.2 million in April 2013 when UC was first
introduced to around 4 million at the end of the sample period. The six Legacy benefits are administered
separately and recorded separately in our data. For this reason, we cannot calculate the exact number of
individuals claiming Legacy benefits, given that the same individual can claim multiple benefits (e.g.
Housing Benefit and Employment Support Allowance). Instead, Universal Credit data identifies the
number of claimants, given UC is a unified benefit disbursement.
10Panel B of Figure I shows the monthly change in the share of constituencies where UC
was in operation and the number of burglaries. We note the larger adoption of Universal
Credit started in 2015. Coincidentally, this was also the time when the downward trend in
the number of burglaries stopped, appearing to rise afterward.10 Importantly, the paper will
closely examine this motivating descriptive evidence using the staggered rollout of the new
welfare systems across constituencies to identify the causal impact of Universal Credit on
crime while controlling for common time trends across the country.
3. Data
Universal Credit and Crime Data. We retrieve the date (month and year) when
Universal Credit was initially rolled out in every UK constituency from The House of
Common Library, a research and information service based in the UK Parliament, which
also provides the number of UC individual claimants at the constituency-month level. We
match this information with data from UKCrimeStats, an open platform of the Economic
Policy Centre, which takes crime data obtained from official police forces and aggregates
it the constituency-month level for all constituencies in England and Wales. UKCrimeStats
data starts in December 2010 and includes data up to February 2019. 11 The match between
UC and crime data generates a balanced sample of all 573 constituencies in England and
Wales from December 2010 to February 2019 (99 year-by-month periods).
10 Monthly crime displays seasonality. Our analysis includes year-by-month fixed effects, hence controls for
changes in crime due to seasonal patterns in the data. Also, we show that results are practically unchanged
when including constituency-by-month fixed effects, which controls for crime seasonality at constituency
level.
11 Date of last access (April 2019). Data on crime are divided in the following categories: Anti-social
behaviour, bicycle theft, burglary, criminal damage and arson, drugs, other crime, other theft, possession
of weapons, public disorder and weapons, robbery, shoplifting, theft from the person, vehicle crime,
violence and sexual offenses.
11Other Data. UKCrimeStats also includes information on constituency population, and
land in hectares we use to construct population density. The DWP provides the number
of claims for Jobseekers Allowance, Employment and Support Allowance, Income
Support, and Housing Benefit through Stat-Xplore, a browser based client to explore
benefit data. HM Revenue & Customs (HMRC) provides the number of Child and
Working Tax Credit claimants.12 We also include data on median house prices provided by
the Office for National Statistics (ONS) and data on unemployment and median weekly
wages provided by the House of Common Library. Given the set of controls is potentially
endogenous to the adoption of Universal Credit, we only use it to test the sensitivity of the
baseline estimates and conduct heterogeneity analysis based on pre-reform constituency
characteristics measured in the initial sample period (December 2010).
Sample Selection. Our preferred baseline sample excludes 29 constituencies (out of
573) where Universal Credit was rolled out prior to April 2014. We make this choice for
two reasons. First, this subset of early adopter constituencies includes sites (known as
Pathfinders) where the implementation of Universal Credit was first piloted to test
claimants’ behaviour and evaluate the provisional program before national expansion
(NAO, 2013). Second, the Claimant Commitment, a central component of Universal
Credit that intensified the level of sanctions and that we will also argue may play an
important role in explaining its criminogenic effects, was officially rolled out from April
2014 (Timmins, 2016). Importantly, we show the estimates are similar, but slightly smaller
compared to the baseline and still precise under conventional significance levels, when this
subset of 29 constituencies is included in the sample. This has to be expected given the
12 Tax credits are administered by HMRC, while other benefits are administered by the DWP.
12welfare reform in this very early stage had likely less ‘bite’ because it was piloted and did
not include the Claimant Commitment clause. Table 1 provides summary statistics for the
baseline sample. These are not discussed for brevity considerations.
4. Research Designs
Difference in Differences. We use the following baseline model to estimate the effects
of Universal Credit on crime:
!",$ = b& '(",$ + +" + ,$ + -",$ (1)
where !",$ is the crime outcome in constituency c at time t (year-by-month level, e.g. July
2017). The variable of interest, '(",$ , is an indicator set to zero in the months prior to the
adoption of Universal Credit in a constituency, it takes the value of one in the month when
UC was rolled out and afterwards. Constituency fixed effects +" absorb unobservable time-
invariant differences across constituencies. Year-by-month fixed effects ,$ control for
uniform changes in criminal activity in England and Wales, fitting a different intercept for
each of the 99 periods in the sample (e.g. intercept for July 2017, intercept for August
2017). We employ a weighted least squares (WLS) estimator, using the annual population
of the constituency as weight.13 Standard errors are clustered at the constituency level and
permit valid inference in the presence of within-constituency autocorrelation in the errors.
13 WLS consistently estimates the population linear projection of the impact of Universal Credit on crime
experienced by the population in a constituency affected by the reform. Also, when population varies across
clusters, the group average error term is heteroskedastic, and the OLS estimation may be inefficient and
lead to inconsistent standard errors. The WLS estimator is the minimum variance linear unbiased estimator
that produces consistent standard errors correcting for heteroskedasticity (Solon et al. 2015).
13The coefficient of interest, b& , measures the effect on crime of Universal Credit. Crime is
log transformed using log(1+z), where z is the crime rate per 100,000 people.14
Event Study. The consistency of the results is further examined by conducting an
event-study analysis. This enriches our understanding of the impact of UC on crime in at
least two ways. First, it investigates possible ‘pre-trends’ potentially confounding the
estimates of b& . Second, it identifies the dynamics of the effects, whether the crime
responses emerge on ‘impact’ of the reform, and their persistence over time. We estimate
the following equation:
G B
1",$ = 2& 134",$ < −369 + : : 2; 1 + 1) > 4",$ ≥ 12>A + 2H 134",$ ≥ 369 + +"
;DB CDEF
+ ,$ + -",$ (2)
The indicator 4",$ measures the month relative to the introduction of Universal Credit
in a constituency. We define 4",$ = 0 if constituency c introduced Universal Credit at any
time during month t. To maximize the power of the analysis, we estimate eight
2; coefficients associated with indicator variables running for the entire sample of analysis.
The excluded coefficient is the indicator measuring the impact of Universal Credit in the
year prior to the UC launch. All other details are equal to estimating equation (1).
Difference in Differences in Differences. We estimate heterogenous impacts of the
reform across constituencies using the following equation:
!",$ = bB '(",$ +IFwhere (K",$DL is a dummy variable indicating whether a constituency characteristic
measured in period 1 of our sample (December 2010) is above the median. We measure
constituency characteristics in the initial sample period because these characteristics cannot
be affected by a welfare reform adopted more than three years later. The bB coefficient
measures the criminogenic impacts of Universal Credit in the subpopulation of
constituencies below the median of the relevant pre-adoption characteristic. The bF
coefficient tests whether Universal Credit generates significantly different criminogenic
effects above the sample median. The sum of bB and bF therefore represents impact of
Universal Credit in constituencies above the median of the corresponding constituency
characteristic presented in the results section. All other details are equal to estimating
equation (1).
Instrumental Variable. The last empirical exercise aims to identify the causal impact
of the number claimants subject to the new welfare system on crime. We use the following
IV estimating equation:
V
!",$ = bM '(_(OPQRPSTU",$ + +" + ,$ + W",$ (4)
'(_(OPYRPSTU",$ = bZ '(",$ + +" + ,$ + [",$ (5)
Where '(_(OPYRPSTU is the number of Universal Credit claimants in a constituency-
month. All other details are identical to estimating equation (1). The logic of this empirical
approach is as follows. We are interested in quantifying the causal impact of the number
of claimants enrolled in this new welfare system on criminal activity 3bM 9. A simple OLS
regression is likely to produce biased estimates given within-constituency changes in the
number of UC claimants are likely correlated with unobservables crime determinants. We
15therefore address endogeneity concerns by exploiting quasi-experimental variation in the number of claimants provided by the staggered rollout of the program across constituencies, as shown in Figure I. The main identifying assumption for the exclusion restriction to be valid is that the rollout of the new welfare system affects the proliferation of crime only through changes in the number of benefit recipients exposed to the new system, and it is not correlated to other possible crime determinants omitted from the empirical model. In the related empirical part, we will discuss the reliability of this assumption and show the robustness of the IV estimates to the inclusion of an extensive set of fixed effects and covariates. 5. Results Difference in Differences Results. Table 2 reports the estimates of Universal Credit on burglary, the main outcome of the analysis. Column 1 displays the baseline estimate obtained using estimating equation (1). We find Universal Credit increased burglaries by around 3.4% with (p
magnitude of the estimate to 2.9% with (p
larger than in the baseline, around 3.7%, and are significant at the 1% level. Column 10

includes the 29 constituencies where Universal Credit was rolled out before April 2014.

Estimates are smaller, around 2.7%, with (p
crimes. We also note burglary is the second most frequent acquisitive crime. Therefore,

compared to other less frequent categories of theft (e.g. shoplifting, bike theft, theft from

person) it is more likely affected by the reform due to the higher baseline number of

criminal episodes, which also enhances the power of our analysis. In terms of occurrences

rates, burglary is only preceded by the ‘other theft’ category that includes thefts by an

employee, blackmail and making off without payment. These acquisitive crimes are unlikely

to be committed by unemployed individuals, such as the majority of those enrolled in

Universal Credit. Hence, if anything, the estimates for other thefts may be considered as a

plausible falsification test for the analysis. These estimates are close to zero and not

significant under conventional significance levels across specifications (see Panel D of table

A1).

     Placebo Test. We now present the results of a placebo test where the primary analysis

conducted using model (1) is replicated with a pseudo treatment variable drawn from the

same distribution of the original treatment variable that, crucially, is not supposed to affect

the outcome of interest. We randomly permute the month of UC adoption across

constituencies and subsequently generate a placebo '(",$ variable. This is an indicator set

to 0 in the months prior to the placebo UC adoption in a constituency, and 1 in the month

of placebo adoption and afterwards. We generate 1,000 permutations of the independent

variable and run 1,000 placebo regressions to minimize the likelihood that a single

distributed placebo variable could affect the results by chance.17 Figure II shows the Kernel

distribution of placebo difference in differences estimates, which is normal and centred

17 In practice, the true value of the estimand is zero, and the goal of the placebo analysis is to provide
support for the identification strategy behind the primary analysis by assessing whether the pseudo
treatment leads to estimates that are close to zero, taking into account the statistical uncertainty (Athey and
Imbens 2017).

                                                                                                            19
around zero. The vertical solid line identifies the baseline estimate of the impact of
Universal Credit on burglaries as in table 2 column 1 (0.0343). This lies to the right of the
99th percentile of the placebo distribution, rejecting at the 1% level the possibility our
results are obtained purely by chance. Reassuringly, this placebo analysis provides further
support for the identification strategy behind the primary analysis, indicating that the
estimates of the effects of UC on burglary detected using model (1) are indeed reliable.
Event Study Analysis. The dynamics of the effects are now examined in an event-
study analysis. Figure III shows point estimates and 95% confidence intervals of
2; estimates obtained using equation (2). We note the effects on burglary are well timed,
appearing the year after the UC adoption. The criminogenic effects are durable and
increasing until the end of the sample period. The magnitude ranges from 3.5% the year
after the adoption (pintervention characteristics of a constituency. This analysis is helpful to locate areas where the criminogenic effects are more pronounced and, therefore, to shed some light on the underlying channels. Results obtained using estimating equation (3) are presented in Table 3. The variable ‘Characteristic’ refers to a pre-adoption constituency characteristic measured in December 2010 (the initial period of the sample). It takes the value of 1 if the related variable is above the median, 0 otherwise. Columns 1-5 focus respectively on: Median house prices; median weekly earnings; unemployment rate; share of people claiming benefits; population density. The analysis reveals the criminogenic effects of Universal Credit are concentrated in constituencies below the median of national house prices: The effect in this subpopulation is around 6% with (p
examined using an IV analysis. Table 4 reports the results obtained using estimating

equation (4). Column 1 shows the first stage estimate. The effect is large and significant at

the 1% level. This is consistent with the fact that the rollout of the reform has increased

the number of UC recipients, and it suggests our instrument causes an average monthly

increase of around 350% in the number of UC recipients across the sample period.

Reduced form estimates capturing the impact of the policy on burglary are reported for

readers’ convenience in column 2. The results are equal to our baseline estimate: 3.4% with

p
of Universal Credit was mainly driven by the administrative capacity of local Jobcentres to

handle the introduction of the new payment system. However, one could argue this may

be related to unobservable crime determinants, hence violating the exclusion restriction of

our IV design. For this reason, in column 5, we saturate the model adding to the baseline:

Median weekly earnings, median house prices, unemployment rate, population density;

number of claimants of: Housing-Benefit, Job Seekers Allowance, Employment and

Support Allowance, Income Support, and Child Tax Credit and Working Tax Credit;

constituency-specific linear trends and constituency-by-month fixed effects. This high-

demanding specification generates IV estimates that are 10% smaller compared to the

baseline in column 3. Results are still significant at the 1% level.

   We conclude the Instrumental Variable analysis corroborates the hypothesis that the

criminogenic effects of Universal Credit are closely related to the increase in the number

of benefit recipients enrolled in this new welfare system. The size of the elasticity is rather

small, if compared with other elasticities estimated in the literature examining the impact

of legal market opportunities and wages (Draca and Machin, 2015). However, one aspect

is worth highlighting. As of February 2019 UC enrolled 1.5 million individuals and, by the

time is fully rolled out, it will administer payments to around 8 million individuals (Kennedy

and Keen, 2018). Therefore, even if UC produces small individual criminogenic effects

because only a minority of its recipients commit crime in response, it can lead to major

societal implications given the large number of claimants exposed to the new welfare

system.

   Interpretation of the Estimates. A conservative interpretation of our estimates

indicates that Universal Credit has produced around 45,000 burglaries at a societal cost of

£270 million. This estimate is obtained by considering a (pre-adoption) average monthly

                                                                                            23
number of burglaries per constituencies of 64.8, a 3.4% crime increase lasting for 36
months, and a unit cost of burglary due to anticipation, consequence, and response of
£5,930 (Heeks et al. 2018). These are conservative estimates, considering that the event
study analysis shows larger effects than 3.4%, growing overtime, and persistent after 36
months of UC adoption. Moreover, the unit cost of commercial burglaries (£15,460) is
higher than the cost for domestic burglaries (Heeks et al. 2018). Our data do not allow to
differentiate between the two. Hence, we opt for the smaller value when estimating the
social costs associated with the increase in crime caused by Universal Credit.
6. Discussion
This section discusses the potential reasons behind the impact of UC on crime. UC
generated a cut in benefit entitlement of £2 billion per annum. This has disproportionally
affected those at the bottom decile of the income distribution (Brewer et al., 2019). While
there are various new measures introduced by Universal Credit, one of the most obvious
candidates for this regressive impact is the ‘Minimum Income Floor’ (MIF) for self-
employed people. Under this new measure, if earnings are below the MIF, the government
computes the benefit amount as if the recipient was earning an amount equal to the MIF
(for most people this is the minimum they would earn by working full time as employees).
As a result, a single, self-employed person could see their benefit entitlement reduced by
up to £8,250 per annum (Brewer et al., 2019).
24The regressive distributional impact of UC may have been amplified by the delays in
benefit payments.19 To mimic a typical salary, UC payments are made in arrears once a
month directly into the claimants’ bank account. Given that payments take one week to
reach the bank account of the recipient, the first payment should be received around six
weeks after the original application. This, per se, may be enough to create higher financial
instability for relatively poorer recipients. To exacerbate matters, as for 2017 (hence almost
four years after the start of the program) 40% of claimants received the initial payment 11
weeks or more after the date of original application, and 20% received the initial payment
around 20 weeks or more after the date of original application (NAO, 2018).
Another possible explanation for the increase in crime relates to the change in
conditionality and sanctions regime legislated in Welfare Reform Act 2012, that also
officialised the implementation of Universal Credit. The Act established new conditionality
rules for both UC and the Legacy system to ensure a broader alignment between the two.
In doing so, it increased the length and severity of sanctions in both regimes.20 The higher
volume of sanctions has decreased the amount of benefits received by subgroup of
individuals that failed to meet the requirements imposed by the Claimant Commitment.21
We note the larger majority of recipients being sanctioned are male and in the 16-24 age
19 Late payments can arise because the verification process is not completed on-time (either by DWP or
the claimant), claims are amended at a late stage, or any other sort of technical difficulty.
20 Prior to the Welfare Reform Act 2012, the maximum period for which a claimant's benefit could be
stopped for a breach of the rules was six months. The new rules increased the maximum period of benefit
sanction to three years. Sanctions are applied according to the seriousness of the infraction. For more
information see: https://publications.parliament.uk/pa/cm201719/cmselect/cmworpen/955/955.pdf
21 As of December 2016, 8.2% of UC claimants required to search for work were being sanctioned. The
percentage of sanctions for JSA, prior to the Welfare Reform Act 2012, was around 2% (DWP, 2017).
This suggests a large increase in the number of sanctions received under UC. We note however that the
two percentages are not directly comparable. Under JSA, payments can be stopped to claimants who miss
an advisor interview without good reason, under the assumption that the claimant has found work without
informing the Jobcentre. Under UC, which supports claimants for a range of needs beyond unemployment
(e.g. rental costs), the jobcentre is more likely to sanction the claimant instead of stopping the benefit
entirely. In addition, JSA payments were fortnightly, therefore restarting them would not lead to the same
payment delay as UC.
25range (Webster, 2017). These individuals are also likely to be characterized by a higher
baseline criminal propensity (Grogger, 1998).
Universal Credit has also altered the frequency of payments, from weekly or fortnightly,
to monthly. Foley (2011) and Carr and Packham (2019) have clearly shown this can
significantly impact criminal propensity, as benefit recipients consume welfare related
income quickly and then commit crime to overcome hardship later in the month.
Therefore, this could also represent a possible channel behind our results. However, we
speculate it is probably less prominent. In fact, UC still allows for payments staggered
during the month in a wide variety of circumstances. In particular, this happens in the most
problematic cases of individuals who likely have higher criminal propensity. Staggered
disbursements are given when the ‘work coach’ identifies the claimant has addiction
problems, rent arrears, was previously homeless, or in any circumstance where the claimant
request it with a valid reason (DWP, 2020).
We conclude the criminogenic effects of Universal Credit are likely due to a substantial
worsening of the financial conditions of some UC recipients, which has increased their
incentives to commit crime to supplement their income. Our findings are therefore entirely
consistent with the predictions arising from the model of Becker (1968), according to
which—all else being equal—a reduction in legitimate income opportunities would lead to
an increase in economically motivated crimes.
7. Concluding Remarks
This paper evaluates the criminogenic effects of Universal Credit, a monumental welfare
reform designed to radically change the social security payment system in the United
26Kingdom that will directly affect the lives of around 8 million low-income individuals by
the time is fully rolled out in 2024. We exploit the staggered rollout of the reform across
parliamentary constituencies and use monthly crime and UC data from December 2010 to
February 2019 for all constituencies in England and Wales. We conduct difference-in-
differences and IV analysis to identify credible estimates of the criminogenic effects of
Universal Credit.
Our main finding is that UC has generated around 45,000 burglaries, with durable effects
lasting until the end of the sample period. Effects are precisely estimated and robust to an
extensive set of checks such as the inclusion of numerous socio-economic covariates,
constituency-specific linear and quadratic trends, constituency-by-month fixed effects,
changes to the sample analysed and functional forms. A placebo test and an event study
analysis provide further support for the reliability of the identification strategy employed
in this paper. We also show effects of UC are larger when only claimants with high-crime
propensity, such as unmarried, unemployed individuals, are admitted to the program. In
addition, the effects are significantly larger in poorer constituencies where house prices are
below the national median. An IV analysis exploiting the staggered adoption of UC across
constituencies as an instrument for the number of UC claimants, confirms that the
intensive margin of adoption matters for the impact on crime.
A conservative interpretation of our estimates indicates Universal Credit has caused a
societal cost of around £270 million. These societal costs cannot be disregarded and appear
even more worrying considering that around 6.5 million more benefit claimants will be
soon exposed to this new welfare system.22 For this reason, our paper offers timely policy
22 See, for instance: https://www.bbc.co.uk/news/business-52675084
27implications and provides impetus for measures aimed at tackling these unintended
criminogenic effects that are otherwise likely to grow over time.
Our findings are important for at least two other reasons. First, they corroborate the
hypothesis that economic incentives, particularly those affecting individuals at the bottom
of the income distribution, matter for crime (Grogger 1998; Machin and Meghir, 2004;
Draca and Machin, 2015). Second, the results demonstrate how government policies can
have unintended consequences (e.g. Adda et al., 2014; d’Este, 2019; Gavrilova et al., 2019).
Overall, our findings strongly indicate one of the consequences of Universal Credit is the
imposition of large societal cost in the form of higher crime.
28References
1) Adda, J., McConnell, B. and Rasul, I., 2014. Crime and the depenalization of cannabis
possession: Evidence from a policing experiment. Journal of Political Economy, 122(5),
pp.1130-1202.
2) Arie, S., 2018. Doctors’ concerns over universal credit are mounting. BMJ: British
Medical Journal (Online), 363.
3) Athey, S. and Imbens, G.W., 2017. The state of applied econometrics: Causality and
policy evaluation. Journal of Economic Perspectives, 31(2), pp.3-32.
4) Becker, G.S., 1968. Crime and Punishment: An Economic Approach. The Journal of
Political Economy, 76(2), pp.169-217.
5) Bell, B., Bindler, A. and Machin, S., 2018. Crime scars: recessions and the making of
career criminals. Review of Economics and Statistics, 100(3), pp.392-404.
6) Bindler, A., 2016. Still unemployed, what next? Crime and unemployment duration.
Working paper.
7) Cameron, A.C., Gelbach, J.B. and Miller, D.L., 2011. Robust Inference With Multiway
Clustering. Journal of Business & Economic Statistics, 29(2), pp.238-249.
8) Carr, J.B. and Packham, A., 2019. SNAP benefits and crime: Evidence from changing
disbursement schedules. Review of Economics and Statistics, 101(2), pp.310-325.
9) Cheetham, M., Moffatt, S., Addison, M. and Wiseman, A., 2019. Impact of Universal
Credit in North East England: a qualitative study of claimants and support staff. BMJ
Open, 9(7), p.e029611.
10) d'Este, R., 2019. Breaking the crystal methamphetamine economy: illegal drugs, supply-
side interventions, and crime responses. Economica (accepted for publication).
11) Draca, M. and Machin, S.J., 2015. Crime and Economic Incentives. Annual Review of
Economics, 7, pp.389-408.
12) Department for Work and Pensions, 2017. Jobseeker’s Allowance and Employment
and Support Allowance Sanctions: Decisions Made to December 2016. Available at:
https://www.gov.uk/government/statistics/jobseekers-allowance-and-employment-
and-support-allowance-sanctions-decisions-made-to-december-2016 (Access Date:
June 2020).
13) Department for Work and Pensions, 2019. Universal Credit Statistics: 29 April 2013
to 11 July 2019. Available at:
https://www.gov.uk/government/publications/universal-credit-29-april-2013-to-11-
29july-2019/universal-credit-statistics-29-april-2013-to-11-july-2019 (Access Date: June
2020).
14) Department for Work and Pensions, 2020. Guidance Alternative Payment
Arrangements Available at: https://www.gov.uk/government/publications/universal-
credit-alternative-payment-arrangements/alternative-payment-arrangements(Access
Date: June 2020).
15) Foley, C.F., 2011. Welfare payments and crime. The Review of Economics and
Statistics, 93(1), pp.97-112.
16) Gavrilova, E., Kamada, T. and Zoutman, F., 2019. Is legal pot crippling Mexican drug
trafficking organisations? The effect of medical marijuana laws on US crime. The
Economic Journal, 129(617), pp.375-407.
17) Gould, E.D., Weinberg, B.A. and Mustard, D.B., 2002. Crime rates and local labor
market opportunities in the United States: 1979–1997. Review of Economics and
statistics, 84(1), pp.45-61.
18) Grogger, J., 1998. Market wages and youth crime. Journal of Labor Economics, 16(4),
pp.756-791.
19) Hardie, I., 2020. The Impact of Universal Credit Rollout on Housing Security: An
Analysis of Landlord Repossession Rates in English Local Authorities. Journal of Social
Policy, pp.1-22.
20) Heeks, M., Reed, S., Tafsiri, M. and Prince, S., 2018. The economic and social costs of
crime Second edition. Home Office Research Report 99, 2018.
21) Loopstra, R., Fledderjohann, J., Reeves, A. and Stuckler, D., 2018. Impact of welfare
benefit sanctioning on food insecurity: a dynamic cross-area study of food bank usage
in the UK. Journal of Social Policy, 47(3), pp.437-457.
22) Machin, S. and Marie, O., 2006. Crime and benefit sanctions. Portuguese Economic
Journal, 5(2), pp.149-165.
23) Machin, S. and Meghir, C., 2004. Crime and economic incentives. Journal of Human
Resources, 39(4), pp.958-979.
24) National Audit Office (2013) Universal Credit: early progress, HC 621, London: The
Stationery Office.
25) National Audit Office (2018)Rolling Out Universal Credit , HC 621, London: The
Stationery Office. Available at: https://www.nao.org.uk/wp-
content/uploads/2018/06/Rolling-out-Universal-Credit.pdf (Accessed Date: June
2020).
3026) Kennedy, S. and Keen, R., 2018. Universal Credit roll-out: 2018/19. London: House of
Commons Library.
27) Schnepel, K.T., 2018. Good jobs and recidivism. The Economic Journal, 128(608), pp.447-
469.
28) Solon, G., Haider, S.J. and Wooldridge, J.M., 2015. What are we weighting for?. Journal
of Human Resources, 50(2), pp.301-316.
29) Timmins, N., 2016. Universal Credit: From Disaster to Recovery?. London: Institute for
Government, p.34.
30) Webster, D., 2017. Benefit Sanctions Statistics: JSA, ESA and Universal Credit.
Available at: https://www.mostewartresearch.co.uk/wp-
content/uploads/2020/03/20-02-Sanctions-Stats-Briefing-D-Webster.pdf (Accessed
Date: June 2020)
31) Wickham, S., Bentley, L., Rose, T., Whitehead, M., Taylor-Robinson, D. and Barr, B.,
2020. Effects on mental health of a UK welfare reform, Universal Credit: a longitudinal
controlled study. The Lancet Public Health, 5(3), pp.e157-e164.
31Table 1
Descriptive Statistics
(1) (2) (3) (4)
Mean Std. Dev. Min Max
Burglary 61.972 32.741 0 312
Number of claimants:
Universal credit 404.409 911.057 0 11,443
Housing benefit 539.482 285.564 69 3,933
Job seeker allowance 1,176.415 1,016.998 50 8,100
Employment and support allowance 1,670.372 1,041.613 117 6,166
Income support 1,469.92 1,003.985 154 7,852
Child and working tax credit 5,311.037 2,010.08 1,300 13,400
Population 100,000 14,917.13 56,453 185,000
Population density 21.823 27.706 .23 162.376
Median weekly earnings (£) 524.179 81.911 359.9 916.4
Median house prices (£) 213,000 112,000 58,000 1,280,000
Unemployment rate 0.034 0.023 0.004 0.174
Observations = 53,586
Notes: Descriptive statistics at the constituency-month level for the baseline sample of analysis. The sample
includes 544 parliamentary constituencies in England and Wales from December 2010 to February 2019 (544
constituencies × 99 months = 53,586 observations). Population density is computed as population divided by
land in hectares. Data sources: Crime (UKCrimeStats); UC claimants (The House of Common Library ); child tax
credit and working tax credit (HMRC); other Legacy claimants (DWP); population and density (UKCrimeStats) ;
earnings, house prices, and unemployment rate (ONS).
32Table 2
The Impact of Universal Credit on Burglary
Difference in Differences Estimates: Baseline Result and Robustness Checks
(1) (2) (3) (4) (5) (6) (7)
Universal Credit 0.0343*** 0.0321*** 0.0340*** 0.0292** 0.0360*** 0.0343** 0.0296**
(0.0124) (0.0122) (0.0124) (0.0114) (0.0127) (0.0136) (0.0134)
Observations 53,856 53,856 53,856 53,856 53,856 53,312 46,926
(8) (9) (10) (11) (12) (13) (14)
Universal Credit 0.0443*** 0.0365*** 0.0266** 0.0274** 0.0301** 0.0350*** 0.0343***
(0.0132) (0.0118) (0.0107) (0.0130) (0.0128) (0.0128) (0.0129)
Observations 35,360 40,800 56,727 53,856 53,856 53,856 53,856
Notes: This table shows the difference in differences estimates of the impact of Universal Credit on
burglary. Unless otherwise specified, burglary is transformed as log(1+z), where z is the rate of burglaries
per 100,000 people in a constituency-month. The variable of interest ‘Universal Credit’ is an indicator set
to 0 in the months prior to the Universal Credit adoption, 1 afterwards. Column 1 shows the baseline
estimate. Column 2 includes as controls median weekly earnings, median house prices, unemployment rate,
population density, and recipients of: number of Housing Benefit, Jobseeker Allowance, Employment and
Support Allowance, Income Support, Child and Working Tax Credit. Column 3 adds to the baseline 544
constituency-specific linear trends. Column 4 adds to the baseline 544 constituency-specific linear trends
and 544 constituency-specific quadratic trends. Column 5 includes 6,528 constituency-by-month fixed
effects. Column 6 excludes the month when Universal Credit was adopted in a constituency. Column 7
excludes 70 London constituencies. Column 8 limits the sample to April 2016. Column 9 limits the sample
to 40 months before and 34 months after the adoption of Universal Credit in a constituency. Column 10
includes the 29 constituencies where Universal Credit was rolled out before April 2014. Column 11 shows
results from a Poisson count data regression. Column 12 shows results from a negative binomial count data
regression. Column 13 shows estimates not weighted by population. Column 14 reports standard errors
clustered two-way at the constituency-period level. All regressions include fixed effects at the constituency
level and year-by-month level (99 periods). Regressions are weighted by population in a constituency (not
in columns 11-13). Standard errors clustered at the constituency level (and at the constituency-period level
in column 14) are shown in parentheses. *** significance at the 1% level, ** significance at the 5% level, *
significance at the 10% level.
33You can also read