UNIVERSAL HEALTH COVERAGE ASSESSMENT SOUTH AFRICA - DIANE MCINTYRE, JANE DOHERTY AND JOHN ATAGUBA
←
→
Page content transcription
If your browser does not render page correctly, please read the page content below
Universal Health Coverage Assessment: South Africa

Universal Health Coverage
Assessment

South Africa
Diane McIntyre, Jane Doherty and John Ataguba

Global Network for Health Equity (GNHE)

December 2014

                                          1
Universal Health Coverage Assessment: South Africa

Universal Health Coverage Assessment:
South Africa
Prepared by Diane McIntyre,1 Jane Doherty2 and John Ataguba1

For the Global Network for Health Equity (GNHE)
With the aid of a grant from the International Development Research Centre (IDRC), Ottawa, Canada

December 2014

Health Economics Unit, University of Cape Town, South Africa
1

2
    Independent researcher and part-time lecturer, School of Public Health, University of the Witwatersrand, South Africa

                                                                                       2
Universal Health Coverage Assessment: South Africa
Introduction Key health care expenditure
In South Africa under apartheid resources for health
indicators
care were allocated along racial lines. Grappling This section examines overall levels of health expenditure
with the resulting health inequities, and distortions in South Africa and identifies the main sources of health
in health care provision and financing, has been a financing (Table 1).3 In 2012, total health expenditure
pre-occupation of the post-apartheid government accounted for 8.8% of the country’s GDP, an amount that
since 1994. was considerably higher than the average of 6.2% for
other upper-middle-income countries but somewhat below
This document provides a preliminary assessment of the global average of 9.2%.
aspects of the South African health system relative to the
goal of universal health coverage, with a particular focus Public allocations to fund the health sector stood at
on the financing system. about 13% of total government expenditure, which was
higher than the average of 11% for other upper-middle-
In the 2010 World Health Report, universal health coverage income countries but still below the 15% target set by the
is defined as providing everyone in a country with financial Organisation for African Unity’s 2001 Abuja Declaration
protection from the costs of using health care and ensuring (which is the same as the global average for 2012). Per
access to the health services they need (World Health capita government expenditure on health was around $471
Organisation 2010). These services should be of sufficient (in terms of purchasing power parity), considerably higher
quality to be effective. than the upper-middle-income country average of $371
and three-quarters the global average of $652.
This document presents data that provide insights into the
extent of financial protection and access to needed health In 2012 donor financing accounted for only 2% of total
services in South Africa. health sector expenditure in South Africa, which is a very
Table 1: National Health Accounts indicators of health care expenditure and sources of finance in
South Africa (2012)
Indicators of the level of health care expenditure
1. Total expenditure on health as % of GDP 8.8%
2. General government expenditure on health as % of GDP 4.2%
3. General government expenditure on health as % of total government expenditure 12.9%
4a. Per capita government expenditure on health at average exchange rate (US$) 308.7
4b. Per capita government expenditure on health (PPP $) 470.5
Indicators of the source of funds for health care
5. General government expenditure on health as % of total expenditure on health* 47.9%
6. Private expenditure on health as % of total expenditure on health* 52.1%
7. External resources for health as % of total expenditure on health* 1.7%
8. Out-of-pocket expenditure on health as % of total expenditure on health 7.2%
9. Out-of-pocket expenditure on health as % of GDP 0.6%
10. Private prepaid plans on health as % of total expenditure on health 42.3%
Source: Data drawn from World Health Organisation’s Global Health Expenditure Database (http://apps.who.int/nha/database/Key_Indicators/Index/en)
* Some external resources flow through government, and some through private, intermediaries. Indicators 5 and 6 therefore add up to 100% whereas indicator 7 in this Table
is a separate indicator altogether. This is different from Figure 1 where donor funds are distinguished from tax-based financing.
3
The data quoted in this section all derive from the latest (2012) data in the World Health Organisation’s Global Health Expenditure Database
(http://apps.who.int/nha/database/Home/Index/en). Comparisons with other countries are based on figures expressed in terms of purchasing power parity. The country’s
income category is determined from the World Bank’s classification for the same year (http://data.worldbank.org/about/country-and-lending-groups).
3Universal Health Coverage Assessment: South Africa
low level of reliance for an African country and fortunate, scheme funds are only used to fund health services for the
given that donor funding is unreliable. 16% of the population who are members.
In 2012 there was an almost equal distribution of health
care financing between public (48%) and private funding
sources (52%). The latter were made up of direct household Structure of the health system
out-of-pocket payments and contributions to voluntary
private insurance schemes (called medical schemes in South
according to health financing
Africa). Out-of-pocket payments played a relatively small functions
role (at about 7% of total financing). This means that South
Africa is performing much better than the international Figure 2 provides a summary of the structure of the South
pattern (where the figure is 33% for upper-middle-income African health system, depicted according to the health
countries and 21% globally), at least in terms of keeping care financing functions of revenue collection, pooling and
out-of-pocket payments to a minimum, relative to its level of purchasing, as well as health service provision. Each block
government expenditure (McIntyre and Kutzin, 2011). represents the percentage share of overall health care
expenditure accounted for by each category of revenue
The key challenge from a financing perspective is South source, pooling organisation, purchasing organisation and
Africa’s relative over-reliance on voluntary pre-payment health care provider.
(private insurance) compared to mandatory pre-payment
mechanisms. As indicated in Figure 1, South Africa has an
abnormally high proportion of voluntary health insurance Revenue collection
funding. At 42% of total health expenditure, this was one of
the highest shares of this form of financing in the world. This As indicated in the previous section, most of the funds for
is a key challenge in the South African context as medical health care in South Africa come from public funds and
Figure 1: Financing mechanisms in countries with universal health systems compared with South Africa
and the USA (2013)
100%
90%
80%
% total health care expenditure
70%
60%
50%
40%
30%
20%
10%
0%
Au alia
Fin ark
A
m
Ze ds
Fra nd
No nd
er e
Cu a
Po way
Ire ny
Th ba
Sp l
d
Be tria
d
Sw ain
Ja y
Ca um
ite tze n
Ne Ko n
De ada
a
Ki nd
Ne ther rea
ga
l
G nc
Ric
US
lan
an
Un Swi ede
pa
ric
Ita
do
w lan
a
la
ala
d rla
str
nm
rtu
s
lgi
m
r
Af
ail
n
ng
sta
Au
uth
Co
So
Mandatory prepayment Voluntary prepayment Out-of-pocket
Source: Data drawn from World Health Organisation’s Global Health Expenditure Database (http://apps.who.int/nha/database/Key_Indicators/Index/en)
4Universal Health Coverage Assessment: South Africa
contributions to private insurance schemes. Public funds may use public hospitals, but their scheme will be charged
mainly comprise general tax revenue: there are no dedicated cost-recovery fees and most scheme members go to private
health taxes and there is no mandatory health insurance hospitals. Public hospital fees do pose affordability problems
scheme. Government financing of the health sector has for middle-income patients who are not members of medical
not kept pace with the growth in population and inflation, schemes: user fees based on their income level can be
particularly from the 1990s to the middle of the first decade considerable, particularly for inpatient care, and these
of this century, constraining real per capita public funding patients are expected to pay them on an out-of-pocket basis.
levels for health care at a time when service demands were
growing due to the HIV epidemic (McIntyre et al 2012). The majority of out-of-pocket payments (60%) are, however,
attributable to medical scheme members, either for co-
Membership of medical schemes is voluntary in the sense that payments or for health service costs for which medical schemes
there is no legislative mandate requiring any person to belong do not pay. Recent estimates, using nationally representative
to a scheme. However, for many people working in formal data collected in 2008, show that medical scheme members
sector employment, their employers require them to take out paid more out-of-pocket compared to comparable non-
medical scheme cover (i.e. it is a condition of employment). scheme members (Ataguba and Goudge 2012).
Pre-payment funding – through general tax revenue and
voluntary insurance - accounts for about 90% of all funding Pooling
for health care in South Africa, which is very positive from a
financial protection perspective. However, only half of these The small percentage of the South African population that
pre-payment funds are mandatory (through general taxation). is covered by medical schemes is mainly in the highest
income quintile. The remaining 84% of the population
No user fees are charged at public sector primary health is heavily dependent on services funded from the general
care facilities (since fees were removed in 1996). However, tax revenue pool of funds. There are thus different pools of
fees are charged at public hospitals on a sliding scale funds for different socio-economic groups. Out-of-pocket
according to a patient’s income. The poorest may apply payments are not pooled in the sense that these do not
for exemption from fees, although it is sometimes difficult flow via a financing intermediary but are paid directly by a
to secure these exemptions. Medical scheme members patient to a health care provider.
Figure 2: A function summary chart for South Africa (2012)
Donors
No pooling Out-of-pocket
Revenue
General taxation Private insurance
collection
Pooling Department of Health Private insurance
Individual
Purchasing Department of Health Private insurance
purchasing
Provision Public providers Private providers
Note: The private health insurance industry is highly fragmented so risk pooling and strategic purchasing are much more limited than suggested by the white blocks in the Figure above.
Source: Authors’ depiction based on data in Table 1 and information from McIntyre et al (2012)
5Universal Health Coverage Assessment: South Africa
Another important feature is that there are about 100 The national Department of Health plays a mainly
separate medical schemes, many with a number of stewardship role although it does channel some funds
different benefit options. Each option operates as a for health services to individual provinces in the form of
separate pool, translating into over 400 individual fund ‘conditional grants’. These grants are for very specific
and risk pools and less than 20,000 medical scheme health services (e.g. provision of anti-retroviral treatment
beneficiaries per option (McIntyre and McLeod (in press)). for HIV, and funding for central hospitals). The conditional
This high degree of fragmentation has serious implications grant process provides some opportunity for strategic
for cross-subsidies, particularly as very few schemes purchasing, although it seems that this potential purchasing
charge income-related contributions. Members in most power is not exercised to any great extent at present, partly
schemes pay a flat contribution that varies only according because expenditure within public services is seldom
to the benefit option selected, with lower-income scheme disaggregated on a cost centre basis, making it difficult to
members tending to select less expensive benefit options. track expenditure.
The difference in the flat contributions across options
is far lower than differences in income levels, which A relatively comprehensive range of services is provided
has translated into a regressive distribution of scheme at public sector health facilities. However, there is implicit
contributions across medical scheme members (McIntyre rationing because of a shortage of certain services.
et al. 2012). Fragmentation also limits the extent of risk There is also a wide variation in the availability and
cross-subsidies as risks are only pooled across members quality of services on a geographic basis and severe
of a single benefit option. Further, it is difficult for schemes management challenges affect even some of the better-
to sustain an adequate level of benefits, especially when resourced facilities.
faced by unexpectedly large claims.
Medical schemes purchase a different set of services for
While there is a single general tax pool, these funds are their members for each benefit option within a scheme.
distributed between provinces in a way that may not There are regulations that require every scheme option to
promote risk cross-subsidies. South Africa has a fiscal cover a set of prescribed minimum benefits (PMBs), which
federal system, whereby block grants or global budgets are include the most common chronic diseases and some
allocated to each province. Provinces have considerable inpatient services. Additional services over and above
autonomy in deciding how much to allocate to health the PMBs vary across schemes and options, with higher-
services and other sectors. While the block grants are income members tending to choose options providing
allocated using a formula that includes the size of the more comprehensive cover. There are quite extensive co-
provincial population, the ultimate allocation by each payments on services outside of the PMBs.
provincial Treasury to its provincial Department of Health
does not necessarily reflect differences in the need for health Although medical schemes are expected to negotiate with
care across provinces. Having said this, inter-provincial providers around payment rates, fragmentation means that
differences in per capita spending are declining, although each scheme has limited ability to influence the rates that
intra-provincial differences remain severe in many cases providers choose to charge. Medical schemes’ purchasing
(McIntyre et al. 2012). power is particularly limited in terms of hospital services,
given that there are three private hospital groups that
own more than three-quarters of all private hospital beds
Purchasing (McIntyre 2010). In reality, medical schemes (and the large
for-profit companies that administer the schemes’ day-to-
Figure 2 shows that there is an integration of pooling day operations) are not active or strategic purchasers of
and purchasing functions within the same organisations health services.
in South Africa. The nine provincial health departments
are the major purchasers of public sector health services There are some serious efficiency and sustainability
and the vast majority of tax funds flow via these financing challenges within the medical schemes environment.
intermediaries. Provincial health departments allocate A key factor in this regard is that fee-for-service is by
budgets to individual public sector hospitals and primary far the largest payment mechanism used by schemes,
health care clinics, generally on an incremental historical although a limited number of schemes have set up
basis. Facilities are paid on a line-item budget basis and capitation systems with some general practitioners and
individual staff are paid salaries. Purchasing of services is are experimenting with diagnosis-related groups for
thus relatively passive. inpatient services.
6Universal Health Coverage Assessment: South Africa
Expenditure per medical scheme member has been Provision
increasing at 7% to 10% above inflation per year for the
past three decades (McIntyre et al. 2012). By far the There is a range of public and private for-profit health
greatest real increase in spending has been for private care providers in South Africa. Within the public sector,
hospitals, followed by specialist doctors. There is a there is a countrywide network of public sector primary
relationship between these providers, as specialist doctors care facilities and various levels of hospitals. The private
often have their rooms in private hospitals and admit their provision sector includes independent practitioners
patients to these hospitals. The current system of line-item working in solo or group practice, pharmacists at retail
budgeting in the public sector does not provide incentives pharmacies, specialist doctors (who generally have
for efficiency or for providing good quality care. consulting rooms in private hospitals), private hospitals
that employ nurses and other health professionals,
Expenditure increases are related both to very rapid fee and ambulance services. Private sector services are
increases (linked to limited purchasing power of schemes concentrated in urban areas.
and heavy investment in the latest technology by private
hospitals) and increased utilisation per member (with As indicated in Figure 2, there is a relatively even
some indications that supplier-induced demand occurs). distribution of expenditure on public and private sector
Fee-for-service payments, as used within the medical providers in South Africa. However, in terms of utilisation,
scheme environment, create an incentive to provide as 71% of outpatient visits took place within a public sector
many services as possible, even where these may not be health facility and 29% with private providers in 2008
medically necessary or appropriate. A particular problem in while 82% of inpatient admissions occurred in public
the medical scheme environment is that there is no primary hospitals and only 18% in private hospitals (Alaba and
health care gatekeeping: while most medical schemes McIntyre 2012).
insist that members pay for general practitioner services
themselves (either out-of-pocket or from the ‘savings While the public sector offers a comprehensive range of
account’ part of their scheme package), schemes will cover health services, there is considerable implicit rationing
the costs of specialist services. Another efficiency problem in the form of long queues at facilities, waiting lists for
is the high level of administrative and related costs. Only surgery, dialysis and other services and poor quality of
80% of members’ contributions are spent on health care care. A key constraint is the lack of sufficient, qualified
services. The other 20% of contributions are spent on paying staff within the public health sector relative to the size
for-profit companies to administer scheme operations, of the population served. Staff to population ratios are
managed care activities (mainly chronic medicine and pre- lower than in the private sector as the majority of health
hospitalisation authorisation) and fees for brokers (who professionals (except nurses) work in the private sector
advise individuals and employers on which medical scheme (McIntyre 2010). There is also a mal-distribution of health
to join). Finally, the very rapid increase in real per capita workers between geographic areas, with a concentration
medical scheme expenditure, and hence contribution rates, in large urban areas.
means that it is becoming increasingly difficult for South
Africans to afford medical scheme membership.
As indicated in Figure 2, a small amount of health care Financial protection and equity
expenditure in South Africa takes the form of individuals
directly purchasing health services themselves. This relates
in financing
to the portion of out-of-pocket payments that does not take A key objective of universal health coverage is to provide
the form of co-payments by medical scheme members, or financial protection for everyone in the country. Insights
user fees for public hospitals. Instead, it refers to those into the existing extent of financial protection are provided
who decide to purchase services from private providers through indicators such as the extent of catastrophic
and pay directly for these services. The available evidence payments and the level of impoverishment due to paying
indicates that this usually takes the form of occasional for health services. This section analyses these indicators
visits to a general practitioner or buying medicines from a for South Africa and then moves on to assess the overall
retail pharmacy. equity of the health financing system.
7Universal Health Coverage Assessment: South Africa Catastrophic payment indicators Impoverishment indicators Using the 40% threshold of non-food household While the extent of catastrophic payments indicates the expenditure for assessing catastrophic payments, Table 2 relative impact of out-of-pocket payments on household indicates that only about 0.09% of South Africans incurred welfare, the absolute impact is shown by the impoverishment catastrophic payments in 2005/06 as a result of seeking effect. Table 3 shows that, in South Africa, about 35% of health care. When these payments are weighted to account the population lived on less than $2.5 per day in 2005/06. for their concentration among the poor, the percentage When out-of-pocket expenditures were taken into account, decreased to about 0.06% signifying that the payments about 0.8% of the population was further impoverished by are more concentrated among richer groups. The same is paying out-of-pocket for health care. This translated into the case for the catastrophic gap and weighted gap. about 370,000 South Africans. However, it is agreed in the international literature that The normalised poverty gap (also shown in Table 3) this indicator is difficult to interpret as it understates measures the percentage of the poverty line necessary to the actual problem: it does not capture the reality that raise an individual who is below the poverty line to that there are people who do not utilize health services when line. On average, the normalised mean poverty gap needed because they are unable to afford out-of-pocket increased by about 0.4%. The impoverishing impact of payments, or other indirect costs, at all (Wagstaff and van out-of-pocket payments is relatively small in South Africa Doorslaer 2003). compared to countries where out-of-pocket payments are Table 2: Catastrophic payment indicators for South Africa in 2005/06* Catastrophic payment headcount index (the percentage of households whose out-of-pocket payments for health care as a percentage of 0.09% household consumption expenditure exceeded the threshold) Weighted headcount index** 0.06% Catastrophic payment gap index (the average amount by which out-of-pocket health care payments as a percentage of household 0.01% consumption expenditure exceed the threshold) Weighted catastrophic gap index**
Universal Health Coverage Assessment: South Africa

the dominant means of health financing. However, these                                   is measured by the Kakwani index: a positive value for
measures do not indicate the extent to which individuals                                 the index means that the mechanism is progressive; a
may not be using needed health services due to inability to                              negative value means that poorer households pay a
pay the costs associated with use.                                                       larger proportion of their income and that the financing
                                                                                         mechanism is therefore regressive. Table 4 provides an
                                                                                         overview of the distribution of the burden of financing the
Equity in financing                                                                      South Africa health system across different socio-economic
                                                                                         groups (i.e. the financing incidence) as well as the Kakwani
Equity in financing is strongly related to financial protection                          index for each financing mechanism.
(as described by the indicators above) but is a distinct issue
and health system goal. It is generally accepted that financing                          As shown in Table 4, all direct taxes were progressive in
of health care should be according to the ability to pay.                                2005/06. Personal income tax, which accounted for 12%
                                                                                         of total health care funds, was more progressive than
A ‘progressive’ health financing mechanism is one in                                     corporate income tax, which accounted for about 10%
which the amount richer households pay for health care                                   of total health funds. Personal income tax rates are very
represents a larger proportion of their income. Progressivity                            progressively structured, ranging from 18% for the lowest

Table 4: Incidence of different domestic financing mechanisms in South Africa (2005/06)

Financing mechanism                                                                                            Percentage share        Kakwani index

Direct taxes
                 Personal income taxes                                                                                 12.1%                 0.22
                 Corporate profit taxes                                                                                10.1%                 0.05
                 Total direct taxes                                                                                    22.2%                 0.03
Indirect taxes
                 VAT                                                                                                   10.9%                -0.11
                 Excise tax on tobacco and alcohol                                                                      1.5%                -0.32
                 Excise (fuel levy)                                                                                     2.0%                -0.10
                 Import and export duties                                                                                    -                   -
                 Total indirect taxes                                                                                  14.4%                -0.02
Other taxes                                                                                                             3.7%                     -
Mandatory health insurance contributions                                                                                  n/a                  n/a

Total public financing sources                                                                                        40.3%                  0.01
Commercial voluntary health insurance                                                                                  45.3%                 0.14
Community-based health insurance                                                                                          n/a                    -
Out-of-pocket payments                                                                                                 14.3%                -0.04

Total private financing sources                                                                                       59.6%                  0.06
Total financing sources                                                                                             100.0%                   0.07
Note: Estimates are based on per adult equivalent expenditures; n/a = not applicable; - = no data available.
Source: Ataguba and McIntyre (2012)

                                                                                   9
Universal Health Coverage Assessment: South Africa
income earners to 40% for the highest income earners. Equitable use of health services
Corporate income tax is levied at 30%.
and access to needed care
All indirect taxes were regressive in 2005/06. Excise on
alcohol and tobacco was the most regressive. Out-of- This section considers how benefits from using
pocket payments, which accounted for about 14% of total different types of health services are distributed across
health funds in 2005/06, were also regressive. socio-economic groups. One measure of this is a
concentration index, which shows the magnitude of
Private health insurance scheme contributions were a very socioeconomic-related inequality in the distribution of
progressive financing mechanism when viewed over the entire a variable. In Table 5, if the concentration index has a
population. This is not surprising given the distribution of scheme positive (or negative) value, the distribution of the use
membership: only about 16% of the population, comprising of the health service is considered to benefit the richest
the richest South Africans and those in formal employment, (or poorest) respectively.
purchase private insurance cover, whereas the poor are often
non-scheme members. However, it is important to note that the As shown in Table 5, only the use of public sector non-
distribution of these contributions is regressive across privately hospital outpatient services (i.e. public clinics and
insured South Africans because the two lowest income quintiles community health centres) can be defined as pro-poor
of medical scheme members devote approximately 14% of in South Africa. Hospital level outpatient services benefit
their income to insurance contributions compared to less than the rich more than the poor. Combining the benefits
6% for the richest quintile (McIntyre et al 2012). from using non-hospital outpatient facilities and
hospital level facilities, a mildly pro-poor distribution
Overall, combining general government revenue, direct is obtained (given the high percentage of outpatient
out-of-pocket payments and private health insurance visits that occur within non-hospital primary care
contributions, health care financing was mildly progressive facilities). For public sector inpatient services, the rich
in South Africa in 2005/06. The relative regressivity of benefit significantly more than the poor. When these
indirect taxes and out-of-pocket payments was dominated results are disaggregated, use of higher-level referral
by the relative progressivity of direct taxes and private facilities such as central and tertiary hospitals benefit
health insurance contributions, especially because the the rich considerably more than the poor (Ataguba and
latter accounted for 45% of financing. McIntyre 2012).
Table 5: Concentration indexes for benefit incidence of health service use in South Africa (2008)
Type of Service Outpatient visits Inpatient visits
Public facilities
Public hospitals 0.015 0.112
Non-hospital facilities -0.134 n/a
Total -0.021 0.112
Private not-for-profit facilities (e.g. missions)
Hospitals n/a n/a
Non-hospital facilities n/a n/a
Total n/a n/a
Private for-profit facilities
Hospitals 0.369 0.532
Non-hospital facilities 0.395 n/a
Total 0.383 0.532
Total 0.198 0.268
Note: Estimates are based on per adult equivalent expenditures; n/a = not applicable; - = no data available.
Source: Ataguba and McIntyre (2012)
10Universal Health Coverage Assessment: South Africa
The results for private services clearly show a strongly demonstrates that there is a serious misalignment between
pro-rich distribution. This is the case for both inpatient the distribution of benefits from using health care relative
and outpatient services and for the use of both hospital to the distribution of need across socio-economic groups.
and non-hospital facilities. Overall, given that benefits While the poor bear a greater burden of ill health, their
from both public and private health sector services are share of benefits from using health care is far lower than
mainly pro-rich, it is not surprising that overall health their share of need, and vice versa for the rich.
service benefits are strongly pro-rich for both inpatient and
outpatient services. As some may be concerned about the reliability of
self-assessed health status as a measure of need for
It is generally agreed that individuals’ use of health services health care, Figure 4 is presented to confirm that the
should be in line with their need for care. The universal poor bear a far greater burden of ill-health, not only in
coverage goal of promoting access to needed health care relation to infectious diseases but increasingly also non-
can be interpreted as reducing the gap between the need communicable diseases.
for care and actual use of services, particularly differences
in use relative to need across socio-economic groups. There is considerable evidence of access barriers in South
The benefit incidence results discussed above do not allow Africa, with these barriers being greatest for the poorest
one to draw a categorical conclusion about whether the (Cleary et al., 2013, Harris et al., 2011, Silal et al.,
distribution is equitable or not: the distribution of benefits 2012). The existence of access constraints is suggested
first needs to be compared to the distribution of need for by the fact that 12%-14% of people in the poorest quintile
health care. who assessed their health status as poor or very poor did
not use a health service in the previous month, compared
Figure 3 presents such a comparison, using self-assessed with only 2.5% of the highest income quintile. In relation
health status drawn from the same household survey to availability issues, the biggest access constraints were
as that used for the benefit incidence analysis above. It distance to the nearest facility and lack of routine availability
Figure 3: Distribution of health benefits compared to need for health care in South Africa (2008)
100%
90%
80%
70%
% Share of benefits /need
60%
50%
40%
30%
20%
10%
0%
% Share of benefits % Share of need
Quintile 1 (poorest) Quintile 2 Quintile 3 Quintile 4 Quintile 5 (richest)
Note: need for health care is assessed using self-assed health status
Source: Ataguba and McIntyre (2012)
11Universal Health Coverage Assessment: South Africa
Figure 4: Inequality in the distribution of illness in South Africa, 2008
0.10
0.05
Age/sex standardised concentration index
0.00
-0.05
-0.10
-0.15
-0.20
-0.25
-0.30
-0.35
-0.40
T
es
a
BP
n
D
e
V
a
TB
AR
us
sio
um
oe
HI
ST
et
gh
ab
rh
u/
ab
es
a
Tr
Hi
ar
Fl
pr
Di
ug
Di
De
Dr
Source: Ataguba et al. (2011)
of essential medicines in facilities (Harris et al., 2011, Indeed, from a financial protection perspective South
Health Economics Unit, 2012). Affordability was also a Africa has fewer challenges than many other low- and
constraint, particularly in terms of the cost of transport middle-income countries. Out-of-pocket payments
to health facilities and the indirect costs associated with account for a small percentage of total health care
taking time off work (Cleary et al., 2013, Harris et al., expenditure and there are relatively low levels of
2011, Silal et al., 2012). Finally, acceptability was also catastrophic spending or impoverishment due to health
a key issue, particularly in terms of poor staff attitudes or care payments. The greatest financial protection
lack of respectful treatment by health workers (Harris et al., challenges face two groups:
2011, Silal et al., 2012).
1. Medical scheme members. Some of these face the
problem of limited benefit packages and high levels
of co-payments. Almost two-thirds of all out-of-pocket
Conclusion payments are attributable to medical scheme members
and catastrophic payments are concentrated among
A cursory glance at the South African health system may richer groups.
lead some to assume that South Africa has achieved 2. Formal sector workers who do not belong to medical
universal coverage because everyone without voluntary schemes. This group has to pay the not inconsiderable
health insurance is able to use public sector services that fees for public sector hospital care out-of-pocket.
provide a relatively comprehensive range of care. Further, There are only three income bands for the income-
although most public sector users must pay fees for hospital related user fees charged at public sector hospitals:
care, these are income-related and, more importantly, the many people who have a formal sector job fall into the
poorest, young children and pregnant women are eligible highest income category and hence are charged the
for fee waivers. highest user fees for hospital care.
12Universal Health Coverage Assessment: South Africa
The key challenge from a universal health care perspective the tax revenue pool. Within the context of considerable
in the South African context relates to the goal of access to income inequalities (where the richest 10% of the population
needed health care of sufficient quality to be effective. There account for 51% of income and the poorest 10% for only
is indisputable evidence that there is a maldistribution of 0.2% of income) (Statistics South Africa, 2008) and a far
benefits from using health services relative to need across greater burden of ill-health and hence risk of needing
socio-economic groups. This is not simply due to high levels health care on lower socio-economic groups (Ataguba et
of utilisation amongst richer groups, particularly those that al. 2011), the importance of creating an integrated pool of
are medical scheme members; utilisation rates are also very mandatory pre-payment funds in order to pursue universal
low amongst poorer groups relative to their burden of illness. coverage is indisputable.
An indicator that epitomises this challenge is the financial In any case, given the increasing costs of medical scheme
resources spent on health care for different groups. Three cover, it is unlikely that it would be affordable to many of
broad groups can be identified according to the structure those formal sector workers currently not covered. In fact,
of funding flows in the health system: medical scheme membership has remained stagnant for
the past two decades, save for a recent increase due to a
1. those who are covered by medical schemes (about relatively new voluntary medical scheme for government
16% of the population); employees in which government subsidises premiums
2. those who are not covered by medical schemes but (ironically to a greater extent than it funds care for those
who use private providers for some primary care dependent on the public sector) (McIntyre et al. 2012). In
services and pay for this on an out-of-pocket basis, addition, given the flat contribution structure for schemes
but are dependent on the public sector for specialist and the regressive distribution of contributions across
and inpatient hospital care (also about 16% of the medical scheme members, extending coverage to more
population); and people would reduce the overall progressivity of health care
3. those who are not covered by medical schemes and are financing in South Africa, as those who are not currently
dependent on the public sector for all of their health scheme members have lower incomes on average than
services (the remaining 68% of the population). current members.
Spending per person in these groups in 2008 was about In addition to these revenue generation issues, there are
R11,300, R2,500 and R1,900 respectively, representing broader issues related to the structure and operation of
a six-fold difference in spending between medical scheme the health system that impact on access to needed health
members and those entirely dependent on public sector care. In particular, South Africa has weak purchasing
services (McIntyre et al. 2012). Yet medical scheme mechanisms. Efficiency, service quality and probably
members paid significantly more out-of-pocket for health health care costs (particularly in the private sector) could
services (Ataguba and Goudge, 2012). be improved dramatically through more active purchasing.
Existing provider payment mechanisms in both the public
Figure 1 presents a striking indication of the direction in which and the private health sectors are inefficient.
South Africa needs to move in order to pursue universal
coverage: the percentage share of health care expenditure In summary, the South African health system falls short of
funded through mandatory (relative to voluntary) pre- the goal of universal coverage, both in relation to some
payment mechanisms must increase. Doing this by making aspects of financial protection and equity in financing
membership of medical schemes mandatory for particular but particularly in terms of equitable access to needed,
groups (e.g. formal sector workers earning above a certain effective and good quality health care. A number of
income) would not resolve core problems in the South drivers or causes of these problems have been identified
African health system in relation to progressing to universal above, including:
coverage; in fact, it would entrench and exacerbate the
problem. Even if there is a risk-equalisation mechanism that • An onerous burden of out-of-pocket payments on some
allowed the sharing of risk between these different schemes, individuals due to the uneven implementation of user
there would still be a lack of income and risk cross-subsidies fee exemptions at public hospitals and for those not
between those covered by this ‘mandatory medical scheme’ eligible for exemption from user fees yet with limited
pool and those who are dependent on services funded from ability to cover these fees on an out-of-pocket basis;
13Universal Health Coverage Assessment: South Africa
• A range of barriers to health service access other than user • Weak purchasing including a poor incentive environment.
fees, including an under-supply and a maldistribution
of health workers relative to the distribution of the These are some of the issues that need to be addressed
population with the greatest need for health care; if South Africa is to make progress towards universal
• A relatively low share of mandatory pre-payment health coverage. While the South African government has
funding in the context of the goal of universal coverage; published a draft policy on National Health Insurance,4
• Fragmented funding and risk pools, which limit the many of the details are yet to be finalised and so it is still
potential for income and risk cross-subsidies; and too early to assess how this policy addresses these issues.
4
Different countries use the terms ‘national health insurance,’ ‘social health insurance’ and ‘social security’ differently to describe different types of mandatory health
insurance. In each country assessment in this series, the term applied is the one commonly in use in the country in question. In South Africa, the proposed National Health
Insurance is intended to cover the entire population.
14Universal Health Coverage Assessment: South Africa
References
Alaba O, McIntyre D. 2012. What do we know about McIntyre D, Doherty JE, Ataguba JE. 2012. Health care
health service utilisation in South Africa? Development financing and expenditure: post-1994 progress and
Southern Africa 29: 704-724. remaining challenges. In: van Rensburg HCJ (ed.) Health
and health care in South Africa. Pretoria: Van Schaik.
Ataguba JE, Akazili J, McIntyre D. 2011. Socioeconomic-
related health inequality in South Africa: evidence from
McIntyre D, Kutzin J. 2011. Revenue collection and pooling
General Household Surveys. International Journal for
arrangements in health system financing. In: Smith R,
Equity in Health 10: 48.
Hanson K. (eds.) Health systems in low- and middle-
Ataguba JE, Goudge J. 2012. The impact of health income countries. Oxford: Oxford University Press.
insurance on health-care utilisation and out-of-pocket
payments in South Africa. The Geneva Papers on Risk McIntyre D, Mcleod H. In press. Private health insurance in
and Insurance-Issues and Practice; 37; 633-654. South Africa. In: Thomson S, Mossialos E, Evans R (eds.)
Private health insurance and medical savings accounts:
Ataguba JE, McIntyre D. 2012. Paying for and receiving lessons from international experience. Cambridge:
benefits from health services in South Africa: is the Cambridge University Press.
health system equitable? Health Policy and Planning
27: 35-45.
Mills A, Akazili J, Ataguba J, Borghi J, Garshong B,
Cleary S, Birch S, Chimbindi N, Silal S, McIntyre D. 2013. Makawia S, Mtei G, Harris B, Macha J. Meheus,
Investigating the affordability of key health services in McIntyre D. 2012. Equity in financing and use of health
South Africa. Social Science and Medicinw 80: 37-46. care in Ghana, South Africa and Tanzania: Implications
for paths to universal coverage. Lancet 380: 126-133.
Harris B, Goudge J, Ataguba J, McIntyre D, Nxumalo N,
Govender V, Jikwana S, Chersich M. 2011. Inequities
Silal S, Penn-Kekana L, Harris B, Birch S, McIntyre D. 2012.
in access to health care in South Africa. Journal of
Exploring inequalities in access to and use of maternal
Public Health Policy 31: S102-123.
health services in South Africa. BMC Health Services
Health Economics Unit 2012. Community preferences for Research 12: 120.
improving public sector health services in South Africa. What
aspects of public sector health service quality improvements Statistics South Africa. 2008. Income and expenditure of
should be prioritised? HEU Policy Brief. Cape Town: Health households 2005/2006: analysis of results. Pretoria:
Economics Unit, University of Cape Town. Statistics South Africa.
McIntyre D. 2010. Private sector involvement in the
Wagstaff A, van Doorslaer E. 2003. Catastrophe and
funding and provision of health services in South
impoverishment in paying for health care: with
Africa: Implications for equity and access to health
applications to Vietnam 1993-1998. Health Economics
care. EQUINET Discussion Paper 84. Harare: Regional
12(11): 921-934.
Network for Equity in Health in Southern Africa.
McIntyre D. 2012. What healthcare financing changes are World Health Organization. 2010. Health system financing:
needed to reach universal coverage in South Africa. the path to universal coverage. The World Health Report
South African Medical Journal 102: 489-490. 2010. Geneva: World Health organization.
15Universal Health Coverage Assessment: South Africa
Acknowledgments
This country assessment is part of a series produced by GNHE (the Global Network for Health Equity) to profile
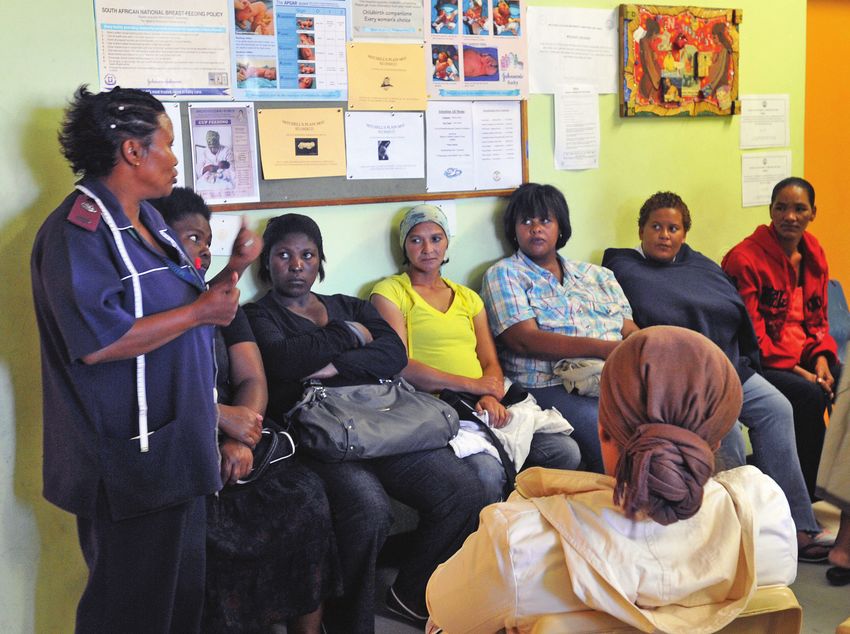
universal health coverage and challenges to its attainment in countries around the world. The cover photograph
for this assessment was taken by Brenton Geach.
The series draws on aspects of: McIntyre D, Kutzin J. 2014. Guidance on conducting a situation analysis of health
financing for universal health coverage. Version 1.0. Geneva: World Health Organization. The series is edited by
Jane Doherty and desk-top published by Harees Hashim. Chamara Anuranga produced the function summary
charts for the series based on data supplied by the authors.
The work of GNHE and this series is funded by a grant from IDRC (the International Development Research
Centre) through Grant No. 106439.
More about GNHE …
GNHE is a partnership formed by three regional health equity networks – SHIELD (Strategies for Health Insurance
for Equity in Less Developed Countries Network in Africa), EQUITAP (Equity in Asia-Pacific Health Systems Network
in the Asia-Pacific, and LANET (Latin American Research Network on Financial Protection in the Americas). The
three networks encompass more than 100 researchers working in at least 35 research institutions across the globe.
GNHE is coordinated by three institutions collaborating in this project, namely: the Mexican Health Foundation
(FUNSALUD); the Health Economics Unit of the University of Cape Town in South Africa; and the Institute for
Health Policy based in Sri Lanka.
More information on GNHE, its partners and its work can be found at http://gnhe.org
16You can also read