University of Texas at Austin Energy Symposium 2013 Energy Innovation and Entrepreneurship - April 30, 2013
←
→
Page content transcription
If your browser does not render page correctly, please read the page content below

April 30, 2013

University of Texas at Austin Energy Symposium 2013
      Energy Innovation and Entrepreneurship

                                                    NYSE: LPI
                                         www.laredopetro.com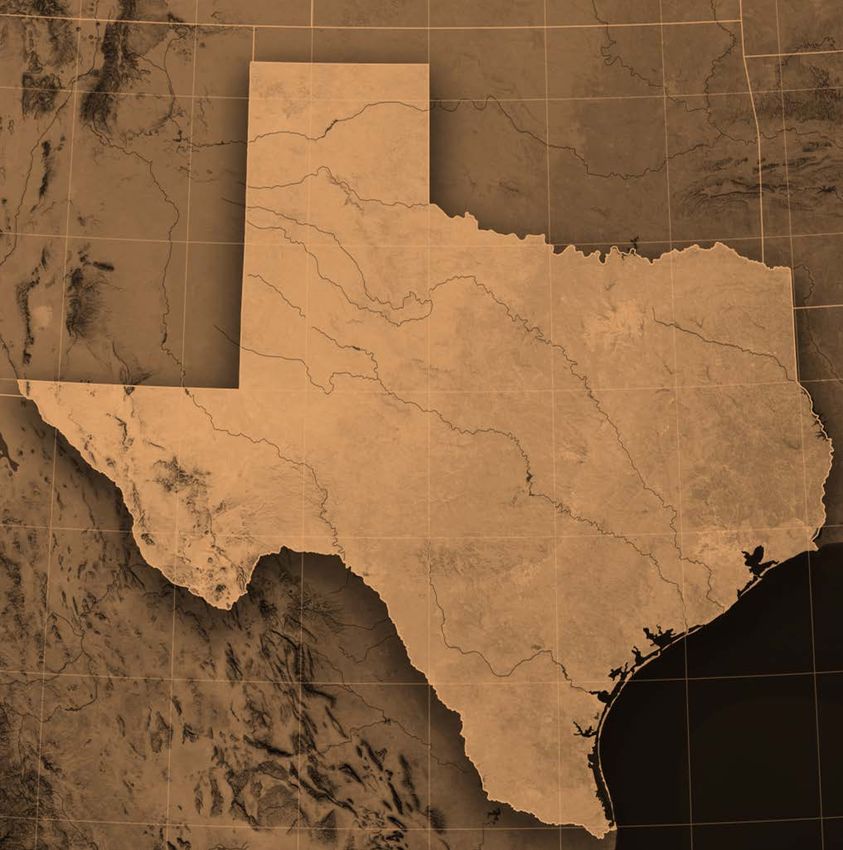
Forward-Looking / Cautionary Statements
This presentation (which includes oral statements made in connection with this presentation) contains forward-looking statements within the meaning of Section 27A of the Securities Act of
1933 and Section 21E of the Securities Exchange Act of 1934. All statements, other than statements of historical fact, included in this presentation that address activities, events or
developments that Laredo Petroleum Holdings, Inc. (the “Company”, “Laredo” or “LPI”) assumes, plans, expects, believes or anticipates will or may occur in the future are forward-looking
statements. The words “believe,” “expect,” “may,” “estimates,” “will,” “anticipate,” “plan,” “intend,” “foresee,” “should,” “would,” “could,” or other similar expressions are intended to identify
forward-looking statements, which are generally not historical in nature. However, the absence of these words does not mean that the statements are not forward-looking. Without limiting
the generality of the foregoing, forward-looking statements contained in this presentation specifically include the expectations of plans, strategies, objectives and anticipated financial and
operating results of the Company, including as to the Company’s drilling program, production, hedging activities, capital expenditure levels and other guidance included in this presentation.
These statements are based on certain assumptions made by the Company based on management’s expectations and perception of historical trends, current conditions, anticipated future
developments and other factors believed to be appropriate. Such statements are subject to a number of assumptions, risks and uncertainties, many of which are beyond the control of the
Company, which may cause actual results to differ materially from those implied or expressed by the forward-looking statements. These include risks relating to financial performance and
results, current economic conditions and resulting capital restraints, prices and demand for oil and natural gas, availability of drilling equipment and personnel, availability of sufficient capital
to execute the Company’s business plan, impact of compliance with legislation and regulations, successful results from our identified drilling locations, the Company’s ability to replace reserves
and efficiently develop and exploit its current reserves and other important factors that could cause actual results to differ materially from those projected as described in the Company’s
Annual Report on Form 10-K for the year ended December 31, 2012, and other reports filed with the Securities and Exchange Commission (“SEC”).
Any forward-looking statement speaks only as of the date on which such statement is made and the Company undertakes no obligation to correct or update any forward-looking statement,
whether as a result of new information, future events or otherwise, except as required by applicable law.
The SEC generally permits oil and gas companies, in filings made with the SEC, to disclose proved reserves, which are reserve estimates that geological and engineering data demonstrate with
reasonable certainty to be recoverable in future years from known reservoirs under existing economic and operating conditions and certain probable and possible reserves that meet the SEC’s
definitions for such terms. In this presentation, the Company may use the terms “unproved reserves”, “unbooked resource potential”, “estimated ultimate recovery”, “EUR” or other
descriptions of volumes of reserves, which the SEC guidelines restrict from being included in filings with the SEC. The Company does not choose to include unproved reserve estimates in its
filings with the SEC. “Unproved reserves” refers to the Company’s internal estimates of hydrocarbon quantities that may be potentially discovered through exploratory drilling or recovered
with additional drilling or recovery techniques. “Unbooked resource potential” is used by the Company to refer to the estimated quantities of hydrocarbons that may be added to proved
reserves, largely from a specified resource play. A resource play is a term used by the Company to describe an accumulation of hydrocarbons known to exist over a large areal expanse and/or
thick vertical section, which, when compared to a conventional play, typically has a lower geological and/or commercial development risk. Estimated ultimate recovery, or “EUR”, refers to the
Company’s internal estimates of per well hydrocarbon quantities that may be potentially recovered from a hypothetical future well completed as a producer in the area. Unproved reserves,
EURs and unbooked resource potential, may not constitute reserves within the meaning of the Society of Petroleum Engineer’s Petroleum Resource Management System or SEC rules and do
not include any proved reserves. Actual quantities that may be ultimately recovered from the Company’s interests will differ substantially. Factors affecting ultimate recovery include the scope
of the Company’s ongoing drilling program, which will be directly affected by the availability of capital, drilling and production costs, availability of drilling services and equipment, drilling
results, lease expirations, transportation constraints, regulatory approvals and other factors, as well as actual drilling results, including geological and mechanical factors affecting recovery
rates. Estimates of unproved reserves, EURs and unbooked resource potential may change significantly as development of the Company’s core assets provide additional data. In addition, the
Company’s production forecasts and expectations for future periods are dependent upon many assumptions, including estimates of production decline rates from existing wells and the
undertaking and outcome of future drilling activity, which may be affected by significant commodity price declines or drilling cost increases.
This presentation includes financial measures that are not in accordance with generally accepted accounting principles (“GAAP”), including Adjusted EBITDA. While management believes that
such measures are useful for investors, they should not be used as a replacement for financial measures that are in accordance with GAAP. For a reconciliation of Adjusted EBITDA to the
nearest comparable measure in accordance with GAAP, please see the Appendix.

                                                                                                                                                                                                 2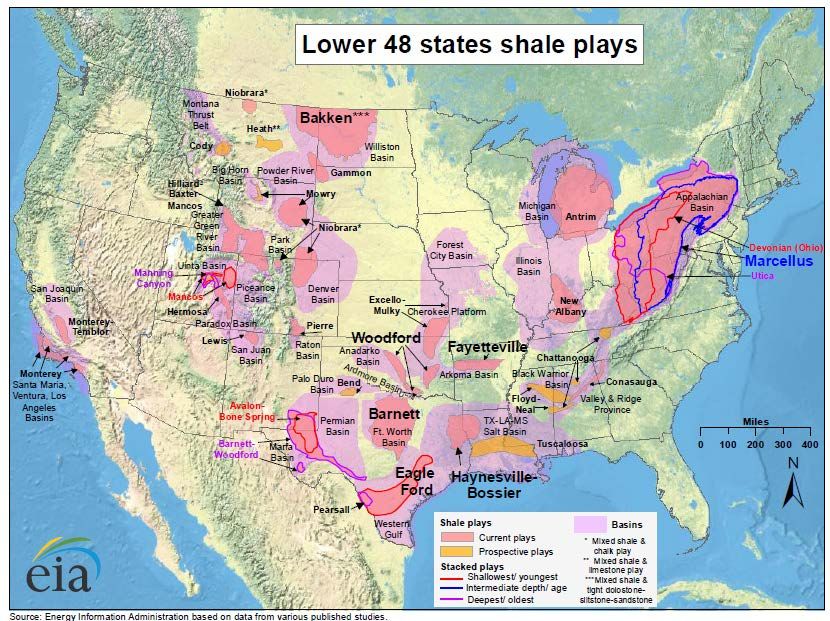
Technological Innovations Create Step Changes

                           Offshore Drilling

Rotary Drill Bit

                                                           .
                                                 Horizontal Drilling and
                                                  Hydraulic Fracturing

                                                                           3
Horizontal Drilling & Hydraulic Fracturing: Unlocking Potential
Horizontal drilling, hydraulic fracturing and long-reach laterals Groundwater Water wells >1,000
aquifer feet
Multi-stage horizontal fracturing
Fracturing fluids and techniques
Steel casing and
Seismic and other geophysical analysis of drilling locations
cement to protect
groundwater
Reductions in environmental impacts (pad drilling, water
conservation and recycling, reformulation of additives, etc) Protective
steel casing
Shale fractures
10,000+ Feet
Horizontal Drilling and Hydraulic Fracturing Have Revolutionized the Oil and Gas Industry
4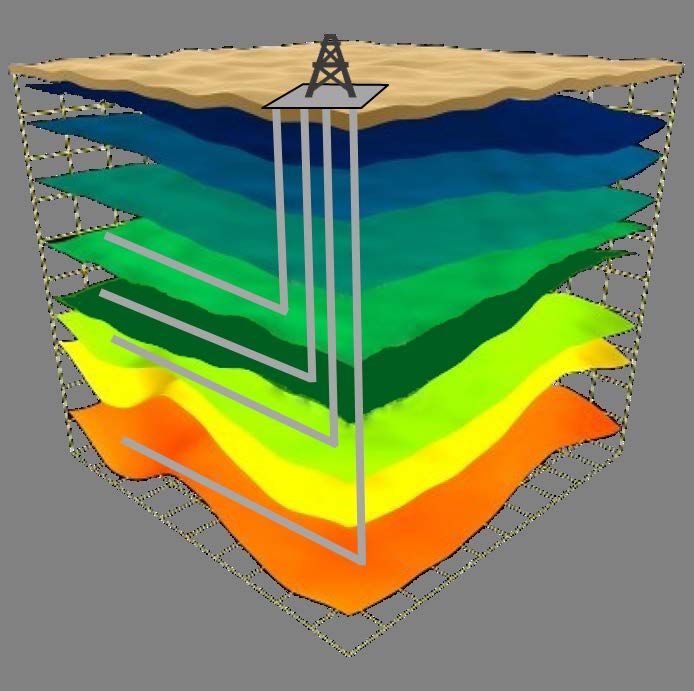
Shale Gas Revolutionized North American Natural Gas Development
Large-scale application
of horizontal drilling
and hydraulic
fracturing techniques
in the shale plays
began in the early
2000s.
Since 2005, shale gas
production has been
increasing by about
50% per year.
5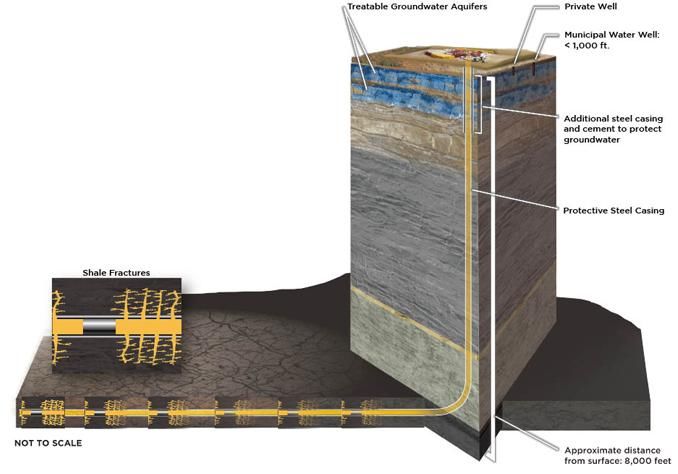
Oil Shale Revolution Changing U.S. Energy Landscape

                                      U.S. Avg Daily Oil Production (1970-2015)
                           11,000

                           10,000

                            9,000
                                                                                                    Oil Shale
Thousand Barrels per day

                            8,000                                                                   Revolution
                                                                                                    Begins!
                            7,000

                            6,000

                            5,000

                            4,000

                            3,000
                                    1970          1975           1980   1985   1990   1995   2000      2005      2010   2015

                                           Source: EIA, Raymond James                                                    6
Where is it Coming From?

                           7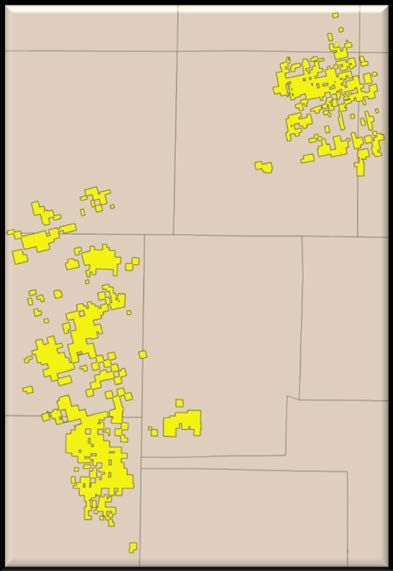
Energy Independence Now a Real Speaking Point

North American Energy Independence
   and Security are now possible

                                                  8
“L” Companies have Capitalized on the Changing Energy Landscape

     1991   1992     1993   1994     1995   1996   1997    1998   1999   2000   2001   2002   2003   2004    2005   2006   2007    2008   2009   2010   2011   2012

     Colt Resources Corp.                     Lariat Petroleum, Inc.               Latigo Petroleum, Inc.                    Laredo Petroleum, Inc.
   Sold to JN Resources in 1996                Sold to Newfield in 2001            Sold to Pogo Producing                         Founded in October 2006
          for $33.5 million                        for $333 m illion               in 2006 for $750 million
    Equity Investor: First Reserve            Equity Investor: Warburg Pincus     Equity Investors: Warburg Pincus            Equity Investor: Warburg Pincus
                                                                                                   JPMorgan

                                                                                                                                                        $3,620
  ($ millions)
   Equity Utilized                                                                                                                          $2,750

   Debt Utilized

   Sales Price / Enterprise Value
                                                                                                                                            $1,215

                                                                                                      $750

                                                                  $333                   $360
                                                   $174
            $13         $33.5                                                                                                                $710
                                                                                         $200
                                                    $100
                                                    $74                                  $160
  Focus Areas:

                       A 20+-Year History of Generating Significant Value for Investors
                                                                                                                                                                      9
The “L” Company Culture

INTEGRITY – Always do the right thing.

STEWARDSHIP – Take care of the company,
  industry and environment.

RESPECT – Treat people everywhere the way you
  want to be treated.

TEAMWORK – One company working together to
  achieve common goals.

SUCCESS – Driven to succeed and plan for success.
                                                    10
Critical Elements for “L” Companies
Plan for success from day one
Determine your strengths
Determine area of concentration
Develop a business plan
Secure “correct” equity funding
11The Private Equity Market
INVESTORS Advantages
• Pension funds Fast Access to Capital
• Endowments Strategic Advice
• Foundations Formal Structure
Bank holding
•
companies
Credibility
Private Equity Provider
• High-net-worth
individuals Disadvantages
• Investment banks
Fast Equity Dilution
• Corporations Strategic Advice
• Other investors Formal Structure
Investment Cycle
12Requirements for Private Equity Partners
Compatibility
Access to significant capital
Long-term investment cycle
Understand oil and gas industry risk and reward
Strategic advice / experience
Allow a strong outside board of directors
13Warburg Pincus: Strong Track Record Supporting E&P Companies
Warburg Pincus: Sample of their Worldwide Energy Companies:
Warburg Pincus’ philosophy of not “over leveraging” entities provides prudent balance sheet
stewardship
Management leverages Warburg Pincus’ relationships and industry contacts to support Company
Warburg Pincus has taken over 120 of their portfolio companies public
Laredo formed through a $600 million equity commitment from Warburg Pincus and members of
management
14Laredo Overview
NYSE: LPI
Market Cap: ~$2.4 Billion
Total Enterprise Value: ~$3.6 Billion
Total Company
Permian oil focused
Low-risk drilling inventory >10 years
Proved reserves: 188.6 MMBOE1
Average daily production: ~33.3 MBOE/D
during Q4-20121
Sound financial structure
• Rapidly growing cash flow from
operations
• Operational and financial flexibility
maintains capital options
1 Production and reserves reported on a two-stream basis. Reserves are gas price adjusted to reflect NGL benefit. Proved reserves per Ryder Scott evaluation at 12/31/12, at SEC pricing.
15Concentrated Asset Portfolio Focused in Permian Basin
Permian
China Grove
Tulsa
Headquarters
Midland
Basin
Permian
Delaware Garden City
Basin
Permian Basin – ~203,500 net acres 1
• ~85% of total company reserves
• ~69% of Q4-2012 total production
• ~92% working interest - average
1 Acreage totals as of 12/31/12. 16Consistent Growth in Reserves and Production
Permian oil is driving repeatable growth
Reserves Production 34.5-35.9
200 188.6 35
180 30.9
30
156.5
160
136.6 48% 25 23.7 19.0
140
120 64% 17.3
20
MBOE/D
MMBOE
67%
100
14.3 14.5
80 15
9.8
60 44.2
52.5
10 9.8
52% 16.2
40 89% 13.6
36% 4.2 8.4
92% 33% 5 9.2
20
8% 11% 3.7 4.5
- 0 0.5 1.4
2008 2009 2010 2011 2012 2008 2009 2010 2011 2012 2013 E
Successful transition to 2013
higher value oil reserves 25% growth in oil production
Targeting 15% total production growth
Reserves reported on a two-stream basis with gas price adjusted to reflect NGL benefit; per Ryder Scott evaluation at 12/31/12, at SEC pricing.
Production data includes production from Broad Oak Energy, Inc. on a combined basis and presented on a two-stream basis. 17
CAGR in MBOE/D production from 2008 through midpoint of projected 2013.Permian Basin: Multiple Targets of Opportunity
Howard
Mitchell
Martin
Midland
Sterling
85+ miles
Glasscock
Reagan
LPI Acreage Tom Green Commercial horizontal
LPI Horizontal Wells
Upton
Upper Wolfcamp
development has been
Middle Wolfcamp Irion proven for all four zones
Lower Wolfcamp
Cline
from >60 wells
20+ miles
1 Well counts as of 2/28/13
2 Based on 2012 and 2013 completions with at least 30 days of production history as of 2/28/13 18Identified Resource Potential – De-risked Acreage To-Date
1800 Identified Resource Potential1
1,415 + 1,600 +
1600
De-risked Resource Potential of greater
than 1,600 MMBOE
1400
1200
Additional upside to resource potential for
continued delineation of:
1000 • Hz Upper Wolfcamp
Hz Middle Wolfcamp
MMBOE
•
• Hz Lower Wolfcamp
800 • Hz Cline
600 15+ year of development opportunities
400
Development of our identified resource
189 potential will require access to additional
200 capital
0
• Debt capital markets
Estimated Total Additional Identified • Equity capital markets
Proved Reserves De-risked De-risked
12/31/12 Resource Resource
Potential Potential
1 De-risked acreage and resource potential totals as of 2/28/13
19Laredo’s Debt Financing
Strong bank group
$825 million Revolving Credit Facility from commercial banks
Comprehensive risk management program
Public debt
$550 million HY 9.5% Senior Notes due 2019
$500 million HY 7.375% Senior Notes due 2022
Laredo’s Bank Group Includes:
20Laredo’s Initial Public Offering
Advantages to public equity Disadvantages to public equity
Access to capital Expensive and time consuming
Increased liquidity Restrictions
Public currency for acquisitions Broader shareholder base
Enhanced benefits for current employees Reduced control
21What Are The Next Innovations in Oil and Gas?
Horizontal Drilling and
Hydraulic Fracturing
Offshore Drilling
?
Rotary Drill Bit
.
22NYSE: LPI www.laredopetro.com
You can also read