Unleashing the Power of Data Through Organization: Structure and Connections for Meaning, Learning and Discovery - Nomos eLibrary
←
→
Page content transcription
If your browser does not render page correctly, please read the page content below
Knowl. Org. 42(2015)No.6                                                                                                             401
D. Soergel. Unleashing the Power of Data Through Organization: Structure and Connections for Meaning, Learning and Discovery

     Unleashing the Power of Data Through Organization:
                Structure and Connections for
              Meaning, Learning and Discovery†
                                                            Dagobert Soergel

                    University at Buffalo, Department of Library and Information Studies,
                 Graduate School of Education, 534 Baldy Hall, Buffalo, NY 14260-1020, USA

Dagobert Soergel is Professor, Department of Library and Information Studies, University at Buffalo 2009-
and Professor emeritus, College of Information Studies, University of Maryland (1970-2010). He has been
working in the area of classification and thesauri for 55 years. He authored the still-standard text and handbook
Indexing Languages and Thesauri. Construction and Maintenance (Wiley 1974) and Organizing Information (Academic
Press 1985, American Society of Information Science Best Book Award), and 100+ papers and presentations
in information retrieval, classification/ontologies, digital libraries, sense making, and relevance. He received the
American Society for Information Science Award of Merit in 1997.

Soergel, Dagobert. Unleashing the Power of Data Through Organization: Structure and Connections
for Meaning, Learning and Discovery. Knowledge Organization. 42(6), 401-427. 65 references.

Abstract::
                                                    The Future of Knowledge Organization
                                                                          Knowledge organization is needed everywhere
                                   Create the future of KO
                                   Think BIG.      Think answers not pointers.
                                                   Focus on substantive data
                                   Many areas, tasks, and functions that could profit from KO principles
                                   Engage with ontologies, AI, data modeling

Knowledge organization is needed everywhere. Its importance is marked by its pervasiveness. This paper will show many areas, tasks, and
functions where proper use of knowledge organization, construed as broadly as the term implies, provides support for learning and un-
derstanding, for sense making and meaning making, for inference, and for discovery by people and computer programs and thereby will
make the world a better place. The paper focuses not on metadata but rather on structuring and representing the actual data or knowledge
itself and argues for more communication between the largely separated KO, ontology, data modeling, and semantic web communities to
address the many problems that need better solutions. In particular, the paper discusses the application of knowledge organization in
knowledge bases for question answering and cognitive systems, knowledge bases for information extraction from text or multimedia, lin-
ked data, big data and data analytics, electronic health records as one example, influence diagrams (causal maps), dynamic system models,
process diagrams, concept maps, and other node-link diagrams, information systems in organizations, knowledge organization for under-
standing and learning, and knowledge transfer between domains. The paper argues for moving beyond triples to a more powerful repre-
sentation using entities and multi-way relationships but not attributes.

Received: 19 August 2015; Accepted 18 August 2015

Keywords: data, knowledge organization, information, entity, types

† I thank Stella Dextre Clark for many useful editing suggestions and Olivia Helfer for assistance in finding references.

                                                        https://doi.org/10.5771/0943-7444-2015-6-401
                                                 Generiert durch IP '46.4.80.155', am 03.06.2021, 10:58:31.
                                          Das Erstellen und Weitergeben von Kopien dieses PDFs ist nicht zulässig.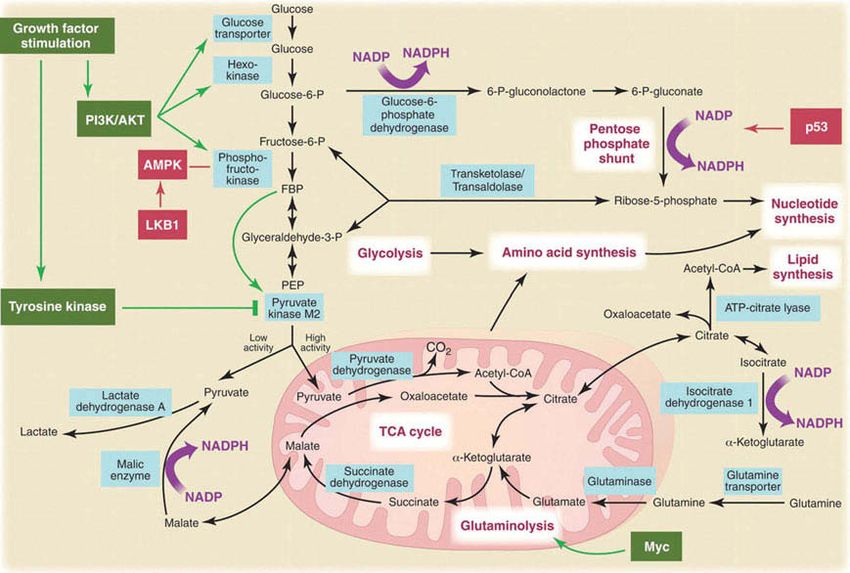
402                                                                                                       Knowl. Org. 42(2015)No.6
       D. Soergel. Unleashing the Power of Data Through Organization: Structure and Connections for Meaning, Learning and Discovery

Cab driver: Where to?                                                                    drawn from such data, and sage advice on how to conduct
Chancellor's Chief of Staff: It doesn't matter. I am needed everywhere.                  one’s life―all can be formally represented by a set of
Apocryphal                                                                               propositions.
                                                                                            Knowledge organization, broadly construed, deals with
1.0 Introduction                                                                         methods for representing and structuring a set of proposi-
                                                                                         tions. This requires knowledge about knowledge in two
Knowledge organization is needed everywhere, it is perva-                                layers:
sive. There are many areas, tasks, and functions where
knowledge organization can make the world a better place                                 1. Entity-Relationship (E-R) schema layer: a model of a
through support for daily operations (treating patients, mak-                               domain specifying the “types of entities” the domain
ing a loan), for learning and understanding, for creating                                   covers (such as person, place, date, chemical substance,
meaning, for sense making, for decision making, for infer-                                  disease, concept/topic) and the “types of relationships”
ence, and for discovery by people and computer programs.                                    that can be used to connect two or more entities into
   This paper is based on a keynote address presented at                                    propositions (such as person  (place
the Fourth Biennial ISKO UK Conference on 14 July                                            Date  Date) or chemical substance
2015: “Knowledge organization–Making a difference: the                                       disease. Such a model is called an entity-
impact of knowledge organization on society, scholarship                                    relationship (E-R) “schema” or “data model” or “on-
and progress.” The keynote was “to address the role that                                    tology” (in one meaning of that word) or, in the Web
KO should have in the future,” “the opportunities that lie                                  context, “vocabulary.” The schema may also include in-
ahead for KO, and what difference it could really make                                      tegrity rules, which specify for each relationship the
for economic, scientific and/or cultural development”                                       types of entities it connects (for binary relationships:
(http://www.isko2014.confer.uj.edu.pl/en_GB/o-konfer                                        domain and range).
encji) To create the future of knowledge organization we                                 2. Authority layer: Lists of individual “entity values” and
should 1) broaden the application areas where the KO                                        their names or identifiers so that propositions about
community contributes its much-needed expertise and 2)                                      these individual entities can be formulated. For exam-
expand KO theory in the process. Section 2 discusses                                        ple, we need to know the persons and places to be cov-
such applications and illustrates how KO can contribute.                                    ered with their names and universally consistent URIs
Section 3 discusses general issues in data modeling and                                     (universal resource identifiers). Providing these entity
KO that need to be addressed to fully reach the potential                                   values is the function of “authority lists,” including
of these applications, challenging some long-standing,                                      “name authorities” (such as maintained by the Library
widespread, and firmly ingrained ways of thinking, par-                                     of Congress), “gazetteers,” “thesauri,” “classifications”
ticularly in entity-relationship (E-R) modeling. Section 4                                  (also called ontologies), such as the Universal Decimal
presents conclusions for the role of KO professionals                                       Classification (UDC), SNOMED CT (systematized
and implications for education. This is not a detailed re-                                  nomenclature of medicine-clinical terms), and the har-
view but rather a broad overview and framework, putting                                     monized commodity description and coding system.
known detail into a new perspective.                                                        Such systems often contain also world knowledge.

1.1 Knowledge and its organization                                                       To sum up (Soergel 2009, 3), “knowledge organization
                                                                                         systems (KOS[s]) cover a wide range of systems at both
Knowledge is a representation―in the mind, in computer                                   layers serving a wide range of purposes. They are known
systems, or on paper―of the “real world” (physical, social)                              under names such as ontology, metadata schema, taxon-
and of assumptions, beliefs, thoughts, feelings, emotions                                omy, classification, Web directory structure, filing plan,
of others or our own. Knowledge is a basis for action, an                                thesaurus, dictionary, folksonomy, and more.”
influence on one's mental state, a source of enjoyment,
and more. Knowledge can be represented through a distri-                                 1.2 The wide scope of application of knowledge organization (KO)
bution of node weights and connection strengths in a neu-
ral network or by a set of propositions. Often a distinction                             In the KO community, emphasis has been on metadata
is made between data, information, knowledge, and wis-                                   and on KO to support searching; there are good reviews
dom. While superficially this distinction may seem helpful,                              on this (for example, with a focus on the bibliographic
it oversimplifies important distinctions between pieces of                               universe, Dunsire et al. 2012). There is also much discus-
knowledge based on several characteristics. From the per-                                sion on whether manual indexing/subject cataloging is
spective of knowledge organization the distinction is ir-                                still needed (either way, we need KO to assist users in
relevant. Data from empirical observations, conclusions                                  search) and the role of KO in social tagging (KO can as-

                                                             https://doi.org/10.5771/0943-7444-2015-6-401
                                                      Generiert durch IP '46.4.80.155', am 03.06.2021, 10:58:31.
                                               Das Erstellen und Weitergeben von Kopien dieses PDFs ist nicht zulässig.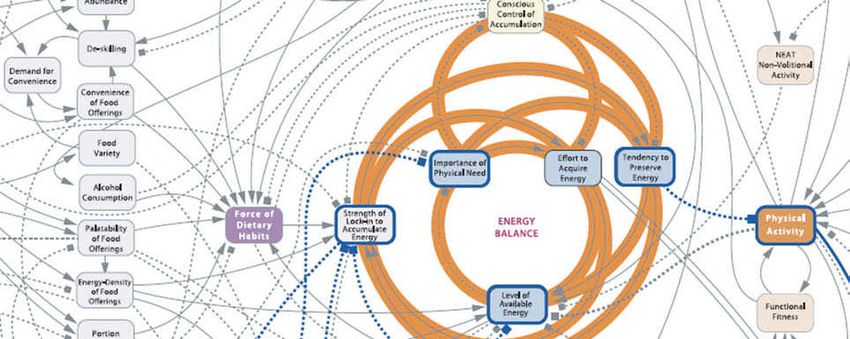
Knowl. Org. 42(2015)No.6                                                                                                                                 403
D. Soergel. Unleashing the Power of Data Through Organization: Structure and Connections for Meaning, Learning and Discovery

sist taggers to be more effective, thereby increasing ROI                           Knowledge organization systems (KOSs) are used in these
(return on investment) on the enormous investment, and                              applications, but in many cases these KOSs could be im-
KO is needed to assist searchers in navigating the unor-                            proved, using the expertise present in the KO community.
dered mess of tags). This is all very useful, but the scope
is too narrow. For the future we need to focus also on                              2.0 Advanced applications of
structuring and representing the actual data or knowledge                               knowledge organization
itself, issues we have left to the ontology, artificial intelli-
gence, and data modeling communities. These are the is-                             Key idea: data interoperability-systems must be able to
sues addressed in this paper.                                                       use data from another system, and data from several
    There is a wide range of KO applications and con-                               sources must be mergeable and linkable. Organizing
comitant opportunities for KO professionals:                                        knowledge well is key.

1. Knowledge bases for question answering and cognitive                             2.1 Knowledge bases for question answering and cognitive computing
   computing.
2. Linked data.                                                                     Powered by its knowledge graph, Google now gives not
3. Information systems in the enterprise.                                           just Web pages where answers can be found, but answers,
4. Interoperability of data across operational information                          biographical synopses for people, or basic data on cities.
   systems. The example of patient data (Electronic                                 The push by information companies goes beyond giving
   Health Records, EHR).                                                            just sources to providing answers, the semantic web, and
5. Big data and data analytics. Data interoperability and re-                       the quest for practical applications of artificial intelli-
   use.                                                                             gence have spurred the development of many knowledge
6. Knowledge bases for information extraction from text                             bases (Figure 1). They all use knowledge organization sys-
   and multimedia.                                                                  tems, and all their KOSs could be improved in their
7. Influence diagrams (causal maps), system dynamics                                structure, made more interoperable, and presented better
   models, process diagrams, concept maps, and other                                to support searchers in exploring the conceptual space
   node-link diagrams.                                                              and formulating queries.
8. Knowledge organization for understanding and learn-                                 CYC's very large ontology includes entity and relation-
   ing.                                                                             ship types and entity values, for example:
9. Knowledge transfer between domains.

              Knowledge base                                              URL                                            Some KOSs used

 CYC                                              http://www.cyc.com/                                        CYC Ontology, including entity types, re-
 Common sense knowledge                           http://sw.opencyc.org/                                     lationship types, and entity values

 IBM Watson                                       http://www.ibm.com/smarterplanet/us/e                      an extensible inventory of relationship
 Custom KBs for applications                      n/ibmwatson/                                               types

 Google Knowledge Graph                           http://googleblog.blogspot.com/2012/05                     schema.org for entity types and relation-
 Huge database of varied kinds of data            /introducing-knowledge-graph-things-                       ship types
 (Starr 2014)                                     not.html

 dbpedia                                          http://wiki.dbpedia.org/                                   DBpedia Ontology (E-R schema)
 Large database of statements extracted           http://mappings.dbpedia.org/index.php/                     Authority lists for individual entity values
 from Wikipedia                                   Exploring_the_Ontology                                     (instances), each identified by a URI.

 GDELT                                            http://gdeltproject.org/                                   CAMEO Coding Scheme for events
 Sentiment data,                                                                                             2,300 emotions and themes)
 Event reports                                                                                               World Bank Group Topic Taxonomy

 Many interoperable data sets on gene                                                                        The Gene Ontology (GO)
 products                                                                                                    www.geneontology.org/index.shtml

                                                   Figure 1. Some universal knowledge bases.

                                                        https://doi.org/10.5771/0943-7444-2015-6-401
                                                 Generiert durch IP '46.4.80.155', am 03.06.2021, 10:58:31.
                                          Das Erstellen und Weitergeben von Kopien dieses PDFs ist nicht zulässig.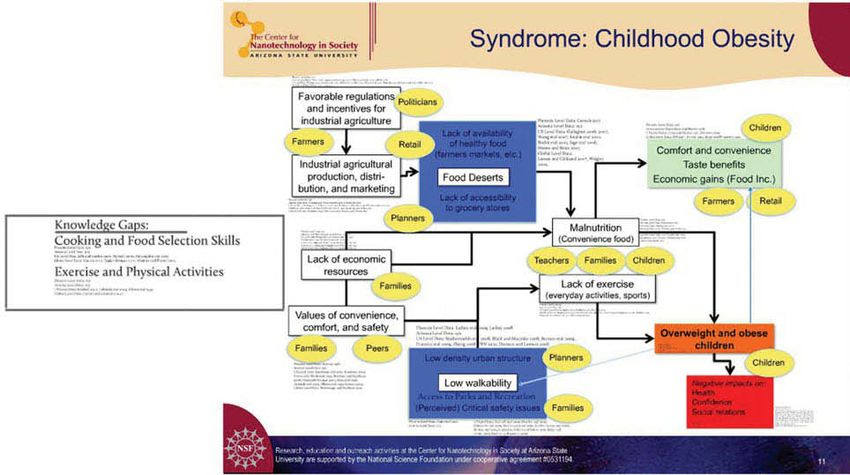
404                                                                                                      Knowl. Org. 42(2015)No.6
      D. Soergel. Unleashing the Power of Data Through Organization: Structure and Connections for Meaning, Learning and Discovery

– social being: A specialization of intelligent agent. Each                      complex searches with more complete answers. Linked
  instance of social being is an intelligent agent whose                         data are a key implementation component of the seman-
  status as an agent is acknowledged within some social                          tic web. Many KOSs are now available as linked data,
  system and who is capable of playing certain social                            promoting their use.
  roles within that system.                                                         A linked data set consists of very simple propositions,
– controlling: (controls AGENT THING) means that                                 such as
  AGENT has effective control over THING.
                                                                                     Acyclovir  VirusInfection
CYC was created mainly by people from the ontology
community; its organization could profit from people                             a simple sentence consisting of a verb (a relationship, also
from the KO community.                                                           called property) connecting two nouns (entities). These
   IBM's Watson is a platform for developing custom                              propositions are called (RDF) triples. RDF is an E-R
knowledge bases for cognitive computing. It was demon-                           model restricted to two-way relationships (with work-
strated and made known when it competed successfully in                          arounds for representing multi-way relationships). This
the trivia game Jeopardy using a large KB assembled                              simplicity is at once the reason for the success and the
through a combination of methods, including information                          bane of linked data (see Section 3.1). Linked data (from
extraction (Section 2.6). (See Ferucci 2012 and the other                        one or more data sets) can be searched with the query lan-
papers in the same journal issue.)                                               guage SPARQL. For a more general look at the underlying
   DBpedia has a plethora of data, some from the format-                         data model and a vision of expanded search possibilities
ted Wikipedia infoboxes, some from information extrac-                           see Soergel (2011).
tion; DBpedia is available and searchable as linked data. It                         To reach their full potential, linked data need standardi-
uses its own ontology, an E-R schema with a proliferation                        zation through properly structured and often very large
of entity types (classes) and relationship types. Entity types                   KOSs, presenting an enormous opportunity for KO. Ide-
include “place,” “species,” “person,” “organization,”                            ally, all linked data sets would use the same universal exten-
“work,” and “topical concepts,” each with many subdivi-                          sible E-R schema and universal authority lists:
sions. For each entity type, DBpedia has many instances
(entity values) (e.g., ~250,000 individual organizations.                        1. Use the same universal extensible entity-relationship
DBpedia is one source of the Google knowledge graph.                                schema. Some partial schemas (vocabularies) are widely
   GDELT (global database of events, language, and tone)                            used, such as “foaf ” (Brickley and Miller nd) and
is a huge repository of formatted data extracted from                               “vcard” for data on people; the W3C Organization Ontol-
newspapers across the world. It includes for each news                              ogy (WW3C 2014); the Dublin Core, BIBO, and FaBiO for
item data about sentiments expressed and multiple event                             bibliographic data (Peroni 2014); SKOS (simple knowl-
reports, a summary of data about an event as reported in                            edge organization systems) (W3C 2009, DuCharme
this news item. It would be nice to have data on the same                           2011). But despite re-use of schema pieces and faint at-
event integrated. GDELT uses GNIS and GNS, geo-                                     tempts at integration, such as schema.org, there is a wil-
graphic place authorities produced by the US Geological                             derness (see Figure 2).
Survey and the US National Geospatial-Intelligence                               2. Use universal authority lists for “places,” “chemical sub-
Agency, respectively; the GDELT list of emotions pooled                             stances,” “species,” “persons,” “organizations,” “works,”
from 24 sentiment analysis packages is a great candidate                            “topical concepts,” etc. that give entity values as URIs
for semantic unification (Section 3.4.2).                                           to be used consistently across the Web. Thus triples on
   The Gene Ontology is a classification of “cells and cell                         the same entity value from different linked data sets can
parts,” “molecular functions,” and “biological processes”                           be easily combined. Multiple linked data sets can be
widely used to record data on gene products found in bio-                           traversed as one big graph. Such large authority lists
logical research so that many data sets are interoperable. It                       must be created and agreed on (See Section 3.4).
would benefit from facet analysis.
                                                                                 Many linked data sets do not document what entity types
2.2 Linked data                                                                  and relationship types and what, if any, authorities for en-
                                                                                 tity values they use There is much room for improvement
Linked data form a knowledge base for question answer-                           For more information on linked data and their uses, see
ing and cognitive computing in a (so far) limited format.                        Alexander et al. (2009), Davies and Edwards (2012), Jin-
The vision of linked data is that many data sets will be                         gyuan et al. (2014), Sören et al. (2013), and Baierer et al.
posted openly accessible on the Web so they can be                               (2014).
searched together, linking across data sets, enabling more

                                                     https://doi.org/10.5771/0943-7444-2015-6-401
                                              Generiert durch IP '46.4.80.155', am 03.06.2021, 10:58:31.
                                       Das Erstellen und Weitergeben von Kopien dieses PDFs ist nicht zulässig.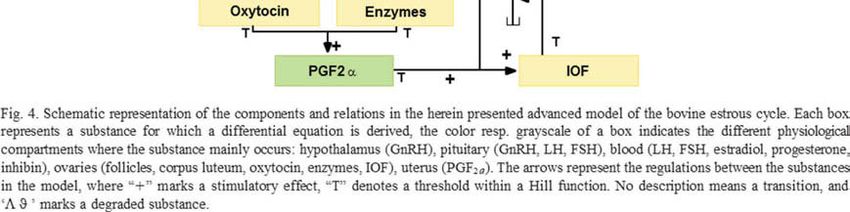
Knowl. Org. 42(2015)No.6                                                                                                                            405
D. Soergel. Unleashing the Power of Data Through Organization: Structure and Connections for Meaning, Learning and Discovery

               www4.wiwiss.fu-berlin.de/dailymed                                                  www4.wiwiss.fu-berlin.de/drugbank

 Drug                                Text                                DBDrug                                       Text
 Drug                      Drug                                DBDrug                                Text
                                                                                  DBDrug                          URI
 Drug       ChemicalSubstance
 Drug           Text                                DBDrug                            Text
                                                                                  DBDrug                          Text
                                                                                  DBDrug                             Text
                                                                                  DBDrug                            Pct

 Drug                     Text                                DBDrug                            Text
                                                                                  DBDrug                      Disease

 Drug         Text                                DBDrug                     Document

 Drug                        RouteOfAdministration               DBDrug                                 DosageForm

 Figure 2. Different relationship types used in two databases about drugs. Some relationship types correspond and are named the same,
 some correspond but are named differently, and others do not correspond at all.

2.3 Information systems in the enterprise                                                Each of these databases uses its own list of organiza-
                                                                                      tions and organization identifiers. It has been proposed
2.3.1 Enterprise data registry through an enterprise ontology                         to build instead a central “WBG Organization Authority
        (E-R data schema)                                                             Database” (OAD) as follows:
Many companies, government agencies, and other enter-
prises lack a registry of all their data systems and data                             1. Import organization information from all WBG sources
files, the individual data items in those files, and the stan-                           and from external sources (such as DBpedia; Library of
dards used for entity types, relationship types, and entity                              Congress Name Authority, corporate headings; Dun &
values. This makes it nigh impossible to avoid duplica-                                  Bradstreet). Merge information on the same organiza-
tion, to find data, and to combine data from multiple                                    tion from several sources using automatic mapping
sources to solve a problem. Chief information officers                                   based on organization name with manual edit. Give
work on addressing this problem. In the database world,                                  each organization a URI, using what exists if possible.
the idea of a data dictionary was developed to solve it.                                 Maintain the source of each piece of data.
Today the best approach uses two steps:                                               2. Determine for each organization a preferred and al-
                                                                                         ternate names in multiple languages.
1. Develop a comprehensive ontology (an E-R concep-                                   3. Link organization URIs to identifiers used in WBG
   tual data schema, a data model) for the entire enter-                                 systems and to Dun & Bradstreet ID (which is used in
   prise, re-using pieces or at least re-using ideas, from                               WBG systems and heavily in external systems). This
   standard schemas, such as foaf, SKOS, and the W3C                                     enables linking all organization data in WBG and ex-
   Organization Ontology Recommendation. This                                            ternal systems, such as DBpedia.
   schema will be quite large to present a view of all the
   data the enterprise keeps in minute detail.                                        Figure 4 shows a few sample relationship types from the
2. Use the schema to organize a registry of data systems                              E-R schema or ontology envisioned for OAD, to be con-
   and the types of information each includes.                                        structed drawing on widely used schemes. This schema
                                                                                      deliberately eschews constraints imposed by predominant
Both the ontology and the registry must be continuously                               practice to better represent reality (see Section 3.1).
updated.
                                                                                      2.4 Interoperability of data across operational information
2.3.2 KOS support for merging and linking data in the enterprise                          systems. The example of patient data (electronic health
                                                                                          records, EHR)
The World Bank Group (WBG) has a number of data-
bases that include connections to organizations in their                              Interoperability of data is the ability to use data produced
data, as shown in Figure 3.                                                           by one system in another system (for example, using pa-

                                                          https://doi.org/10.5771/0943-7444-2015-6-401
                                                   Generiert durch IP '46.4.80.155', am 03.06.2021, 10:58:31.
                                            Das Erstellen und Weitergeben von Kopien dieses PDFs ist nicht zulässig.
406                                                                                                      Knowl. Org. 42(2015)No.6
      D. Soergel. Unleashing the Power of Data Through Organization: Structure and Connections for Meaning, Learning and Discovery

                           Figure 3. A central organization authority database (Soergel and Popescu 2015).

tient data produced by one hospital by another hospital in                      health care provider to another. Example: You require
the treatment of the patient) or the ability to integrate or                    emergency treatment while traveling. The hospital cannot
combine two data sets to use in a third system, for exam-                       easily interpret the EHR from your hometown hospital;
ple (Fridsma 2013), to integrate patient data from several                      the physician misses a condition you have and treats you
hospitals into one large data set for medical research. In-                     with a commonly prescribed drug that has only one
teroperability of data is a pervasive problem. The solu-                        drawback: for people with your condition it is fatal. Lack
tion depends crucially on KO.                                                   of interoperability can kill.
   EHR interoperability (Ceusters et al. 2009; Moreno-
Conde et al. 2015, Smith et al. nd) is a huge problem in                        2.5 Big data and data analytics. Data interoperability and reuse
health care and biomedical research. An EHR uses many
KOSs, for example:                                                              Big data means managing very large and often varied data
                                                                                sets mostly for use in data analytics. Data analytic refers
– race/ethnicity, age, sex                                                      to sophisticated analysis 1) to find patterns that can be
– bodily or mental functions or conditions (measured                            detected only in large data sets, or 2) to find cases similar
  through patient perception, observation, or a measur-                         to a given rare situation (a patient with a rare genetic make-
  ing device or test and possibly used in diagnosis)                            up, a student with unusual characteristics, an unusual
– diseases                                                                      business problem) to discover what worked in these
– medical procedures                                                            known cases to solve a problem.
– drugs                                                                            There are three characteristics that contribute to mak-
                                                                                ing data “big:”
Using different (sometimes proprietary) KOSs creates
problems when EHR data are transferred from one

                                                    https://doi.org/10.5771/0943-7444-2015-6-401
                                             Generiert durch IP '46.4.80.155', am 03.06.2021, 10:58:31.
                                      Das Erstellen und Weitergeben von Kopien dieses PDFs ist nicht zulässig.
Knowl. Org. 42(2015)No.6 407
D. Soergel. Unleashing the Power of Data Through Organization: Structure and Connections for Meaning, Learning and Discovery
Entity (ID, System, TimeSpan)
Entity (Entity, TimeSpan)
Organization (Organization, TimeSpan)
Organization (Organization, TimeSpan)
LegalEntity (Location, Work/Home, TimeSpan)
LegalEntity (PhoneNumber, Voice/Fax, Home/Work, Land/Mobile, TimeSpan)
Organization (Text, Language, NameStatus. TimeSpan)
Organization (LegalEntity, TimeSpan)
Organization (Person, InOrganizationRole, TimeSpan)
Entity (Entity, TimeSpan)
LegalEntity (Entity, TimeSpan)
Event (LegalEntity, EventRole, TimeSpan)
Some observations on the schema: “LegalEntity” includes Person and Organization; this is often called Agent, but agent implies a role.
LegalEntity is a Thing that is capable of playing the agent role. The relationship type allows for storing any
kind of phone number, rather than defining a separate relationship type for each kind. The TimeSpan argument is included for every
relationship type for clarity. This could also be stated as a general rule.
Figure 4. Example elements of an organization data base ontology.
– large size of a data set hundreds of megabytes, tera- 2.6 Knowledge base to support information extraction
bytes, petabytes; from text and multimedia
– variety-data of different kinds (for example, from
medical records, from social work records, from Where do all the data in the knowledge bases discussed in
school records; the previous sections, especially Section 2.5 on big data,
– velocity-speed and size of updates. come from? Some come from instrument data collection.
Some come from large structured databases, such as the
The big data and data analytics “movement” arose due to Library of Congress Subject Headings or a drug database or a
two main developments: patient database. Some come from crowdsourcing. An
ever-growing volume (Maybury 2012) comes from auto-
– There are many data sets that can be shared. Many matic information extraction from multimedia: text, im-
funders require sharing raw research data. Hospitals ages, video, and voice recordings. Information extraction is
increasingly share de-identified or anonymized patient already used heavily and its use will only increase. Informa-
data. Linked data is all about sharing data. Instru- tion extraction both uses and feeds knowledge bases for
ments, including wearable gadgets (Washington Post question answering. Information extraction has two com-
2015) produce an avalanche of data that under the ponents:
right arrangements can be shared.
– Increased capabilities of computer systems. Advances 1. Entity extraction (named-entity recognition)—Locating
in both hardware and software allow storing and proc- references to named entities (people, organizations,
essing very large amounts of data, perhaps “in the places) and to concepts in text, graphs, images, audio
cloud.” Advances in algorithms for data analysis, logi- (e.g., locating people through face recognition or voice
cal inference over large sets of propositions, and ma- signature). Large KOS with many entity values, such as
chine learning, coupled with the availability of large geographic places, many variant names (in multiple lan-
knowledge bases, support a combination of statistical guages), and information useful for disambiguation are
and knowledge-based processing. important for this component.
2. Relationship extraction—Identifying relationships that
Most big data endeavors depend on data interoperability link entities into propositions, statements that are made
and reuse. See Section 3.5 on merging like data sets to in- in or derivable from the text and multimedia content.
crease sample size and linking data sets that have data on
different variables. Information extraction uses any combination of statisti-
cal methods, including machine learning, and syntactic /
structural /semantic analysis. Either way, it needs a lot of
information, much of it organized in KOSs.
https://doi.org/10.5771/0943-7444-2015-6-401
Generiert durch IP '46.4.80.155', am 03.06.2021, 10:58:31.
Das Erstellen und Weitergeben von Kopien dieses PDFs ist nicht zulässig.408 Knowl. Org. 42(2015)No.6
D. Soergel. Unleashing the Power of Data Through Organization: Structure and Connections for Meaning, Learning and Discovery
– Linguistic knowledge (morphological, part-of-speech, taken a front seat in information extraction. But KO also
and lexical), including knowledge about lexicalized has a place; fast computers and large knowledge bases
phrases, knowledge of synonyms / variant names or enable complex reasoning and inference.
labels for the same entity, and knowledge of the mul- High-quality information extraction in complex do-
tiple senses of words and how to determine which mains, such as medicine, profits from a complete knowl-
sense (which entity value) applies in the context (word edge base. In turn, information extraction augments the
sense disambiguation, WSD). knowledge, making it even more useful for subsequent
– Hierarchical and other relationships among concepts information extraction. Information extraction can be
and knowledge about the entity type to which a con- used for the construction of KOS; see, for example, Aus-
cept belongs. senac and Soergel (2005). Even linguistic information can
– World knowledge. For example, a large database about be learned from text and multimedia; Sonnenberger
people, their basic demographic data, their organiza- (1995), Winiwarter (2011).
tional affiliations, roles, subject interests, etc., helps in
correctly identifying a person mentioned in a text 2.7 Causal maps (influence diagrams), system dynamics models,
when the name could refer to any of many different process diagrams, concept maps, and other node-link diagrams.
persons. Such knowledge can be found in knowledge Models and simulations
bases (Section 2.1), including searching linked data
(Section 2.2) or in the Web at large, using the docu- A causal map is a node-link diagram that includes nodes
ments found for question answering or information for all the variables that directly or indirectly influence a
extraction on the fly. phenomenon of interest and links to show the influence
of one variable on another. Causal maps are very useful
A particularly thorny problem in information extraction to represent synthesized information for quick assimila-
is word sense disambiguation (WSD), not just for words tion, for playing out what-if scenarios, and ultimately for
and phrases referring to concepts but also to names of guiding research and policy (Roberts 2013) and evidence-
places and of people. Place names in particular are highly based decisions. Follow some of the links in Figures 5-7.
ambiguous; Paris can refer to any of 30 places, to people, System dynamics modeling is a closely related area; see,
and to other things. WSD can use semantic knowledge for example, Borshchev and Filippov (2004).
available in KOSs, world knowledge, and statistical asso- Causal maps are closely intertwined with KOSs. They
ciation between words or phrases in text (which may re- present variables, often arranged in groups to form a hi-
flect semantic information or contiguity in the world). erarchy. The complete shiftN map (Figure 7 shows a
For an example, consider the meaning of the word “whi- piece) contains 102 variables arranged in 8 groups (Figure
te.” When “white” modifies a noun that refers to a per- 8). Arranging these variables in meaningful order as done
son, it means race/ethnicity (unless the person is fright- in Figure 8 is a KO issue. Causal maps also need a sche-
ened or about to faint); when “white” modifies any other ma of relationship types to distinguish different types of
noun, it usually refers to color. Even this rule is not suffi- influences; these are not always made explicit.
cient to disambiguate “white dishwasher,” since “dish- Comparing and perhaps integrating (Graudina et al.
washer” could refer to a person or a machine, so the 2012; Hao et al. 2007 and Marshall et al. 2006) several
sense of “dishwasher” in the given context needs to be causal maps on the same topic may lead to new insights.
determined first. For a more complex example, consider For this we need to ascertain which relationship types
the meaning of the phrase “white drinking fountain.” In (link types) and which of the variables connected are the
the context of a tourist guide to Rome, Italy, “white drin- same or can be mapped, a classic case of KOS mapping
king fountain” refers to a fountain whose color is white. (see Section 3.4; Figure 9 shows a manually produced
In the context of talking about a segregated society, mapping of four lists of variables). Then we can deter-
“white drinking fountain” means a drinking fountain re- mine which individual link instances are the same and
served for white people; it tells nothing about the color which are different and produce a pooled map that in-
of the fountain. It would be very hard for a computer sy- cludes all variables and all influence links from the maps
stem to interpret this phrase correctly; it would interpret being merged (horizontal integration). We can see which
“white” as the color. Even a human reader who does not influence relationships occur in multiple maps and which
know about segregated fountains may get it wrong. (See only in one.
Kaye and Aung 2013 for a brief survey of WSD.) It is also often useful to integrate two or more causal
With the large and increasing amount of digital text maps dealing with different phenomena into one more
and multimedia documents, especially audio, and the in- comprehensive map that shows a wider range of influ-
creasing speed of computers, statistical methods have ences (vertical integration). This requires that one can
https://doi.org/10.5771/0943-7444-2015-6-401
Generiert durch IP '46.4.80.155', am 03.06.2021, 10:58:31.
Das Erstellen und Weitergeben von Kopien dieses PDFs ist nicht zulässig.Knowl. Org. 42(2015)No.6 409
D. Soergel. Unleashing the Power of Data Through Organization: Structure and Connections for Meaning, Learning and Discovery
Figure 5. An overview diagram of influences on obesity (Milstein and Homer 2009).
identify one or more connecting nodes, nodes that repre- Figures 10 and 11 show a different type of node-link
sent the same variable in both diagrams to be connected. diagram, diagrams of sequential and interrelated proc-
As an example, consider a causal map of healthy living and esses that lead to some outcome or state, which are im-
a causal map for environmental sustainability. There are at portant in biology and in industrial engineering. Biology
least two connecting points: 1) urban planning for walk- specifically uses diagrams (Le Novère et al. 2009, Sander
ability of the environment contributes both to healthy liv- et al. 2009, Chaouiyal et al. 2013) of signaling pathways,
ing and to lower energy use and lower pollution; and 2) the metabolic networks, and gene regulatory networks. For
proportion of plant-based food in the diet affects both standards in this area see COmputational Modeling in
health and resources for food production; more fruits, BIology NEtwork (COMBINE) (Le Novère et al. 2013).
vegetables, and grains is healthier, and plant-based foods Soergel (2004) describes MONOD, a prototype system
use fewer resources with a lower carbon footprint. So what that assists researchers with extracting data from the lit-
is good for your health is good for the environment, espe- erature and synthesizing them into a knowledge base, of
cially climate change. For research on these interactions, which a graph is one representation. Each data item is
see www.nsf.gov/news/ “food, energy, and water.” linked its source(s), so the graph can serve as a search in-
Causal maps are a form of representing KOSs. Con- terface, as suggested above.
sider a system that lets the user explore a topic in a well- A more generic form of node-link diagrams, concept
presented dynamic causal map, highlight one or more va- maps, have been used as thesaurus displays since 1950
riables and/or one or more links, and receive documents (Soergel 1974, Section D3.2, 249, and the references
discussing these variables and links. The system might al- given there, including the EURATOM Thesaurus) and
so let the user type in a term for a concept or a link and have resurfaced forcefully in education (see Section 2.8).
see this concept in the context of a causal map. It would be interesting to find earlier uses.
https://doi.org/10.5771/0943-7444-2015-6-401
Generiert durch IP '46.4.80.155', am 03.06.2021, 10:58:31.
Das Erstellen und Weitergeben von Kopien dieses PDFs ist nicht zulässig.410 Knowl. Org. 42(2015)No.6
D. Soergel. Unleashing the Power of Data Through Organization: Structure and Connections for Meaning, Learning and Discovery
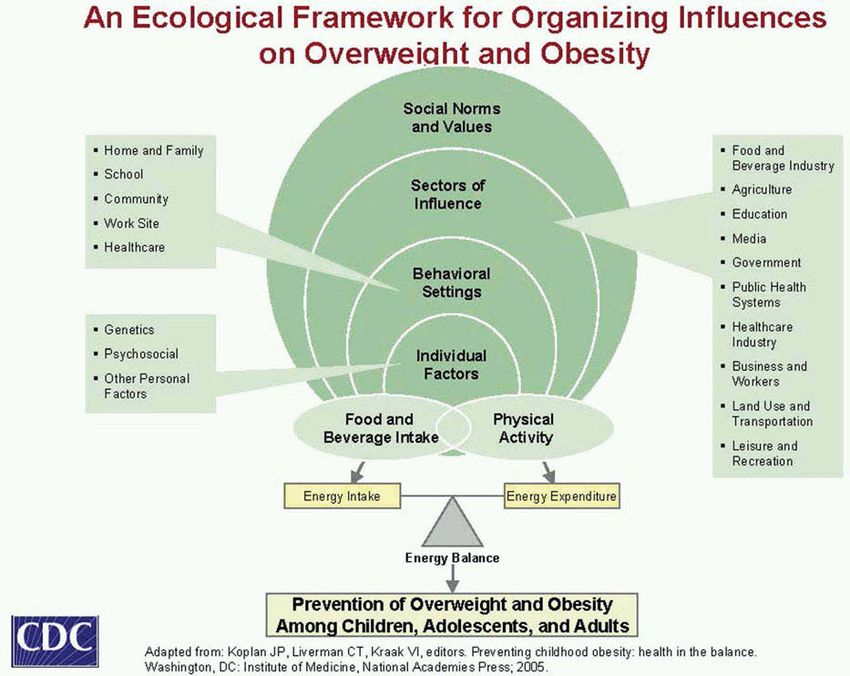
Figure 6. Segment of the large and detailed shiftN causal map for obesity
https://www.gov.uk/government/uploads/system/uploads/attachment_data/file/296290/obesity-map-full-hi-res.pdf
(Vandenbroeck et al., Building the obesity system map 2007; Vandenbroeck et al., Obesity system atlas 2007).
2.8 Knowledge organization for understanding and learning help from KO in creating meaningful presentations and
(for more see Soergel 2013 [2015]) in helping students to learn principles for their own
knowledge organization as an essential part of thinking
“[M]eaningful or deep learning can be supported skills-an important role for KO professionals. It requires
through giving learners deep engagement with the subject matter and sufficient
– well-structured presentation of material, knowledge of cognitive psychology to understand how
– schemas they can use to organize knowledge spe- information must be presented and learning activities
cific topics in their minds, must be structured to assist different types of learners in
– general knowledge organization principles they can discerning meaning and making sense. Figures 12-16 (So-
use to construct their own schemas.” (Soergel 2013 ergel 2013 [2015]) give examples. Figures 15 and 16 em-
[2015], modified; Zhang and Soergel 2014). phasize meaningful arrangement.
Causal maps, influence diagrams, system dynamics
This theme is relevant not just for K-20 education and models, and similar representations of complex relation-
professional training, but well beyond that for any infor- ships (Section 2.7) can help students understand complex
mation transfer and interaction with information of any systems. On the use of simulations 1) in business courses
kind (including search, information display, and games) in (Papenhausen and Parayitam 2015), and 2) in helping stu-
any format (print, online, live). dents understand complex science systems (Nuhoğlu
The need for knowledge organization to support com- 2010 and Eseryel and Law 2012).
prehension is well recognized in education, including in-
structional design, and information architecture, but im- 2.9 Knowledge transfer between domains
plementation in the design of learning materials and
other informative documents leaves much to be desired. Subject domains or disciplines often share substantive or
The KO community has paid only scant attention to the formal structures that, if recognized explicitly, can facili-
use of KO in learning; that must change. Educators, in- tate knowledge transfer between domains. A KO special-
structional designers, and user interface designers need ist working on a KOS spanning multiple domains is in a
https://doi.org/10.5771/0943-7444-2015-6-401
Generiert durch IP '46.4.80.155', am 03.06.2021, 10:58:31.
Das Erstellen und Weitergeben von Kopien dieses PDFs ist nicht zulässig.Knowl. Org. 42(2015)No.6 411
D. Soergel. Unleashing the Power of Data Through Organization: Structure and Connections for Meaning, Learning and Discovery
Figure 7. Childhood obesity causal map (Foley 2012; Wiek et al. 2012).
good position to discern such commonalities. For example, There are a number of examples of technologies that
“management styles and educational styles” align to a large have been inspired by observations of structures and
extent, so they can be unified under a heading “style of so- mechanisms in living organisms. Such transfer might be
cial interaction” (Figure 17). Any of the alignments are po- further facilitated by developing a KOS of system struc-
tential places for knowledge transfer, but non-alignments (a ture and functions that captures commonalities between
blank in one of the original columns) are especially prom- the structure and function of mechanical and electronic
ising. “Montessori-style” education helps children to be- devices on the one hand and the anatomy and physiology
come self-reliant and to behave properly in society based of living organisms on the other. Breton (1991) argued for
on their own volition, their own internalized norms and indexing documents to support transfer. These are all ex-
values. There is little or no reliance on teacher supervision amples of flexible unification as discussed in Section 3.4.
or external rewards such as handing out stars for good be-
havior. What would a “Montessori-style organization” look 3.0 Improving KO tools and techniques to meet
like? It would hire people who are self-reliant and have in- the requirements of advanced applications
ner discipline and motivation, with much less need for su-
pervision and extrinsic motivation, such as constant praise After discussing advanced applications of KO, we now
or money incentives. Conversely, what would “holacracy” turn to KO improvements that would benefit these appli-
in education look like? As a management style applied to cations.
schools, holacracy would give responsibility for how to
teach to the teachers. 3.1 Better data modeling
Holacracy in the classroom means giving students more
responsibility for their own learning. Rather than have the The entity-relationship (E-R) approach with its close rela-
teacher lecture, task a team of students with learning about tionship to predicate logic is arguably the most basic and
a topic, giving them materials and clear learning objectives. general approach to data modeling. However, its applica-
Or put students in charge of a course: Teams of students tion suffers from limitations; most serious the heavy pre-
prepare classes, with readings, presentations, and discus- ference for binary relationships, as in RDF triples and in
sion questions. Or students work on projects in independ- E-R diagrams. Second is the complication of data model-
ent teams, using holacracy ideas for making teamwork effi- ing by using “attributes.” Third is the unfortunate choice
cient. Unification of two classifications enables transfer of of calling relationship types properties, which just sows
ideas between education and management. confusion.
https://doi.org/10.5771/0943-7444-2015-6-401
Generiert durch IP '46.4.80.155', am 03.06.2021, 10:58:31.
Das Erstellen und Weitergeben von Kopien dieses PDFs ist nicht zulässig.412 Knowl. Org. 42(2015)No.6
D. Soergel. Unleashing the Power of Data Through Organization: Structure and Connections for Meaning, Learning and Discovery
Individual Environment
Engine
Energy balance
Conscious control of accumulation
Effort to acquire energy
Importance of physical need
Level of available energy
Strength of lock-in to accumulate energy
Tendency to preserve energy
Physiology
Degree of primary appetite control by brain
Extent of digestion and absorption
Genetic and/or epigenetic predisposition to obesity
Food consumption Food production
Force of dietary habits Societal pressure to consume
Tendency to graze Demand for health
Demand for convenience Pressure to improve access to food offerings
Food exposure Cost of ingredients
Individual physical activity Physical activity environment
Level of transport activity Dominance of motorised transport
Opportunity for unmotorised transport
Individual psychology Social psychology
Food literacy Exposure to food advertising
Stress Peer pressure
Figure 8. shiftN causal map variables. Top level with example detail (arranged by DS). Observe the two columns for individual factors
and environmental factors and the juxtaposition of related factors, such as food consumption and food production.
shiftN Figure 6 Kaplan Figure 5 Nano- Downey’ list
technology F .7
Engine
Energy balance Energy balance 1)
Energy intake1)
Energy expenditure1)
Conscious control of accumulation lack of self-control
Effort to acquire energy
Physiology
Degree of primary appetite control by brain hunger response to food
cues
Digestion and absorption
Genetic and/or epigenetic predisposition to obe- genetics
sity epigenetic factors
Figure 9a. Variable matches between four causal maps.
3.1.1 Limitation 1. Restricting the modeling space to binary quires multi-way relationships. The designers of frame-
(two-way) relationships based systems understood that. While it is possible to repre-
sent multi-way relationships as a structure consisting of
In much E-R diagraming and in RDF triples (the present several binary relationships and issue SPARQL queries that
RDF-based version of linked data), relationships are limited consider such structures, it is not a natural way of represen-
to binary relationships, connecting two entities. However, tation and therefore difficult and not widely used.
the world is not made up of triples. Reality and thought are
much more complex than that; adequate representation re-
https://doi.org/10.5771/0943-7444-2015-6-401
Generiert durch IP '46.4.80.155', am 03.06.2021, 10:58:31.
Das Erstellen und Weitergeben von Kopien dieses PDFs ist nicht zulässig.Knowl. Org. 42(2015)No.6 413
D. Soergel. Unleashing the Power of Data Through Organization: Structure and Connections for Meaning, Learning and Discovery
Food consumption Food and beverage intake Overeating
Force of dietary habits
Malnutrition (convenience high fructose corn syrup
foods)
Lack of econ. resources
Food production Food and beverage indus- Agricultural production agricultural policies
try
Demand for health
Food deserts food deserts
Cost of ingredients
Individual physical activity Physical activity Exercise and physical activities
Lack of exercise low level of phys. Activity
Level of transport activity
Physical activity environment Land use and transporta- transportation policies
tion
Opportunity for unmotorised Low walkability
transport
Safety of unmotorised transport Perceived safety issue perception of neighborhood
safety
Individual psychology Psychosocial
Food literacy Cooking and food selection lack of nutritional education
skills
Stress Stress
smoking cessation
Social psychology
Peer pressure
Behavioral settings
Figure 9b. Some (approximate) matches and non-matches between variables from four causal maps.
1) Note: The three basic variables “Energy balance,” “Energy intake,” and “Energy expenditure” are implied by all four models but ex-
plicitly mentioned only as shown. For still more variables in this domain, see French et al. (2012) and Food4Me Project (2015). Note
the many empty cells-even the most comprehensive of the four maps (Col. 1) is missing factors. Merging the four maps would pro-
duce a more complete causal map. Some of the matches are tenuous. Where Col. 1 has general variables, Col. 4 often has a specific
value (“lack of, low level of ”). Col. 1 captures, for example, the influence of control on food intake, which could be good or bad, while
Col. 4 looks only at factors that influence obesity, so it looks only at the influence of lack of control on food intake. Or Col. 3 listing
“malnutrition (convenience foods)” while Col. 4 gives just one example, “high fructose corn syrup.” To solve the match problem, re-
searchers and modelers in the area would need to agree on a common set of variables and methods to measure these variables.
The following two examples show that binary relation- Realistic: disease (drug, dosage, ef-
ships cannot adequately model real-life data as needed in fectiveness, age, gender, ethnicity)
the knowledge bases discussed in Section 2.1): Example 2. Impact of events
Faithfully recording information on any type of im-
Example 1. Drug treatment pact of an event requires he following complex rela-
Not adequate: disease drug tionship type:
Reality, and therefore the information needed by a Event (TargetType, ImpactType,
physician, is much more complex; it requires modeling ImpactSeverity, TimeSpan, CountNumber)
dependencies between several entity types (or vari- where
ables). Following the notation used in mathematics for TargetType could be a person, a building, or a crop,
multivariate functions, we can write: or …
https://doi.org/10.5771/0943-7444-2015-6-401
Generiert durch IP '46.4.80.155', am 03.06.2021, 10:58:31.
Das Erstellen und Weitergeben von Kopien dieses PDFs ist nicht zulässig.414 Knowl. Org. 42(2015)No.6
D. Soergel. Unleashing the Power of Data Through Organization: Structure and Connections for Meaning, Learning and Discovery
Figure 10. Cell metabolism diagram (retrieved from http://nutritionpaperideas.com/cell-metabolism-diagram/ 2015-05-10).
Figure 11. A process regulation diagram (Stötzel 2012).
https://doi.org/10.5771/0943-7444-2015-6-401
Generiert durch IP '46.4.80.155', am 03.06.2021, 10:58:31.
Das Erstellen und Weitergeben von Kopien dieses PDFs ist nicht zulässig.Knowl. Org. 42(2015)No.6 415
D. Soergel. Unleashing the Power of Data Through Organization: Structure and Connections for Meaning, Learning and Discovery
User topic 'Food in Auschwitz' for illustration
Segments of Holocaust survivor interviews relate to the topic in different ways:
Direct relevance: Direct evidence for what the user asks for
Example: A Holocaust survivor talks about food available to Auschwitz inmates.
Indirect relevance: From which one can infer something about the topic
Example: A Holocaust survivor talks about seeing emaciated people in Auschwitz
Context relevance: Provides background/context for topic
Example: A Holocaust survivor talks about physical labor of Auschwitz inmates
Comparison relevance: Provides information on a similar or contrasting situation
Example: A Holocaust survivor talks about food in the Warsaw ghetto
Hypothesis 2
Students who understand these relevance relationships prepare richer descriptions and analyses of historical events using more and
more types of information
Elaboration of the comparison relationship as applied to events
(1) Varying time or place of event
(1.1) Compare with similar event at a different time
(1.2) Compare with similar event at a different place
(2) Varying the participant(s) in the event
(2.1) Compare with similar event that has a different actor
(2.2) Compare with similar event that has a different person or object being acted upon
(3) Varying the act / experience
(3.1) Compare with a different act carried out by a similar actor
(3.2) Compare with a different experience experienced by a similar person or object
Hypothesis
Students who understand the relevance relationships related to comparison can think of more events that can be compared with an
event in focus and prepare a richer report comparing and contrasting the event in focus with other events.
Figure 12. Relevance relationships that help people think (Huang and Soergel 2006).
ImpactType could be wounded, killed, damaged, complex. Independent variables may interact; there are
destroyed, … statistical methods to find such interactions. Such in-
ImpactSeverity would be given on a scale, say 1-5 teractions are represented by three-way or higher-
order relationships as C = f(A, B). Advanced modeling
Following are brief observations on how multi-way rela- and simulation techniques allow for representing such
tionships would benefit some of the other applications patterns of interaction through formulas. However, a
discussed in Section 2: node-link graph cannot represent such multi-way de-
pendencies (an observation that also applies to E-R
– “Linked data” (Section 2.2) needs to evolve beyond diagrams).
triples to be able to store more complex data from – “For learning” (Section 2.8), one needs to be able to
many sources in a way that enables integration of data express complex relationships that students or policy
from many sources in complex queries and reasoning. makers need to understand.
We should not let present, but transient, technological
limitations stand in the way of proper conceptual To sum up, the world is not made of triples. To be fully
modeling. useful, representations must be able to capture complex
– “In information extraction” (Section 2.6) there is work relationships to allow for more accurate knowledge bases
to move beyond extracting just binary relationships to for question answering and cognitive computing, for
extracting complex relationships. See, for example, more adequate representation of information extracted
McDonald et al. (2005) and, applied to events, Döhling from text, for more expressive causal models, etc. Soft-
and Leser 2014. ware for processing these representations―query, reason
– “Causal modeling” (Section 2.7) focuses on binary in- over, merge―must follow suit.
fluence relationships, especially if the models are pre-
sented graphically. However, influence is often more
https://doi.org/10.5771/0943-7444-2015-6-401
Generiert durch IP '46.4.80.155', am 03.06.2021, 10:58:31.
Das Erstellen und Weitergeben von Kopien dieses PDFs ist nicht zulässig.416 Knowl. Org. 42(2015)No.6
D. Soergel. Unleashing the Power of Data Through Organization: Structure and Connections for Meaning, Learning and Discovery
Entity types Relationship types
Schematic representation of the principal classes of the Anatomy
Taxonomy. (Rosse & Mejino, 2003, Fig. 4, p. 486)
(From Rosse & Mejino, 2003, Fig. 8)
Hypothesis
Students who are taught anatomy using the Foundational Model of Anatomy
have a better grasp of the structure of the body.
Figure 13. Foundational Model of Anatomy (an entity-relationship schema).
Hypotheses
The concept map representation will allow some learners to form a better internal representation of a bird as a system.
Constructing a concept map will lead most learners to a deeper understanding of a topic
Note: Students need to think about the entities and relationships involved and need to make these explicit to themselves. Students
need to first learn (at their level) about E-R modeling and concept map construction as mental tools.
Figure 14. Concept map about birds (from Cañas and Novak 2006/2008).
3.1.2 Limitation 2. Attributes as elements in entity-relationship person date or
(E-R) modeling person (date, DateRelation-
shipType)
The proposal for E-R modeling presented by Peter Chen with DateRelationshipType = BirthDate
(1976), drawing on previous work (Williams 2012), is ingen-
ious, except for introducing “attributes.” Attributes are not models this piece of data perfectly and has the advantage
needed as modeling elements. Using only entities and rela- of making explicit the entity type date. Also, developers
tionships is simpler and avoids many problems that arise tend to store a piece of information they call attribute
from distinguishing between relationships and attributes. differently from what they call a relationship, possibly
Consider “birthday,” which is often modeled as an at- creating problems for processing. One might argue that
tribute of person; but “date” is not a “primary” entity in its own right, but con-
https://doi.org/10.5771/0943-7444-2015-6-401
Generiert durch IP '46.4.80.155', am 03.06.2021, 10:58:31.
Das Erstellen und Weitergeben von Kopien dieses PDFs ist nicht zulässig.Knowl. Org. 42(2015)No.6 417
D. Soergel. Unleashing the Power of Data Through Organization: Structure and Connections for Meaning, Learning and Discovery
a. Britannica Elementary: b. Meaningful arrangement
Menu for Animal Kingdom Animal Kingdom
Invertebrates (animals without a spine)
Mollusks (snails, octopus, mussels)
Arthropods (bugs (insects), spiders, crabs)
Vertebrates (animals with a spine)
Fish
Amphibians frogs, toads, salamanders)
Diapsids (lizards&snakes, crocodiles, dinosaurs, birds)
Reptiles (lizards&snakes, crocodiles, dinosaurs)
Birds
Mammals (elephants, whales, cows, dogs, bats, mice,
monkeys)
Note: Would need to be made visually more attractive
for children.
c. Vertebrates cladogram (basis for b.)
http://users.rcn.com/jkimball.ma.ultranet/BiologyPages/V/Vertebrates.html
a Encyclopedia Britannica. Thoughtless arrangement, devoid of any meaning
b Meaningful arrangement. Based on the modern cladogram shown in c.,.
Hypothesis
Young students who use the animal home page with the meaningful arrangement will over time absorb the sequence and perceive a
progression. When much later in biology (perhaps in 10th grade) the structure of the animal kingdom and the evolution of animals are
discussed, these students will understand more quickly.
For use of science categories to design Web directories, see Bilal and Wang 2005
Figure 15. Classification of animals.
https://doi.org/10.5771/0943-7444-2015-6-401
Generiert durch IP '46.4.80.155', am 03.06.2021, 10:58:31.
Das Erstellen und Weitergeben von Kopien dieses PDFs ist nicht zulässig.You can also read