Update on COVID-19 in Canada: Epidemiology and Modelling - Canada.ca/coronavirus July 30th, 2021
←
→
Page content transcription
If your browser does not render page correctly, please read the page content below

Update on COVID-19 in
Canada: Epidemiology
and Modelling

July 30th, 2021

Canada.ca/coronavirus
Slight increase in COVID-19 cases nationally, following weeks of
  sustained national decline across disease activity and severity indicators
    Number of cases/                                                     On average over the past 7 days:                             Number of
    in hospital and ICU                                                   641 cases                                                      deaths
     10,000                                                               478 in hospital                                                  1,000
      9,000                                                               224 in ICU                                                         900
                                                                             7 deaths
      8,000                                                                                                                                  800
      7,000                                                                                                                                  700
      6,000                                                                                                                                  600
      5,000                                                                                                                                  500
      4,000                                                                                                                                  400
      3,000                                                                                                                                  300
      2,000                                                                                                                                  200
      1,000                                                                                                                                  100
           0                                                                                                                                 0
           Mar 20         May 20         Jul 20        Sep 20         Nov 20         Jan 21        Mar 21         May 21         Jul 21
                                         Cases             Hospitalizations              ICU            Deaths

Data in figure as of July 27, 2021
Note: Trend lines reflect 7-day moving averages. Total hospitalizations and ICU admissions include all people in hospital and in ICU on that day.   1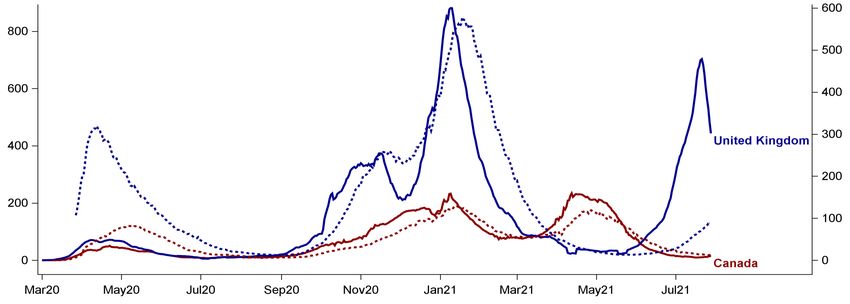
Regional COVID-19 trends show low levels of hospital occupancy with the
substantial reduction in disease activity since the peak of the 3rd wave
     Number cases/ in hospital per
     100,000 population
     50                     BC                        50                    AB                          50                     SK

     25                                               25                                                25

      0                                                0                                                 0
      Apr 20 Aug 20 Dec 20 Apr 21                      Apr 20 Aug 20 Dec 20 Apr 21                       Apr 20 Aug 20 Dec 20 Apr 21

                           MB                                               ON                                                 QC
     50                                              50                                                 50

     25                                              25                                                 25

      0                                                0                                                 0
      Apr 20 Aug 20 Dec 20 Apr 21                      Apr 20 Aug 20 Dec 20 Apr 21                       Apr 20 Aug 20 Dec 20 Apr 21

                                                           Cases              Hospitalizations
Data as of July 27, 2021
Note: Daily cases trend lines reflect 7-day moving averages. Total number in hospitals include all people in hospital on that day.     2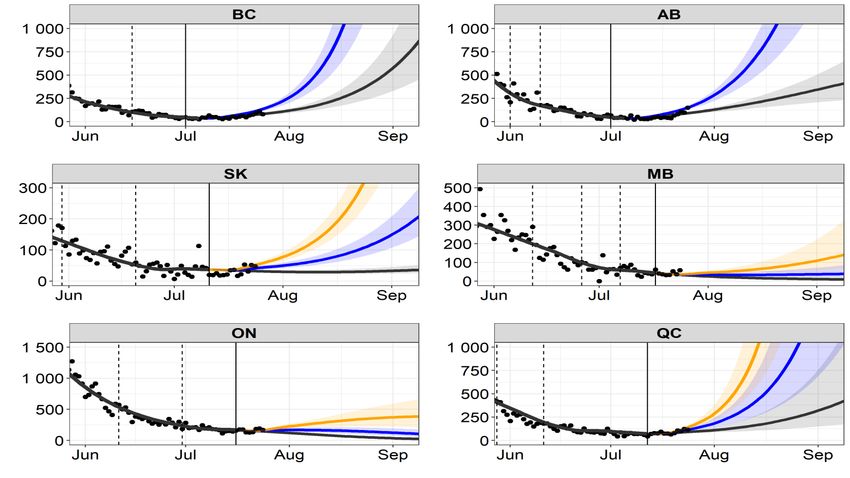
National Rt recently trending above 1, signalling early signs of epidemic
   growth in some areas
   2
                  When Rt is consistently >1,                                      The Rt has been >1
                  the epidemic is growing                                          nationally since July 18
 1.5

   1

 0.5
                                 When Rt is consistently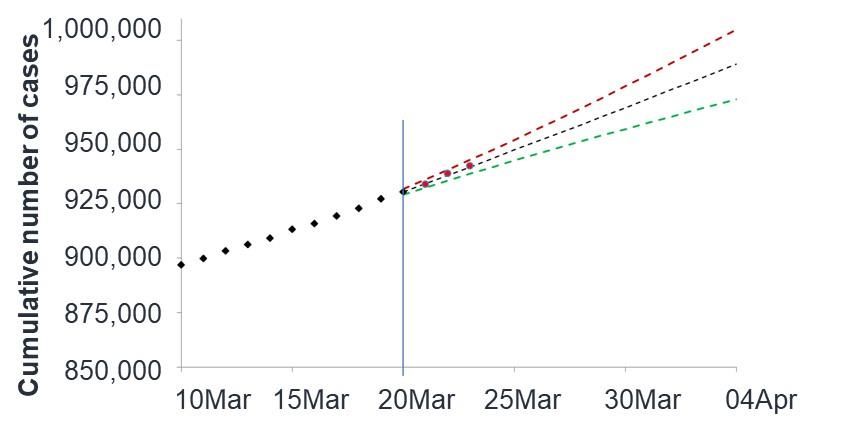
Predominance of the Delta variant underscores the need for high
vaccination coverage and continued caution as restrictions are eased

    ↑ transmissibility                            ↑ severity                   ↓ vaccine effectiveness

                                                                               •   Reduced effectiveness against
•   Most transmissible variant to date   •   Delta cases have increased risk
                                                                                   symptomatic infection after 1 dose;
                                             for hospitalization
                                                                                   small reduction after 2 doses
•   5-fold increase in proportion of
    Delta cases in June                  •   Expected increased impact on
                                                                               •   Substantial protection against
                                             healthcare utilization/capacity
                                                                                   hospitalization
•   Delta variant associated with            with Delta driven wave
    strong resurgence
                                                                               •   Majority of Delta cases in Canada in
                                                                                   unvaccinated or partially vaccinated
                                                                                   people

           2 vaccine doses needed for strong protection against variants of concern, including Delta

                                                                                                                          4
Over 81% of the eligible people, aged 12 years or older, have at least one
  dose of COVID-19 vaccines and over 66% are fully vaccinated
  Percentage of eligible people (≥ 12 years) with at least one dose and fully vaccinated by jurisdiction, as of July 29th, 2021

 NU                                                                                       66%             78%
 NT                                                                                                         80%      87%
 YK                                                                                                               84% 90%
 NL                                                                      53%                                        86%
 PE                                                                       54%                                         88%
 NS                                                                                        68%                     85%
 NB                                                                                      66%                    82%           100%
 QC                                                                                   63%                        83%
 ON                                                                                        68%                 81%
 MB                                                                                          70%                82%
 SK                                                                                  62%        73%
 AB                                                                                     65%        76%
 BC                                                                                     65%             82%
 CA                                                                                      66%           81%
      0%          10%           20%          30%          40%         50%         60%       70%                  80%    90%   100%
                                                     Fully vaccinated     At least one dose
Data as of July 29, 2021
Note: Data obtained from https://covid19tracker.ca/vaccinationtracker.html. Accessed on 29 July, 2021 (9:00PM EST)                   5
At least one dose and fully vaccinated coverage has increased stepwise
  as vaccination programs expanded to younger age groups

  Percentage of eligible people (≥ 12 years) with at least one dose and fully vaccinated by age group, as of July 24th, 2021

       80+                                                                                                   89% 95%
      70-79                                                                                                  89% 95%

      60-69                                                                                           81%     91%

      50-59                                                                                  70%       83%
                                                                                                                       100%
      40-49                                                                         63%              79%

      30-39                                                              54%                   73%

      18-29                                                     46%                       69%

      12-17                                           37%                                    71%

              0%        10%         20%         30%         40%        50%         60%         70%     80%     90%     100%
                                                  Fully vaccinated       At least one dose

Data as of July 24, 2021
Note: Data obtained from the Canadian COVID-19 Vaccination Coverage Surveillance System                                       6
Evidence shows COVID-19 vaccines are highly protective, with
Short-term forecast predicts increased rate of growth for cumulative
    cases but not for cumulative deaths
     Cumulative cases predicted to August 8, 2021:                                 Cumulative deaths predicted to August 8, 2021:
                1,432,555 to 1,441,610                                                           26,570 to 26,700
  1,445,000                                                                    26,800

  1,440,000
                                                                               26,700
  1,435,000
                                                                               26,600
  1,430,000
                                                                               26,500
  1,425,000

  1,420,000                                                                    26,400

  1,415,000                                                                    26,300
          14 Jul       19 Jul    24 Jul    29 Jul    03 Aug 08 Aug                  14 Jul      19 Jul   24 Jul   29 Jul   03 Aug   08 Aug
          Cumulatively reported cases in Canada by July 24         Cases added since July 24 when the prediction was made
          Prediction to August 8                  Lower 95% prediction limit             Upper 95% prediction limit
Data as of July 24, 2021
Note: Extrapolation based on recent trends using a forecasting model (with ranges of uncertainty).                                           8
The longer term forecast predicts stronger resurgence if community-wide
contact rates increase too quickly, highlighting the need for ongoing caution
If we increase the
number of people
we contact each
day by 25%
Reported
cases
If we maintain the
number of people
we contact each
day
2021
Data as of July 26, 2021
Note: Output from PHAC-McMaster model. Model considers impact of vaccination and increased transmissibility of VOCs (including Delta), 9
refer to annex for detailed assumptions on modelling.International experience with spread of Delta highlights the need to maintain precautions until fully vaccinated coverage is very high Cases per 1 million Hospitalizations per 1 million population (solid line) population (dotted line) Data as of July 27, 2021 Note: 7-day moving average. Data for figure obtained from Our World in Data. 10
Increasing vaccine uptake among young adults, aged 18 to 39 years, could
reduce the impact of a serious resurgence this fall/winter
UPDATED FORECAST WITH DELTA AND
UPDATED FORECAST WITH DELTA
INCREASED UPTAKE AMONG AGES 18-39
OUTCOME: OUTCOME:
! hospital capacity
may be exceeded hospital capacity
not exceeded
Hospital capacity Measures lifted Median hospitalized cases Vaccination period
The Delta variant is assumed to be 1.5x more transmissible and 2x more virulent than Alpha.
Note: For all scenarios, a two-step approach to lifting public health measures is modelled. Vaccine acceptance varies by age group and is informed by a
combination of Canadian survey data and actual rates of vaccine uptake by age groups (as of July 8, 2021). In the scenario on the left, vaccine acceptance among
those aged 18-39 years is 72%. In the scenario on the right, vaccine acceptance among those aged 18-39 years is 80%. Refer to annex for detailed assumptions 11
on modelling.Every vaccination counts for better protection, better connection!
33.2 Million Canadians,
aged 12 years or older,
• Canada has made great progress on increasing vaccine coverage are eligible for COVID-19 Vaccines
over the past month, but we need more eligible people vaccinated with
first and second doses.
• This Call For Arms is to shoot for the stars in vaccination coverage! of eligible people
- with just over 5 weeks until Labour Day in Canada, this time is crucial fully vaccinated
for building up protection before we gather indoors this fall!
• This means increasing fully vaccinated coverage above 80% across
all age groups.
• Uptake among younger age groups can have a big impact! >5.0 Million eligible Canadians
with just one dose
~6.3 Million eligible Canadians
not yet vaccinated
CC images Adapted from : https://www.flickr.com/photos/isbg6/5029147286; https://www.pngkit.com/bigpic/u2w7u2u2o0u2i1r5/
12ANNEX
13Longer range forecasts predict stronger resurgence in multiple jurisdictions if
contact rates increase too quickly with re-opening
If we increase the
number of people we
contact each day by
50%
If we increase the
number of people
Reported we contact each
cases day by 25%
If we maintain the
number of people we
contact each day
For most provinces (except BC and AB which have already opened widely) there is uncertainty in the forecasts because it is
not yet clear how much recent and future re-opening will impact contact rates. For these provinces an additional forecast, with
the effect of reopening resulting in a 50% increase in contacts, is also shown by the orange line.
Data as of July 26, 2021
Note: Output from PHAC-McMaster model. Model considers impact of vaccination and increased transmissibility of VOCs (including Delta), 14
refer to annex for detailed assumptions on modelling.Previous longer-range modelling forecast from June 25 shows that
sustained control measures supported the rapid decline of the epidemic
as vaccines rolled out
If we increase the
number of people we
contact each day by
50%
If we increase the
number of people
Reported we contact each
cases day by 25%
If we maintain the
current number of
people we contact
each day
Red points – Surveillance
data after the forecast from
2020 2021 June 21 to July 26
Model data as of June 21, 2021. Surveillance data as of July 26, 2021.
Note: Output from PHAC-McMaster model. Model considers impact of vaccination and increased transmissibility of VOCs (including 15
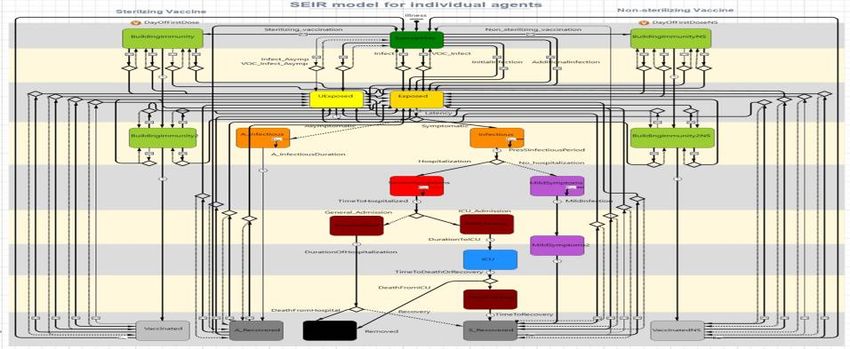
Delta), refer to annex for detailed assumptions on modelling.Types of models used to inform decision making
Statistical forecast models:
• Short-range forecast of expected cases given recent incidence
Long-range forecast models:
• Dynamic compartment model adapted to project near-future
given recent incidence and scenarios for control/release/variants
of concern
Models to explore scenarios of opening up:
• More complex models
• Deterministic, age structured compartment model
• Agent-based model
• Initially developed to model control measures needed
• Recently adapted to model effects of vaccination and
transmission of VOC
Details on modelling and assumptions: https://www.sciencedirect.com/science/article/pii/S1755436521000177;
https://www.canada.ca/en/public-health/services/reports-publications/canada-communicable-disease-report-ccdr/monthly-issue/2020-46/issue-6-june-4-2020/predictive-
modelling-covid-19-canada.html; https://nccid.ca/news/phac-modelling/; https://www.canada.ca/content/dam/phac-aspc/documents/services/reports-publications/canada- 16
communicable-disease-report-ccdr/monthly-issue/2020-46/issue-11-12-nov-5-2020/ccdrv46i1112a08-eng.pdf; https://www.cmaj.ca/content/192/37/E1053.longLonger-range forecasting model assumptions
• The forecast uses compartmental models reflecting the biology of COVID-19 and public health response developed by
PHAC in collaboration with McMaster University. It projects the near future given recent incidence of COVID-19 and
scenarios for public health measures, variants of concern and vaccination.
• The model assumes that the B.1.617.2 (Delta) VOC is 50% more transmissible compared to B.1.1.7 (Alpha). This value is
used to estimate the rate at which VOCs replace existing strains.
• Delta is considered to have been introduced in mid-March at very low prevalence. Proportions vary across provinces. The
proportion of cases due to VOCs are indirectly fitted when calibrating to data.
• Vertical dashed lines represent previous stages of re-opening. Solid vertical lines represent current/upcoming/potential re-
opening and result in increases in overall transmission.
• The national forecast includes two scenarios for changes in the effective transmission rate from the last re-opening date.
This includes a line showing the expected change in cases if effective transmission rates do not increase (grey line) and a
line that assumes effective transmission increases by 25% (blue line). Some PT forecasts also include a third line that
assumes effective transmission increases by 50% (orange line). There is uncertainty about the effect of the most recent re-
opening, which propagates forward in the forecasting scenarios.
• The PHAC-McMaster model forecast includes current vaccine roll-out, including an assumption that vaccinations are 60%
effective against infection after one dose and 90% after second dose for all variants except for Delta (30% after one dose
and 80% after second dose). The vaccine projections assume 10% for first dose and 15% for second dose hesitancy of
the eligible population.
17Assumptions for the modelling of restrictive public health measures
• An age-stratified agent-based model was used for exploring the impact of vaccination rates on lifting of public health measures (slide 11).
• Key model assumptions include:
• The vaccine is 60% effective at preventing infection and 80% effective at preventing hospitalization after one dose, and 92% effective at preventing
infection and 96% effective at preventing hospitalization after two doses;
• A VOC modelled on B.1.1.7 (alpha) was introduced in December 2020 and is 50% more transmissible and 40% more virulent than the wild-type
strain, but does not have immune breakthrough from vaccines;
• A second VOC modelled on B.1.617.2 (delta) was introduced in March 2021 and is 50% more transmissible and 100% more virulent than alpha with
immune escape from vaccines causing a 33% reduction in protection against infection after the first dose and a 6% reduction in protection against
infection after the second dose;
• Hospital bed capacity available for COVID-19 patients in Canada is estimated at 31 per 100,000;
• The vaccination period begins Dec 14, 2020 and the end date varies from mid-August to early September depending on the scenario and the level of
vaccine uptake;
• Vaccination roll-out proceeds in order of priority groups as recommended by NACI with a 4-month interval between doses starting from March 4,
2021. The 4-month delay progressively decreases to a 28-day interval by June;
• Vaccine acceptance by age group is estimated from two Canadian surveys (2020 Canadian Community Health Survey – September 2020) and EKOS
probability based research panel (January 6-11, 2021) and data from the Canadian Immunization Committee (data used for these models were from
the report dated July 8). Increased acceptance rates in in the 18 to 39 year olds was based on 72% of Canadians in this age group indicating
willingness to accept a vaccine, an increase to 80% is assumed to be a reasonable increase given estimated vaccine acceptance;
• For all scenarios, a two-step gradual approach to lifting public health measures was modelled. Restrictive measures are lifted gradually in summer
when at least 75% of those 12 and over have received their first dose and at least 20% have received their second dose (commencing June 21, 2021
with full reopening by September 1, 2021). The easing of personal protective measures occurs when at least 75% of those 12 and over have received
their second dose (commencing August 2, 2021 with return to pre-pandemic contact rates by September 1, 2021). Until these time points, the
epidemic is controlled by a combination of restrictive closures, case detection and isolation, contact tracing and quarantine, and physical distancing.
• Reopening of the Canadian border to travellers commences on August 6, 2021, with the assumption that imported cases increases three-fold from
the current rate of 2 per 100,000 to 6 per 100,000 per week, imported cases are estimated from the PHAC importation model
18You can also read


