Update to reflect faster growth - August 2017 - Interest.co.nz
←
→
Page content transcription
If your browser does not render page correctly, please read the page content below
Update to reflect faster growth
August 2017

                                  1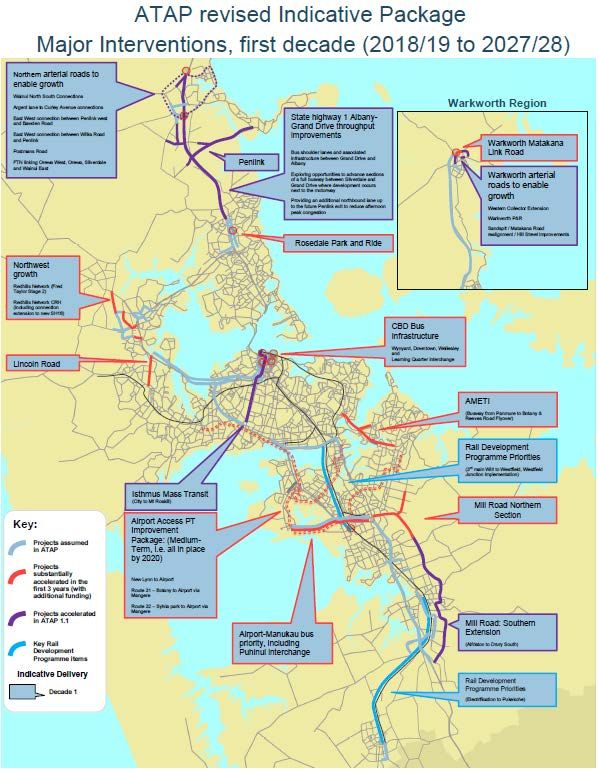
Contents

  1. Executive summary

  2. Purpose

  3. Background

  4. Updating the ATAP Indicative Package
       a. New growth information
       b. Enabling and supporting faster greenfield growth
       c. Addressing pressure on core transport networks
       d. Operating costs

  5. Revised funding gap
       a. Summary
       b. Refining the original ATAP indicative package
       c. Additional NLTF and Auckland Council revenue
       d. Housing Infrastructure Fund and Crown infrastructure
          Partners
       e. Rail infrastructure funding

  6. First Three Years (2018-2021)

                                                                 2
Executive Summary
a) The Auckland Transport Alignment Project (ATAP) report of September 2016 set out an
agreed strategic approach for the development of Auckland’s transport system over the
next 30 years, including an indicative $24 billion investment package for the 10 years
from 2018. It also identified that funding in current central and local government statutory
plans projected a $4 billion shortfall (the funding gap).
b) New information has become available since ATAP was completed, in particular higher
than expected population growth and revised forecasts, as well as more clarity about the
likely location of future growth. ATAP’s overall strategic approach remains valid, but
these changes impact on the likely quantum, timing and sequencing of investments
required to accommodate and fully realise the benefits from this growth.
c) As requested by the Minister of Finance, Minister of Transport and the Auckland Mayor,
the ATAP agencies have updated the indicative package and estimate for the first
decade funding gap to reflect higher growth.
d) This report identifies investments over and above the original ATAP indicative package.
Around $2.9 billion ($2.65 billion of capital expenditure and $250 million operational
expenditure) of additional investment is likely to be required over the next decade to
address the impacts of faster growth. Additional investment is mainly targeted to
enabling and supporting faster greenfield growth and addressing network constraints in
existing urban areas exacerbated by faster overall population growth.
e) The $2.9 billion is partly offset by around $1 billion from additional forecast revenue and
reallocating renewals savings to accelerated projects. This does not take into account
the funding implications from the recently announced Crown Infrastructure Partners
Special Purpose Vehicle, which could provide a source of revenue to help address the
funding gap.
f) Taking into account the updated revenue and expenditure estimates, the first decade
funding gap has increased to $5.9 billion (an increase of $1.9 billion to ATAP’s original
estimate).
g) The updated indicative package also includes $770 million for below track rail projects
which would provide for increased freight and passenger services. While this investment
does not contribute to the ATAP funding gap (as Crown funding is assumed to be
available, subject to business case assessment) under current funding arrangements it
would require specific funding approval from the Government.
h) Sequencing of the indicative package over the next decade has been updated to enable
planned growth and support the efficient delivery of key investments. This suggests the
funding gap for the first three years increases from $380 million to $1.3 billion.
i) This information has been prepared in a short period of time without detailed
modelling. Because of this, there is an inherent level of uncertainty and need for ongoing
work to ensure all investments deliver value for money.
3Purpose
1. This report responds to a request by Ministers and the Mayor to update the ATAP
indicative package to reflect higher population growth projections.
2. The report provides an updated indicative package and funding gap that has been
agreed by the ATAP agencies 1. This is to inform upcoming funding decisions and
development of Auckland’s Regional Land Transport Plan.
Background
3. ATAP set out an agreed strategic approach for the development of Auckland’s transport
system over the next 30 years, as well as an indicative package that illustrates the type
and quantum of investment likely to be required to deliver this strategic approach. The
indicative package included all operational and capital expenditure by the New Zealand
Transport Agency (NZTA), Auckland Transport, and KiwiRail in Auckland over the next
10 years and is now guiding the development of 2018 statutory transport planning and
funding documents.
4. The package was a mixture of committed and uncommitted investments and totalled
around $24 billion over the 2018-28 period. Compared to around $20 billion projected to
be available under current funding plans, this left a $4 billion funding gap. 2
5. ATAP recommended the Government and Auckland Council work together to consider
options and agree on an approach to address the funding gap by mid-2017, to inform
statutory funding documents.
6. An update on progress was provided in June 2017. This update highlighted the
potentially significant impact on the funding gap of faster than expected population
growth. In response to this, the Mayor and Ministers requested an update to the ATAP
indicative package to help inform upcoming funding decisions.
1
Auckland Council, the Ministry of Transport, Auckland Transport, the New Zealand Transport
Agency, the Treasury and the State Services Commission.
2
ATAP's estimate of $20 billion being available in "current funding plans" was based on planned
investment out to 2025 in the 2015 Regional Land Transport Plan (RLTP), the Council's 2015 Long-
term Plan (LTP) and NZTA's 2015 National Land Transport Programme. The 2025-28 period was an
extrapolation of these plans.
4Updating the ATAP Indicative Package
New growth information
7. Combining new Stats NZ population projections from February 2017 with recent planning
work undertaken by Auckland Council, we now have an updated estimate of the timing,
location and scale of population and employment growth over the next decade.
8. Auckland’s population has grown rapidly in recent years and new population projections 3
have around 100,000 more people living in Auckland at the end of the first decade than
what was anticipated by ATAP. A breakdown of the new projections is shown below 4:
2013 2013-2026 Growth
Area Old
population New Projections Change
Projections
Northern
Greenfields 32,265 13,000 27,100 14,100
Northwest
Greenfields 33,245 27,600 26,600 (1,000)
Southern
Greenfields 10,161 28,900 35,800 6,900
Rural Areas &
Towns 73,637 9,300 16,700 7,300
Existing Urban
Area 1,247,278 331,700 396,800 65,100
Total 1,396,586 410,500 503,100 92,600
9. Broadly, 70% of the extra growth is anticipated to be located in the existing urban area
and 30% outside it. Of the growth in newly urbanising (greenfield) areas, the greatest
increase from previous projections is in the north (+14,000 people) and the south
(+7,000). The northwest greenfield area is expected to grow slightly more slowly than
previously expected, but still substantially.
10. Overall more land has now been ‘opened up’ for greenfield development.
Process
11. To update the indicative package, we focused on how the changes to growth projections
will affect key ATAP outcomes: to support growth, improve access, address congestion
and increase public transport modeshare on congested corridors.
12. Growth is a key driver of transport investment in two ways. Firstly, there is the need to
provide infrastructure that enables housing and business development, especially in new
greenfield growth areas. Secondly, to fully realise the benefits of growth through
increasing access to opportunities, there is the need to address capacity constraints on
existing corridors created by higher travel demand. Modelling indicates that, without
3
These projections are based on a medium population growth scenario, consistent with ATAP. This
scenario assumes Auckland’s growth rate returns to historic averages over time. If growth continues
at a faster rate, further additional investment is likely to be required.
4
2026 is used because the ART3 regional transport model is set up to model the years 2026, 2036
and 2046.
5additional investment, the benefits of faster growth will be largely offset by growing
congestion.
13. We have undertaken this analysis using tools and information we have access to in the
limited time available. This included:
a. Collating and analysing information from the Supporting Growth programme
business case, a strategic plan for Auckland’s major growth areas developed by
Auckland Council, Auckland Transport and NZTA, 5 on necessary infrastructure to
enable and support greenfield growth
b. Modelling the performance of ATAP’s original indicative package against updated
population projections to understand where projected demand and congestion
has changed
c. Collating and analysing information from investment prioritisation undertaken by
Auckland Transport and NZTA to develop the RLTP, in particular Auckland
Transport’s internal prioritisation tool for capital projects (this has been developed
to broadly reflect the ATAP approach and priorities).
14. We used the ATAP indicative package as a foundation for identifying further investments
that could be accelerated from the second decade.
15. This information has been prepared in a short period of time without detailed
modelling. Because of this, there is an inherent level of uncertainty and need for ongoing
work to ensure all investments deliver value for money. As with ATAP, the revised
indicative package is not intended to be an investment programme, as all transport
investments need to go through business case approval to proceed.
Enabling and supporting faster greenfield growth
16. As outlined in the ATAP report, greenfield growth areas need substantial investment
before significant development can occur. Some of this investment is required to open up
land for development, alongside larger scale improvements needed to better connect
these areas to the rest of Auckland.
Northern Greenfields
17. Planning decisions made since ATAP's completion mean the timing of greenfield growth
in parts of north Auckland (Wainui/Silverdale) has been brought forward into the first
decade.
18. Enabling accelerated greenfield growth in this area will require local arterial road
networks to be completed faster than originally anticipated. Furthermore, transport
modelling suggests the faster growth will create a number of transport challenges,
including:
a. Increased traffic flows on the Northern Motorway between Silverdale and Albany,
increasing congestion in the peak direction (between Albany and the central city,
the motorway is predicted to be already at capacity).
5
Supporting Growth Business Case https://at.govt.nz/projects-roadworks/supporting-growth-
delivering-transport-networks/
6b. Increased local traffic, particularly around the Silverdale motorway interchange
that is already highly congested.
c. Increased bus passengers on the Northern Busway (from Silverdale to the city
centre), contributing to higher bus volumes in the city centre.
19. Accelerating the investments outlined in the table below into the first decade would
address these challenges:
Accelerated Investment Cost Explanation
Impact 6
Penlink (two-lane road future- $240m • Penlink eases pressure on the Silverdale
proofed for widening) interchange by providing an alternative
route for trips to/from the Whangaparaoa
Peninsula.
• The project’s business case suggests it is
well suited to a toll. 7
Arterial roads to enable growth $300m • Very few arterial roads in this area were
(including Warkworth) originally identified in ATAP.
• These roads are essential to enabling
greenfield development around Silverdale
West/Wainui and in Warkworth
• Some of these roads have been identified
for investment through the recently
announced Special Purpose Vehicle
(SPV), Crown Infrastructure Partners.
State highway 1 Albany-Grand $300m • Would increase throughput between
Drive throughput improvements Albany and Grand Drive (near Orewa)
(e.g. bus shoulder lanes & without adding to congestion south of
associated infrastructure, Albany. This could include:
northbound capacity etc.) o Bus shoulder lanes and associated
infrastructure between Grand Drive
and Albany.
o Providing an additional northbound
lane up to the future Penlink exit to
reduce afternoon peak congestion.
o Exploring opportunities to advance
sections of a full busway between
Silverdale and Grand Drive where
development occurs next to the
motorway.
Total $840
million
6
The ‘cost impact’ figure reflects the increase relative to the costs assumed in the ATAP Indicative
Package.
7
Penlink business case (2015): https://at.govt.nz/media/981789/Penlink-Business-Case-2015-
Draft.pdf
7Southern Greenfields
20. The pace of greenfield growth in the south is expected to be faster than previously
anticipated, especially in Drury West.
21. Similar to the north, enabling this growth will require building or upgrading local arterial
roads earlier, while transport modelling suggests the following additional transport
challenges:
a. Increased congestion on the Southern Motorway, in the peak direction and
interpeak in both directions, particularly between Drury and Papakura
b. Increased local traffic, particularly around the Drury motorway interchange.
22. Accelerated growth in the Drury area, and more broadly across Auckland and in the
northern Waikato, combine to increase congestion along the southern part of the
Southern Motorway. This is in spite of the widening between Papakura and Drury
included in ATAP’s first decade priorities.
23. Growing interpeak congestion is a significant issue as the Southern Motorway is the key
inter-regional connection between Auckland, the Waikato and most of the rest of New
Zealand. This part of the motorway is a key resilience risk, with very few alternative
routes to the south. Travel delays and poor reliability also risk undermining the benefits
from the Waikato Expressway.
24. Accelerating the investments outlined in the table below into the first decade would
address these challenges:
Accelerated Investment Cost Explanation
Impact
Completing the Mill Road $500m • The northern section between Takanini
corridor to provide a major new and Manukau is already within the ATAP
route east of State highway 1 first decade indicative package.
from Drury to Manukau • Constructing the whole corridor, around $1
billion, is key to addressing southern
motorway congestion and resilience
issues.
• An additional $500 million would
accelerate progress towards completing
the entire corridor over the next ten years.
This investment would also improve local
connections and support growth between
Papakura and Drury.
Arterial roads to enable growth $150m • A number of local arterial roading projects
and new train stations that enable greenfield growth in the south
were already included in the ATAP
indicative package.
• Faster growth in Drury West is estimated
to bring forward the need for around $150
million of additional investment over the
next decade.
8Accelerated Investment Cost Explanation
Impact
• Some of these projects have been
identified for investment through the
recently announced SPV, Crown
Infrastructure Partners.
Total $650
million
Northwest Greenfields
25. While substantial greenfield growth is projected to take place in the northwest part of
Auckland over the next decade, recent decisions on the timing of this growth suggest
faster population growth in some parts of the northwest (Red Hills/Massey North) will be
slightly more than offset by slower growth in Hobsonville and Whenuapai (a 1%
decrease in total).
26. These changes mean that growth in the northwest is now focused closer to existing
urban areas, meaning fewer new arterial roads will be required to enable urbanisation.
Around $150 million of investment, largely arterial roads around Whenuapai, can now be
deferred to the second decade.
Addressing pressure on core transport networks
27. High population growth since 2013 has generally increased congestion and reduced
travel speeds. While the full effects of the recently opened Waterview Tunnel have yet to
be fully understood, early indications are that the tunnel is delivering benefits to
congestion at a system-wide level and resulting in more efficient operation of the roading
system overall. Nevertheless, ATAP projected a rise in congestion from 2013 to 2026 8,
despite substantial investment. Faster growth is bringing this forward.
28. Around 70% of the extra growth is projected to occur in existing urban areas, meaning
the additional travel demand is broadly spread throughout the city. Because many parts
of the core transport network are already under significant strain, even relatively small
increases in demand may lead to more congestion and slower travel times.
29. A number of major improvements to Auckland's core transport networks 9 are either
committed (City Rail Link, East West Link, accelerated motorway package including the
Northern Busway extension to Albany etc.) or already included in the ATAP indicative
package (Northwestern Busway, AMETI, Eastern Airport Access (SH20B), Southern
Motorway widening between Papakura and Drury etc.).
30. Further major investments identified as medium term priorities in ATAP were considered
for acceleration, with particular regard given to corridors seeing the greatest increases in
demand and those serving the fast growing and strategically important city centre and
airport.
8
See ATAP Recommended Strategic Approach page 39. After 2026 congestion under the indicative
package reduces as smarter transport pricing takes effect.
9
The report uses the phrase “core transport networks” to refer to high volume transport infrastructure
(e.g. major roads, rail and public transport corridors) in existing urban areas
9Network Optimisation and Influencing Travel Demand
31. ATAP identified major challenges with adding capacity to many parts of Auckland’s core
transport networks, due to its challenging physical geography and the high costs of
providing new infrastructure. This means faster growth further emphasises the need to
make better use of existing networks and influence travel demand, key parts of the ATAP
strategic approach.
32. ATAP envisaged implementation of “whole of network” road pricing in the second
decade, which significantly improved transport network performance by varying the cost
of travel by time and location. Separate to this funding work, the Auckland Smarter
Transport Pricing Project will be exploring a range of pricing options and implementation
timeframes. Faster growth means there are likely to be benefits from earlier
implementation of pricing, but given this work is still at the early stages of development,
pricing has not been included in this revised package.
33. Funding targeted to network optimisation (i.e. increasing throughput of people on key
routes) has already been increased and work is progressing to identify key movement
routes and develop an updated framework for making difficult trade-offs along these
corridors. ATAP signalled the need to progress these operational decisions and increase
funding for interventions. Progress in this area has not yet occurred at the pace or scale
required to make a significant difference to network performance.
34. Faster growth means further investment and effort in network optimisation (over and
above what was signalled in ATAP) is likely to be required, including efforts to accelerate
the uptake of current and developing technologies. There also appears to be a need for
a greater focus on improvements in South Auckland where traffic volumes are projected
to increase the most under the new growth projections. This is detailed below:
Accelerated Investment Cost Explanation
Impact
Network optimisation (including $300m • Optimisation activities should include
digital technology), with an interventions to improve the productivity
initial focus in the south on key arterial routes such as intersection
upgrades, minor road layout changes,
street space reallocation, traffic light
optimisation improvements and more
active traffic management.
• Additional investment to accelerate the
uptake of Mobility as a Service,
autonomous and connected vehicle trials,
and other developing technologies will
help make a substantial contribution to
optimising existing networks over time.
City Centre Access
1035. Since 2010, the number of jobs in the city centre has increased from 88,000 to 116,000
and the population has grown from 30,000 to nearly 53,000 . 10 Tertiary student numbers,
a major contributor to travel demand, have also grown. This rapid growth is projected to
continue, increasing pressure on transport networks serving New Zealand's largest
employment area. Constrained access to the city centre and high competition for street
space means growing demand needs to be accommodated through an ongoing modal
shift to public transport, walking and cycling.
36. The City Rail Link and associated further rail improvements will cater for a substantial
proportion of increased trip demand into the city for the parts of Auckland served by rail.
However major catchment areas, particularly parts of the isthmus and the North Shore,
are not served by rail and continue to be reliant on bus services to meet growing travel
demand.
37. Modelling outputs indicate bus ridership on corridors accessing the city centre is now
projected to grow more rapidly. These increases combine on the two highest volume
access routes: Symonds Street and Fanshawe Street, which are already under
significant strain at peak times. Faster population and employment growth means bus
ridership on Symonds Street, Auckland's busiest bus corridor, is tracking 3-4 years
ahead of previous projections.
38. ATAP highlighted the challenge of meet growing demand on Symonds Street beyond the
mid-2020s through bus efficiency improvements including double-decker buses, route
optimisation, bus priority measures and bus terminus facilities. Business case analysis of
this issue undertaken by Auckland Transport and NZTA highlights that as the corridor’s
capacity is reached and exceeded, major delays and poor reliability will be experienced
across large parts of Auckland’s bus network, ultimately making the city centre harder to
access.
39. A mass transit solution (advanced bus or light rail) costing up to $1.2 billion was
therefore identified by ATAP as being necessary early in the second decade. $500
million was allocated in the first decade to fund route protection and early stages of
construction. Faster bus ridership growth on this corridor now indicates completion of this
investment should be brought forward by 3-4 years into the first decade, as detailed
below:
Accelerated Investment Cost Explanation
Impact
Completion of isthmus mass $700m • Mass transit provides substantial
transit (city to Mt Roskill) within additional capacity for public transport
first decade. Mode and detailed services into the city centre, through a
timing to be determined through shift to much larger vehicles that can carry
business case process. many more people.
• Utilising Queen Street as a city centre
mass transit corridor takes substantial
pressure off the highly constrained
Symonds Street and Wellesley Street
10
http://nzdotstat.stats.govt.nz/wbos/Index.aspx, from the Business Demography Statistics and
Population Estimates sections, respectively. 2017 “current” numbers extrapolated from 2015-16
growth level.
11Accelerated Investment Cost Explanation
Impact
corridors, benefiting the remaining buses
and general traffic.
40. Since ATAP’s completion further work has been undertaken into the preferred mode for
this investment. The Boards of Auckland Transport and NZTA agreed in February this
year to progress route protection and undertake further work on a proposed ‘staged
transition’ from bus to light rail to further assess key operational elements, required
trade-offs, flow on effects, transition impacts, and resilience issues.
41. By the end of 2018 this work will have been completed, giving a more complete picture
of the likely timing and costs for this investment. Work to progress isthmus mass transit
needs to be developed in a way that future proofs for integration with a longer-term
extension to the airport
Airport Access
42. Travel to and from Auckland Airport is limited to just two corridors - one from the north
(State highway 20A) and one from the east and south (State highway 20B). Air
passenger volumes and job numbers in the broader airport precinct are growing quickly
and projected to drive an increase in peak time trips to the airport from 9,000 to 15,000
over the next decade. This will continue to place substantial pressure on the networks
accessing New Zealand’s international gateway.
43. Major upgrades to State highway 20A are nearly complete and a range of short to
medium term measures are being progressed, including improvements to State highway
20B, upgrades and grade separations at key intersections and the introduction of bus
shoulder lanes. ATAP included a major upgrade of State highway 20B in its indicative
package - but allocated bus improvements from the Airport to Manukau as a second
decade priority. Fast growth and construction efficiency opportunities mean this should
be brought forward.
Accelerated Investment Cost Explanation
Impact
Airport-Manukau bus priority, $50m • Rapid growth in travel demand to and from
including Puhinui interchange the Airport is accelerating the need to
provide reliable, congestion free travel
options to and from the airport.
• There are likely to be major construction
efficiencies from bringing forward bus
improvements to align with the upgrade of
State highway 20B.
• The fastest and most efficient way of
providing a high quality rapid transit
connection between the city centre and
Airport is through improved bus
infrastructure between the Airport and
Puhinui train station (with connection to
Southern line trains) and an upgrade of
12Accelerated Investment Cost Explanation
Impact
that station to a key bus/rail interchange.
Rail Ridership Growth
44. Auckland's rail ridership continues to grow strongly and is expected to reach 20 million
annual boardings this month, up 17% over the past year. The ATAP indicative package
identified the need for a tranche of three-car electric trains over the first decade.
45. The purchase of additional trains to address the immediate impact of rapid patronage
growth is being brought forward into the 2018-2021 period (subject to NZ Transport
Agency approval). This will provide for an uninterrupted train services to Pukekohe,
aiding development south of Papakura and easing road congestion.
46. However, modelling of the updated growth projections suggests substantial additional rail
passenger demand along the Southern Line, from Pukekohe right through to the city
centre. This impact, on top of the increase in patronage expected from the City Rail Link
highlights the likelihood of further new trains being required over the next decade.
47. Maximising the benefits from these new trains and enabling passenger and freight
services to operate reliably depends upon completion of key below-track rail
improvements in the original ATAP Indicative Package. This includes extra tracks
between Westfield and Wiri11, a train control centre, resilience improvements and
extending rail electrification to Pukekohe.
Accelerated Investment Cost Explanation
Impact
Second tranche of new electric $260m • Faster ridership growth means that once
trains City Rail Link opens in 2023/24, a second
tranche of new trains and associated
infrastructure is likely to be required.
Operating costs
48. Approximately $250 million of additional operating expenditure is estimated as being
required to meet the needs of a larger population (an average of $25m per year), a 5%
increase from ATAP in line with faster growth. This is comprised of:
a. Increased net public transport operating costs to provide extra services to meet
higher demand. Modelling indicates public transport ridership will reach
approximately 150 million annual trips (compared to 142 million under the
previous growth projections) by 2026.
b. Additional operational investment in network optimisation, targeted to more active
traffic management.
11 rd
This report includes the costs required to deliver a 3 track from Westfield to Wiri. As part of further
developing this investment and in line with the project’s business case, consideration should be given
th
to optimal timing and integration with a 4 track.
13Revised funding gap
49. Taking into account updated revenue and expenditure information, the revised funding
gap is estimated to be around $5.9 billion. This is an increase of $1.9 billion from the
original ATAP funding gap estimate of $4 billion.
50. The key components of this change are summarised in the table and detailed further in
the following section.
Net impact Comment
Additional proposed investment $2.9 billion $2.65 billion of capital expenditure and
(as per previous section) $250m of operational expenditure
Reconciliation with ATAP ($500m) Net impact of cost increases, RLTP
package refinement, cost reprioritisation and renewals savings.
changes and renewals savings
Additional projected NLTF and ($506m) $490m of extra NLTF revenue
Council revenue from faster $16m of extra Council rates revenue
population growth
Housing Infrastructure Fund HIF funding has no impact within the
(HIF) and Crown Infrastructure first decade. CIP could reduce the first
Partners (CIP) decade funding gap once final
proposals are confirmed.
Total impact on funding gap $1.9 billion
Approach
51. The $2.9 billion of investment proposed to be brought forward from the second decade
into the first decade is comprised of $2.65 billion of capital expenditure and $250 million
of operating expenditure.
52. To identify the updated funding gap we have incorporated a variety of updated
information since ATAP was completed in September last year:
a. Refinement and reprioritisation of the original ATAP indicative package, including
new project cost information and further work done on refining renewals costs 12
b. Additional estimated revenue from a larger population base
c. Impact of Housing Infrastructure Fund and Crown Infrastructure Partners
announcements.
53. All numbers are reported in $2016 to maintain consistency with ATAP.
12
Since ATAP was completed the City Rail Link project’s costs have changed. However, decisions by
Council and Government earlier this year have provided additional funding to cover these costs
changes, meaning there is no material impact on the funding gap.
14Refining the original ATAP indicative package
54. Auckland Transport and NZTA are developing their detailed future transport programmes
as part of preparing the 2018 Regional Land Transport Plan (RLTP).
55. This has involved more detailed analysis of smaller projects within the ATAP indicative
package than was possible during ATAP, as well as reflecting cost and scope changes
that have emerged over the past year.
56. ATAP recommended NZTA and Auckland Transport undertake further work to agree
appropriate asset management levels of service and associated funding requirements.
This work has concluded around $2.6 billion of investment is required in road renewals
over the next decade, rather than the previous estimate of $3.1 billion. This level of
investment would still deliver acceptable levels of service and reflects a slower increase
in the level of investment from current levels, not a reduction.
57. Overall the key impact is that an estimated $500 million reduction in road renewals
expenditure has allowed a number of the high priority new investments identified earlier
in this report (e.g. additional new electric trains, Airport access improvements, parts of
Mill road) to already be earmarked for inclusion within the original $24 billion ATAP
funding level. A reconciliation exercise has been undertaken to avoid double-counting.
58. The net impact of this reconciliation has the potential to reduce the additional funding
required from $2.9 billion to around $2.4 billion, with the specific amount depending on
the final RLTP.
Additional NLTF and Auckland Council revenue
59. National Land Transport Fund (NLTF) revenue is projected to increase by $490 million
as a result of private vehicle travel resulting from higher than expected population
growth. We have assumed the share of NLTF revenue for Auckland is based on historic
funding trends and that overall revenue increases in line with projected increases to
vehicle travel.
60. Growth in Auckland Council’s key revenue sources is not driven directly by either
population increases or GDP growth but rather by development growth (increases in the
size of the rating base) and political decisions to increase rates or development
contribution prices.
61. Auckland’s population growth in recent years has far outpaced dwelling growth, leading
to an increase in household size and around 25,000 fewer dwellings in 2016 than the
land-use scenario underpinning ATAP had anticipated.
Old Projections New Projections
Population 1,574,000 1,580,000
2016 Dwellings 550,000 525,000
Household Size 2.86 3.01
Population 1,854,000 1,949,000
2028 Dwellings 682,000 673,000
Household Size 2.72 2.90
1562. This shortfall is anticipated to be reduced in the longer term, partly through the initiatives
identified in this report. However, modelling undertaken by Auckland Council indicates
that Auckland’s increased population growth is expected to be accommodated in broadly
the same number of dwellings. This means the faster growth does not directly translate
into a major increase in rates and development contributions from what was previously
forecast. Auckland Council have advised that faster business growth will create a minor
$16 million anticipated increase to rates revenue.
Housing Infrastructure Fund and Crown Infrastructure Partners
63. The Housing Infrastructure Fund (HIF) has no net effect on the first decade funding gap
as it must be repaid within the decade from existing revenue sources.
64. In July 2017 around $364 million of transport investment was announced for likely
funding through Crown Infrastructure Partners. This is focused on enabling growth in the
northern and southern greenfield areas. This amount, and ultimate decisions around how
the money is eventually repaid, are still early in their development and may change over
time. Therefore we have not assumed any impact on the funding gap at this time.
Rail infrastructure funding
65. Around $770 million 13 of first decade investment in “below-track” rail infrastructure was
identified in the Rail Development Plan that informed ATAP. This includes electrification
to Pukekohe, an additional track from Wiri to Westfield and a number of other network
improvements. These costs were included in the original ATAP indicative package, but
were assumed to be funded by the Crown (subject to business cases) and are therefore
not included in the original or revised funding gap. Under current funding arrangements,
specific funding decisions by the Crown are required for these projects to proceed.
66. The ATAP agencies, KiwiRail and Greater Wellington Regional Council are currently
developing terms of reference for a review of the metro rail operating model which may
have implications for future rail funding arrangements.
13
This differs from the original estimate in ATAP of $470 million, primarily due to mis-categorisation of
the Pukekohe electrification project.
16First Three Years (2018-2021)
67. Major statutory funding plans are developed on three-year cycles, making it particularly
important to understanding funding requirements for the 2018-2021 period.
68. ATAP assumed approximately $6.5 billion of total investment (capital and operational
expenditure) over the first three years for a mix of committed and uncommitted projects
but did not set out to provide a detailed view of sequencing within the first three years.
69. In response to current rapid population growth and better information about project
sequencing and cost, Auckland Transport and NZTA have developed a revised three
year programme. This programme increases investment from $6.5 billion to $8.3 billion
over 2018-2021. The increase is comprised of:
a. Approximately $300 million of cost changes for committed NZTA projects and
accelerating development of further key initiatives. This is offset by lower NZTA
expenditure later in the decade.
b. Around $720 million of accelerated Auckland Transport capital expenditure
focused on addressing the transport impacts of rapid recent growth and providing
capacity for future development
c. An extra $800 million for City Rail Link, which already has funding arrangements
in place.
70. There is already a significant existing State highway investment programme for 2018-
2021. This includes the Northern Corridor, Southern Corridor, Puhoi-Warkworth and East
West Link. The current stage of project development, alongside buildability constraints,
mean there are limited opportunities to further expand delivery of the State highway
programme over the next three years. Extra efforts should therefore focus on advancing
planning, design, consenting and land acquisition for later projects.
71. Key initiatives from the first decade package that would be brought forward into the next
three years with this extra funding include:
a. Advancing development of the “next generation” of State highway projects,
including the SH16/SH18 interchange, Southern Motorway widening between
Papakura and Drury, improved Eastern Airport Access (SH20B) and the
Northwestern Busway 14. Major construction on these initiatives is likely to occur
after 2021 as further consenting, property acquisition and design work is
required.
b. Accelerating Auckland Transport’s programme, targeting high priority and well
developed investments including the AMETI Eastern Busway and associated
Reeves Road flyover, Mill Road, the earlier purchase of new electric trains, along
with earlier completion of key city centre bus lanes and interchanges.
c. Completing approximately $250 million of rail network infrastructure upgrades to
cater for ongoing rapid growth in rail ridership and increasing freight volumes,
14
ATAP had the Westgate to Te Atatu section of the Northwestern Busway in the first decade, and
the Pt Chevalier to Newton section in the second decade. Subsequent business case work suggests
focusing on the Newton to Pt Chevalier and Te Atatu to Lincoln Rd sections first to maximise value for
money.
17including an additional track from Westfield to Wiri and a variety of key network
resilience and performance upgrades.
72. Developing a programme to respond to rapid changes in growth is challenging due to the
lead times associated with funding approval, land acquisition and Resource
Management Act requirements. This provisional programme has been developed to
provide for a steady increase in construction activity over the first three years, reaching a
steady state that is maintained afterwards. This is intended to give the market time to
respond, while providing confidence that activity level will be sustained for some time.
73. Auckland Transport has advised delivering this level of investment is achievable as a
number of key large projects, such as AMETI and Mill Road, are well advanced.
However, this depends on certainty over long-term funding, flexibility within the overall
programme and early decisions to proceed. This is particularly important for land
acquisition, which is usually the ‘critical path’ element of project development that
determines delivery timeframes.
74. The financial implications of these changes increase the funding gap for 2018 - 2021
from the $380 million to $1.3 billion (excluding below track rail infrastructure).
18Appendix 1: Cost Benefit Ratios for Major Additional Investments
Auckland Transport has collated benefit-cost ratios (BCR) as part of the 2018 LTP/RLTP
prioritisation process. This memorandum provides BCRs for projects which are considered
to be accelerated under ATAP 1.1. BCRs are subject to change as new information
becomes available.
Project Name BCR Source
Penlink • Government BCR 5.7 Penlink Transport Analysis update – interim
• National BCR 3.5 report
Prepared by Beca, 2016
Arterial roads in the • Programme BCR (North) 3.2 to 3.7 Transport for Future Urban Growth – Dairy Flat &
North to enable • Programme BCR (Warkworth) 1.1 Wainui East – Short List & Economic Evaluation
growth (including Prepared by Beca, 2016
Warkworth) Transport for Future Urban Growth – Warkworth
Long list and Short List
Prepared by Jacobs, 2016
Mill Road Corridor • Mill Road Northern Section 3.7 Transport for Future Urban Growth – South Area:
• Programme BCR (South) 3.6 to 3.7. Includes Long list and Short List
southern sections of Mill Road. Prepared by Flow Transportation Specialists,
2016
Arterial roads to Programme BCR (South) 3.6 to 3.7 Transport for Future Urban Growth – South Area:
enable growth and Long list and Short List
additional train Prepared by Flow Transportation Specialists,
stations, in the South 2016
Arterial roads in the Programme BCR (Northwest) 2.2 to 3.4 Transport for Future Urban Growth – North West
Northwest to enable Area: Long list and Short List
growth Prepared by Flow Transportation Specialists,
2016
Network optimisation • Network optimisation ranges between 4 to ITP Consolidated response template - Network
(including digital 14 optimisation programme has multiple projects
technology), with a • Intelligent transport system ranges between with varying BCR from 4 (Whangaparaoa Road
particular focus in the 5.2 to 9.1 Dynamic Lane) to 14 (City Centre Signal
south Optimisation)
ITP Consolidated response template - Intelligent
transport system considered for AMETI has
varying BCR from 5.2 to 9.1
Mass Rapid Transit Programme BCR 0.7 – 1.9 Central Access Plan Programme Business Case.
Note that this figure also includes the cost of
other elements no longer intended to be
progressed (e.g. a heavy rail spur to Mt Roskill),
meaning further analysis is likely to result in a
higher BCR.
Airport-Manukau bus Programme BCR (Airport PBC) 0.6 - 3 Airport PBC has a BCR of: 0.6 - 3.0. Specific
priority, including Puhinui interchange BCR is yet to be developed
Puhinui interchange Prepared by Aurecon, 2017
Second tranche of BCR range between 2.8 to 3.2 Based on Auckland metro train capacity DBC
new electric trains (2017)
19Appendix 2: Map of first decade major investments
20You can also read