Update to the Nontraditional Lamb Market in the United States 2010 Study
←
→
Page content transcription
If your browser does not render page correctly, please read the page content below
Update to the Nontraditional Lamb Market in the
United States 2010 Study

AUGUST 2020
Julie Stepanek Shiflett, PhD
Prepared for the American Sheep Industry Association, Inc.
Executive Summary

There is an ongoing sentiment in the U.S. sheep industry that the animal inventory is greater than
that captured by federal and state lamb slaughter data. The belief is these “missing lambs” are
being diverted to nontraditional or ethnic marketing channels and are therefore are not being
captured in the post-lamb crop inventory and slaughter data. These lambs slaughtered in the
nontraditional market, are believed to be either slaughtered on farm or in custom-exempt slaughter
facilities, and not in federally-reported slaughter plants. The lambs that are channeled into ethnic
markets are characterized as being lightweight – less than 140 lbs. at slaughter, many about 100
lbs. – younger feeder lambs and hair sheep.

In 2010, the American Sheep Industry Association prepared the “Nontraditional Lamb Market in the
United States: Characteristics and Marketing Strategies” by Shiflett, et al. It was a broad look at
what was termed the nontraditional lamb market. The 2010 study found that about 1 million head of
lambs were missing each year, nearly one-half of federally inspected lamb slaughter. This was
calculated by taking the difference between the higher U.S. lamb crop (less some death losses)
and federally inspected sheep and lamb slaughter data. In 2020, 10 years later, it is time to revisit
the nontraditional lamb quantitative estimate. The U.S. sheep industry has experienced dynamic
changes that affect the nontraditional calculation. For example, the number of lambs slaughtered
by state and custom-exempt slaughter facilities nearly doubled from 2010 to 2019.

Two models were developed to estimate the number of lambs channeled into the nontraditional
market. The first model constrained lamb slaughter to the year of birth. This is how the 2010
estimate was modeled, and thus serves as a comparison. The second model relaxed the constraint
that lambs must be slaughtered in the year of their birth, revising the nontraditional lamb estimate
with the allowance for lambs to be slaughtered in the following year from the year of birth. Most
lambs are born in the spring but may be slaughtered later in the same year or early the following
year.

The first model, similar to the 2010 model, constraining slaughter to year of birth, found that the
number of lambs channeled to the nontraditional lamb market was reduced sharply as changing
market dynamics were incorporated into the model. During 2010 to 2019 the average
nontraditional estimate per year was 96,686 head. The revised model also revealed that in 2018
and 2019 the nontraditional volume was negative meaning the total lamb slaughter exceeded
available lamb inventory. The second model accommodating for different birth and slaughter years
produced very similar estimates to the model that constrained slaughter to the year of lamb birth. It
also concluded that the number or percentage of nontraditional or “disappearing lambs”, based on
data currently available, is significantly lower than estimates using the methodology described in
the 2010 study.

As the nontraditional estimate turned negative, it became evident that the opportunity to identify
“missing” lambs is challenged by survey methods and measurement error. It is important to
acknowledge the potential (and likely) impact of measurement error on any inferences and/or
conclusions drawn based on the U.S. Department of Agriculture National Agricultural Statistics
Service (NASS) data employed. The NASS Survey Procedures sampled large operations more
heavily than small operations. Lambs from these smaller operations are likely, to a large extent,
destined for the nontraditional type of markets.

In spite of uncertain data reliability, this research indicates that lambs that originally “fell through
the cracks” or were “missing” were being increasingly slaughtered in federal or state inspected
facilities. The growth of Halal slaughter facilities, the growth of smaller plants and the average
lower live weight at slaughter of lambs in non-federally inspected slaughter suggests that the

                                                                                                           1
industry might be developing into two distinct commercial markets, commercial lambs slaughtered
by the largest lamb packers with a live weight at slaughter over 140 lbs. and lightweight lambs
averaging 100 lbs., slaughtered primarily by state, and increasingly by federally inspected facilities.
This research recommends continued monitoring of NASS inventory data and state slaughter to
help design programs to promote U.S. lamb market growth.
2Contents
Introduction ..................................................................................................................................... 4
Overview of Nontraditional Lamb Market Literature ......................................................................... 6
Recent Sheep Industry Structural Changes ..................................................................................... 7
Capturing State Inspected Slaughter in Estimate ......................................................................... 8
Increase in Lighter Weight Slaughter Lambs .............................................................................. 11
Increased Lightweight Lambs within Carcass Trade .................................................................. 14
Revised Estimate of “Missing” Nontraditional Lambs ..................................................................... 14
Measurement Error ....................................................................................................................... 21
What’s Next ................................................................................................................................... 25
References .................................................................................................................................... 27
Appendix A – Data Charts ............................................................................................................. 28
Appendix B – Regional Federally Inspected Slaughter (FI), Region Breeding Ewe Inventory, and
Regional Lamb Crop ..................................................................................................................... 30
List of Tables
Table 1. Federally Inspected (FI) Lamb Plants .............................................................................. 11
Table 2. Nontraditional Lamb Volume Estimate, Number of Head ................................................. 19
Table 3. NASS 2020 Reliability of January Sheep and Lamb Estimates ........................................ 24
List of Figures
Figure 1. Lamb Slaughter Channel .................................................................................................. 4
Figure 2. U.S. Lamb Crop................................................................................................................ 9
Figure 3. Commercial and Federally Inspected (FI) Sheep and Lamb Slaughter ............................. 9
Figure 4. Commercial Slaughter less Federally Inspected (FI) Slaughter ...................................... 10
Figure 5. Percentage of Federally Inspected (FI) Slaughter of Commercial Slaughter ................... 10
Figure 6. January 1 U.S. Market Lambs Inventory ......................................................................... 12
Figure 7. Average Federally Inspected (FI) and Non-Federally Inspected (NFI) Sheep and Lamb
Weights ......................................................................................................................................... 13
Figure 8. Percent of Market Lambs by Weight ............................................................................... 13
Figure 9. Carcasses Weighing 55 lbs. and Less ............................................................................ 14
Figure 10. On Farm Lamb Slaughter ............................................................................................. 15
Figure 11. On Farm Slaughter as Percentage of Total Lamb Crop ................................................ 16
Figure 12. Percentage of Replacement Lambs in Total Lamb Crop ............................................... 16
Figure 13. Lamb Death Loss as Percentage of Total Lamb Crop .................................................. 17
Figure 14. Estimated Total Lambs Marketed and Commercial Lamb Slaughter ............................. 17
Figure 15. Revised Nontraditional Lamb Volume Estimate ............................................................ 18
Figure 16. Nontraditional Estimates: Model 1 vs. Model 2 ............................................................. 20
Figure 17. Percent Lamb Crop that could not be tracked through NASS Summary Data ............... 21
Figure 18. Percent of Operations by Flock Size ............................................................................. 22
3Introduction
An ongoing hypothesis in the U.S. sheep industry is that the number of lambs is greater than that
being captured in the federal and state lamb slaughter data. The theory is that these “missing
lambs” are being diverted to nontraditional or ethnic marketing channels and are therefore not
being captured in post-lamb crop inventory and slaughter data. Tighter lamb supplies reported by
the largest lamb packers helped fuel this theory.
This study is an interrogation of federal inventory and slaughter data and how the data describes
the U.S. lamb industry. The U.S. Department of Agriculture (USDA) National Agricultural Statistical
Service (NASS) reports four categories of slaughter lambs: commercial, federally inspected (FI),
non-federally inspected (NFI), and on farm. Federally inspected slaughter is meat inspection
required under the Federal Meat Inspection Act. These facilities employ a federal meat inspector to
inspect the livestock on slaughter days, and the meat can be sold. Non-federally inspected (NFI)
slaughter, as reported by NASS, includes state inspected slaughter from all states and includes all
custom-exempt slaughter from all states. State inspected slaughter is livestock that is slaughtered
and processed and can, with the proper licensing and labeling, be wholesaled or retailed within the
state (it may not be sold or shipped outside of state lines). For example, a livestock owner could
sell state inspected meat at a farmer's market or to a local restaurant. A custom exempt slaughter
facility is not inspected regularly by federal inspectors, but rather will be inspected by the state
departments of agriculture and USDA once or twice a year. The meat and meat products is
stamped "not for sale," and must go back to the owner of the livestock.
Commercial slaughter is the sum of FI and NFI slaughter. On farm slaughter is reported by
producers in annual surveys. This study tests whether an increasing share of lambs are either
slaughtered on farm or in custom-exempt slaughter facilities1 that are not captured by federal
reporting. These lambs are often characterized as being lighter weight, younger feeder lambs, and
hair sheep.
The farm to slaughter marketing channel directs lambs from the farm/ranch to federal, state, or on
farm slaughter, with the feeding complex finishing many lambs along the lamb supply channel.
However, we know from the 2010 NASS data investigation, there is also a volume of lamb that
appears to be missing, or unaccounted for in federal databases (Figure 1). This research
recalculates the “missing lambs” and determines whether nontraditional lambs have increasingly
been assimilated into traditional or commercial marketing channels.
Figure 1. Lamb Slaughter Channel
Market
Lamb
Supply
State inspected and
Federally-inspected On farm "Missing" Lambs,
custom-exempt
(FI) harvest harvest Nontraditional market
harvest (NFI)
1
Many lamb consumers, including those from ethnic backgrounds, prefer to select a lamb live when
choosing lamb. A buyer will select a lamb from a farm and then often slaughter the lamb onsite, which is
referred to as on farm slaughter. Custom-exempt slaughter is slaughter at facilities that process meat
exclusively for the owners’ use, and not to be sold, and are not inspected on a regular basis.
4This hypothesis of “missing” lambs was tested in 2010 to find a significant volume of nontraditional
lambs within the broader, traditional, or commercial market. Ten years later in 2020 this hypothesis
is revisited to determine whether the 2010 conclusions are still valid. The “Nontraditional Lamb
Market in the United States: Characteristics and Marketing Strategies” was prepared by Shiflett et
al. for the American Sheep Industry Association (ASI) in February 2010. In this study the
nontraditional volume was estimated through a survey of sheep producers, but also by calculating
the lambs unaccounted for in NASS data. The “missing”, or nontraditional lamb market is defined
as the quantity of lambs found in the discrepancy between the NASS-reported lamb crop and the
lower, NASS-reported slaughter numbers.
There is a sentiment among industry stakeholders that the 2010 methodology to estimate
nontraditional lambs is now outdated. The sheep and lamb industry has seen some dynamic
structural changes in the last ten years, in part, spurred by the growth in production of lightweight
smaller-framed wool and hair breeds. The relative proportion of state and custom slaughter has
increased relative to federally inspected slaughter, and slaughter of lightweight lambs has
increased within the carcass trade. Where the 2010 study was comprehensive and broad reaching,
this current research is more focused, aiming primarily at updating the volume of nontraditional
lamb supplies that are missing, or unaccounted for in the NASS data.
In the 2010 study it was projected that what was once counted as a parallel nontraditional market
would be increasingly assimilated into more commercial marketing channels and therefore would
be captured by federal inventory and slaughter lamb statistics. The American Lamb Board (ALB)
2018 “Seasonality of the U.S. Lamb Industry” supported this projection when it reported that over
time immigrant purchasing habits are expected to shift from nontraditional to more traditional
purchasing methods, and thus result in a decrease in lambs diverted into the nontraditional
market. This research thus queries federal data to determine the trend in “missing” lambs. The
specific research objectives are as follows:
1. Provide an overview of the 2010 nontraditional lamb market research.
2. Define how the 2010 nontraditional market volume is calculated.
3. Reevaluate the method of calculation of the ASI nontraditional lamb market volume. That
is, ensure that the ASI nontraditional definition adheres to current industry dynamics.
4. In revisiting the current nontraditional lamb volume estimation, define how NASS estimates
lamb and yearling commercial slaughter, federally inspected slaughter, state inspected
slaughter, custom slaughter, on farm slaughter, lamb crop, and ewe and ram inventory
with the understanding that NASS definitions and survey methods may affect the
nontraditional estimate.
5. Calculate how many lambs are currently “disappearing;” that is, are unaccounted for in the
USDA data through an analysis of the NASS data.
6. Explore the validity of the revised nontraditional lamb market estimate.
5Overview of Nontraditional Lamb Market Literature
In February 2010, ASI published the “Nontraditional Lamb Market in the United States:
Characteristics and Marketing Strategies” prepared by Shiflett, Williams and Rodgers. The report
was broad-based in capturing nontraditional estimates by surveying various industry stakeholders.
The study estimated the ethnic market sales volume by the top lamb packers including Halal,
Kosher, and other custom, ethnic slaughter. The study also estimated marketing volume and
characteristics of nontraditional sales at the two largest sheep auctions in San Angelo, Texas and
New Holland, Pennsylvania. In addition, the research estimated direct sales by sheep producers to
nontraditional lamb buyers. The study also conducted a survey of lamb consumption by minority
consumers, by estimating the incidence of lamb consumption among a surveyed profile of minority,
or foreign speaking, consumers.
From the 2010 study:
There is a growing sentiment that the nontraditional lamb market is siphoning off an
increasing portion of the commercial slaughter-lamb market away from traditional retail and
foodservice sectors. The nontraditional market may thus slow the ability of the commercial
lamb market to increase supplies and production in a time of sheep inventory contractions.
Yet the volume of sheep marketed to the nontraditional market is largely unknown.
This research was motivated, in part, by the discovery that there is a large statistical
difference between the U.S. Department of Agriculture (USDA)-published lamb crop (plus
losses) and USDA federally inspected slaughter numbers. Between 2004 and 2008, this
difference was estimated at nearly 1.2 million head per year, 48 percent of FI slaughter or
2.5 million head per year. This research proposes to define, quantify, and predict the growth
of the nontraditional lamb market in the United States.
This research utilized a multi-prong survey approach to meet its research objectives given a
hypothesis that the market is fragmented and heterogeneous. Informal phone surveys were
used to interview the marketing managers at the top lamb packers as well as number of
select smaller ethnic packers. Informal phone surveys were also used to interview U.S.
Department of Agriculture market reporters that report on sheep and lamb auctions.
A formal producer survey was also implemented to estimate the volume of the
nontraditional market at the farm gate, determine the ethnicity of consumers that buy direct
from the farm and determine what motivates producers and buyers to engage in direct
marketing. Producers were contacted via e-mail as well as through the American Sheep
Industry Association newsletter, Sheep Industry News. The survey resulted in 488
responses from a distribution to 20,467 producers.
The research also conducted an online survey to a select group of minority or ethnic
consumers. Non-Hispanic White consumers were omitted from the study unless they spoke
a pre-identified foreign language at home. A total of 410 consumers responded that they
had eaten lamb, mutton, or goat in the past year out of a total 878 consumers surveyed.
In sum, the 2010 report estimated the volume of nontraditional lamb sales through two separate
methods. The first was the statistical discrepancy of the NASS lamb crop less slaughter data. The
nontraditional volume estimate was computed by calculating the numeric difference between the
USDA federally inspected lamb and mature sheep slaughter numbers and the USDA estimated
lamb crop (less 5 percent for losses). It was found that the lamb crop numbers historically
exceeded the FI slaughter numbers by a wide margin, and this discrepancy was called
6nontraditional slaughter, for it was hypothesized that this volume wasn’t captured in USDA data,
and therefore “fell through the cracks.” This “missing” volume was an estimated at 1.2 million head
per year between 2004 and 2008, or the equivalent of 48 percent of the 2.5 million head per year
processed through federally inspected plants.
The second nontraditional estimate was developed through a sheep producer survey in 2009 that
asked producers their perception of the purpose of the sales to individual buyers. The survey was
nationally representative of sheep producers across the U.S. Producers were asked to choose
among the following: the buyer buys for personal/family use; the buyer buys for a slaughterhouse
or packer; the buyer buys for one or more restaurants; the buyer buys for more one more grocery
stores; the buyer buys for packers, restaurants, and grocery stores; don’t know; or other. The
producer selection that “the buyer buys for personal/family use” is what defined the nontraditional
estimate due to the assumption that many lambs consumed for personal or family use are
slaughtered on farm or in custom-exempt slaughter facilitates that are not necessarily captured by
state and thus federal reporting.
The survey asked producers how may lambs were sold for personal or family use to each
demographic group of buyers including Hispanic/Latino, Middle Eastern, White/Caucasian,
Unknown, or Other in 2009. On average, survey results revealed that producers sold an average of
21 lambs through the year ending November 2009 for customers’ personal, or family use. Most
lambs were sold to buyers of an unknown ethnicity followed by Muslim buyers.
For each known ethnicity, the average number of lambs sold was multiplied by the percent of sales
to personal/family use to get a subtotal of nontraditional lambs sold to a given ethnicity. The lambs
were then totaled across each ethnicity to arrive at the estimated number of nontraditional lambs.
In sum, the nontraditional estimate represented the total number of lambs sold by lamb producers
for customers for personal/family use. This volume totaled 995,370 head in 2009. The authors
viewed this estimate as a validation of the 1.2 million head calculated using USDA data.
Recent Sheep Industry Structural Changes
The sheep and lamb industry has seen some dynamic structural changes in the last ten years, in
part, spurred by the growth in production of lightweight smaller-framed wool and hair breeds, which
warrants an update to the methodology applied in the 2010 nontraditional study.
In 2010, a standardized formula for calculating the nontraditional, “missing” lambs was developed
that would be applicable year-after-year to analyze trends in the market. It has since been
recognized that annual adjustments to the nontraditional formula are warranted to capture changes
more accurately in the U.S. nontraditional market. There are additional industry-specific
characteristics such as the inclusion of on farm slaughter and the addition of replacement lambs
and a recalibration of the death loss estimate – characteristics not captured in the 2010 model --
that also warrant a revised nontraditional estimate.
The revision to the methodology applied includes the following:
▪ State inspected slaughter
▪ Lamb and yearling slaughter separate from mature sheep slaughter
▪ Include replacement lambs
▪ Include on farm slaughter
▪ Allow death loss to adjust annually
7Capturing State Inspected Slaughter in Estimate
It is hypothesized that as the slaughter of lightweight lambs increased in recent years, the number
of lightweight lambs slaughtered in state inspected slaughter plants increased relative to those
slaughtered in federally inspected (FI) slaughter facilities. The 2010 nontraditional estimate used FI
slaughter data. An important revision of this nontraditional market estimate is to include state
inspected slaughter, or non-federally inspected (NFI) slaughter.
Research revealed that as the number of head captured by NFI slaughter grows, it is critical to use
commercial slaughter (FI and NFI slaughter data) in the nontraditional estimate. Most sheep and
lambs are slaughtered in federally inspected facilities. However, NASS also collects the numbers of
lamb slaughtered in state inspected, and custom-exempt facilitates, known as non-federally
inspected slaughter. FI slaughter averaged 92 percent of commercial slaughter for the 2000-2019
period, while the remaining 8 percent is slaughtered by state inspected facilities.
The threshold for counting sheep at FI plants is one head. That is, NASS includes any sheep
slaughtered at FI facilities in its slaughter count. In 2019, 521 FI plants reported at least one head
of sheep slaughtered. The threshold for NFI facilities is also one head. NFI plants are not required
by law to report, but state inspected facilities report to their state departments of agriculture and
NASS reports that it has a good response rate for custom-exempt facilities.2 NASS statisticians use
a non-response adjustment to account for missing facilities.
The U.S. sheep and lamb industry has contracted in recent decades and thus the lamb packing
subsector has seen many changes. Large lamb plants in Texas and Iowa have gone out of
business.3 It is believed smaller lamb plants have thrived in other parts of the country, driven, in-
part, by ethnic lamb demand. When Superior Farms closed its lamb plant in Hawarden, Iowa in
May 2011 it was commonly believed that it did not have sufficient slaughter numbers to continue to
operate efficiently. The nontraditional lamb market was partly to blame, siphoning off lambs that
otherwise would be channeled into one of the industry’s largest lamb processing plants, and
creating a short supply of lamb. Superior spokeswoman Angela Gentry said, "At the moment, we're
not getting enough lambs to even get half of the capacity of the plant," (Dreeszen, D., 2011). The
plant had a capacity to slaughter up to 240,000 lambs annually (over 4,000 head per week).
In January 2020, ewe inventory totaled 2.98 million head, down 4 percent in 5 years, down 7
percent in 10 years, and down 30 percent in the 20 years since 2000. As ewe numbers contracted,
the lamb crop followed (Figure 2). In 2019, the lamb crop was 3.23 million head, down 2 percent in
5 years, down 10 percent in 10 years and down 30 percent since 2000.4
2
Personal communication, Agricultural Statistician, U.S. Department of Agriculture, National Agricultural
Statistics Service, 5/6/20.
3 As of July 31, 2020 Mountain States Rosen – the 2nd largest lamb plant in the U.S. – was expected to
cease operations at its Greeley, Colorado plant.
4 Given that sheep often have multiple births, it is not expected that ewe and lamb crop inventory have a one-
to-one decrease, but a consistent pattern is expected. The unexpected trends in inventory of ewes and lamb
crop gives rise to questions regarding NASS survey methods, a point covered later in the report.
8Figure 2. U.S. Lamb Crop
It follows that as the lamb crop contracts, fewer lambs are slaughtered and reported by NASS. In
general, both commercial and FI slaughter have declined over time (Figure 3), but the proportion of
NFI, or state slaughter in the total commercial slaughter, has increased. In 2019, commercial
slaughter (NFI and FI) totaled 2.32 million head, up 4 percent in five years and down 6 percent in
ten years. In 2019, FI slaughter was 2.02 million head, up 1 percent in five years and down 11
percent in ten years in 2010 to 2019.
Figure 3. Commercial and Federally Inspected (FI) Sheep and Lamb Slaughter
The difference between commercial and FI slaughter was 301,300 head in 2019, which was up 34
percent from 2015 and up 53 percent from the 2000-2010 period (Figure 4).
9Figure 4. Commercial Slaughter less Federally Inspected (FI) Slaughter
In the early 2000s, FI slaughter represented about 94 percent of commercial slaughter, but
declined to 87 percent by 2019 (Figure 5). This reveals that an increasing share of sheep and
lambs are being slaughtered in state inspected facilities. More and more lambs were being
captured in federal livestock reporting efforts outside of FI slaughter data. The increased evidence
in state inspected slaughter could, in part, reflect a growth in commercial, state inspected Halal
slaughter, but unfortunately the data is not available at this time to substantiate this theory.
Figure 5. Percentage of Federally Inspected (FI) Slaughter of Commercial Slaughter
Coincidentally, as the ethnic lamb market has expanded in the U.S., the proportion of smaller
packing plants has grown in the U.S.5 From 2005 to 2019, the number of small to mid-sized FI
plants increased while the larger FI plants declined in number. The smallest plants, slaughtering
5
NASS does not keep records of plant sizes of state-inspected facilities.
10less than 200 head per week (up to 999 head annually), increased from 2005 to 2018 by 4 percent
(Table 1). These plants slaughtered 28 percent more lambs and sheep in this period. By contrast,
the largest plants (slaughtering 250,000 head per year) contracted by 25 percent and slaughtered
42 percent fewer head over 2005 to 2018. Plants – sized between the largest and smallest –
processed 30 to 78 percent more lambs over 2005 to 2018.
Table 1. Federally Inspected (FI) Lamb Plants
2005-18 Percent
2005 2010 2016 2018
Change
No. of No. of Head No. of Head No. of Head No. of Head No. of Head
Head plants (thousands) plants (thousands) plants (thousands) plants (thousands) plants (thousands)
1-999 420 50.1 413 58.3 430 63 438 64 4% 28%
1,000-
59 212.7 73 232 80 288.2 73 276.5 24% 30%
9,999
10,000-
7 125.3 12 193.2 12 184.5 13 213.5 86% 70%
24,900
25,000-
4 155 3 183.2 5 224.8 8 276.1 100% 78%
99,999
100,000-
2 308.3 1 155.6 1 164.7 1 178.2 -50% -42%
249,999
250,000+ 4 1703 4 1438.8 3 1084.4 3 991.5 -25% -42%
Source: USDA/NASS, 2005, 2010, 2016, 2018
Another dynamic structural change that is occurring in the U.S. lamb industry is that there are
contemporaneous regions of live animal inventory contractions and pockets of growth. In general,
lamb slaughter in the Mountain states has declined in recent years while slaughter has increased
across the Northwest, Midwest, Northeast and Southeast. Unfortunately, the location of plants
needed to compare slaughter growth to inventory growth is unknown.
As sheep inventory expanded in some regions, and costs per head in the marketing channel came
down, plant sizes likely grew and thus more likely came under the radar of state or FI inspection
and reporting. A working hypothesis is that the nontraditional lambs that were initially calculated as
“missing” would be assimilated over time by state and FI slaughter. However, as will be shown
later, the “missing” data in the initial nontraditional quantitative estimate cannot be explained solely
by actual missing lambs that were slaughtered outside of state and FI plants, but by structural
industry dynamics that have become more significant over time.
Increase in Lighter Weight Slaughter Lambs
Two parallel lamb markets exist in the U.S., the traditional commercial lamb market, and a smaller
market, comprising of lighter-weight lambs. The existence and growth of this lightweight lamb
market is an indicator of the importance of using state inspected slaughter data in the
nontraditional estimate.
In 2020, the number of market lambs in the U.S. totaled 1.31 million head, up 2 percent from five
years earlier, down 1 percent over the last ten years and down 30 percent since 2000 (Figure 6).
Market lambs are reported on January 1 of each year as reported by sheep producers. It is not a
tally of total number of lambs slaughtered or marketed each year (which is about 2 million head).
We know that during the year more market lambs enter the system as the year progresses given
the bulk of lambs are born in the spring. What this data does give us though is a snapshot of
11marketed lambs by live weight. Although total numbers of lambs marketed is down, the weight
distribution of marketed lambs has shifted over time.
Figure 6. January 1 U.S. Market Lambs Inventory
The ethnic or hair-lamb market is popularly believed to favor lightweight lambs compared to the
more traditional commercial market. From the ALB seasonality white paper (2018):
The traditional market prefers a 120 to 160 lb. live weight lamb. Most of these lambs are
sold off the ranch as feeder lambs and sent to a feeding facility for 50 to 150 days. The
lambs are slaughtered at a large commercial slaughter plant and sold to retail or
foodservice outlets as primal or further-processed cuts. The nontraditional market prefers a
50 to 100 lb. live weight lamb. Most of these lambs are sold off the farm or ranch as
slaughter lambs.
However, the ethnic or lightweight lamb market may be changing as it grows. It is hypothesized
that many hair sheep in the ethnic trade are increasingly slaughtered above 100 lbs. The USDA
Agriculture Market Service (AMS) has coined the livestock auction of New Holland Sales Stable, in
New Holland, Pennsylvania as a “nontraditional” market.6 AMS reports many hair lambs selling
over 100 lbs. at New Holland. Reportedly, an estimated 35 percent of lambs selling out of the New
Holland auction are sold at 90 to 150 lbs.7 Most of these lambs weighed 90 to 110 lbs.8
Overall, the 100-150 lbs. hair sheep weight sees a lot of volume at New Holland, but most hair
sheep slaughter lambs fall in the 100-115 lbs. range. The auction also sees smaller-framed wool
breeds including Cheviot and Southdown/Babydolls. By comparison, the slaughter lamb wool
breeds consistently sell at 100 to 150 lbs.
The distinct differences in average live weight at slaughter between FI and NFI plants also
illustrates the importance of tracking state inspected data (Figure 7). The live weight at slaughter at
6 New Holland is likely the second largest lamb auction market after Producers Livestock Auction in San
Angelo, Texas.
7 Email correspondence with AMS reporter at the New Holland Sales Stable, 2019.
8 Within this spread, 10 percent were sold in the 110 to 130 lbs. range. Only 1 percent sold at 130-150 lbs.
12FI plants was an average 138 lbs. between 2000 and 2019 while the average NFI slaughter weight
was 104 lbs.
Figure 7. Average Federally Inspected (FI) and Non-Federally Inspected (NFI) Sheep and
Lamb Weights
160
150
140
130
120
Lbs.
110
100
90
80
70
NFI Slaughter FI Slaughter
Source: USDA/NASS
It is hypothesized that as the ethnic lamb market has grown, average slaughter weight has
increased. According to NASS Census data, in the years 2000 to 2020, the percentage of market
lambs weighing 105 lbs. and heavier increased from around 30 percent to 38 percent (Figure 8).
Figure 8. Percent of Market Lambs by Weight
Other weight classes have either remained relatively steady or declined. It is theorized that as the
nontraditional lamb market matures, the average live weight at harvest of hair sheep breeds and
lower-weight maturing wool breeds increased to above 105 lbs.
13Increased Lightweight Lambs within Carcass Trade
The share of lightweight lambs in the carcass trade is another indicator that the industry has
transitioned to increased slaughter of lightweight maturing lambs. The number of carcasses traded
has declined sharply in the last 10 years from about 20 percent of total FI slaughter to about 5 to
10 percent in 2019. It is theorized that the largest commercial lamb packers are processing fewer
carcasses while the smaller packers still sell carcasses. In the past 10 years, the share of
carcasses weighing 55 lbs. and less increased from 7 percent to 10 percent of total carcasses
(Figure 9).
Figure 9. Carcasses Weighing 55 lbs. and Less
Revised Estimate of “Missing” Nontraditional Lambs
This study presents a revised nontraditional lamb market estimate, an estimate that is dynamic to
industry changes and more accurately mirrors available industry inventory and slaughter data.
Graphs of key inventory and slaughter lamb data and trends are available in Appendix A.
Structural industry changes include:
▪ Growth in on farm slaughter,
▪ Growth in the number of replacement lambs,
▪ Adjustments in lamb death rate,
▪ Differentiation between lamb and yearling slaughter and mature sheep slaughter, and
▪ Inclusion of both federally inspected and state inspected slaughtered lambs (discussed in
previous section),
Capture lamb and yearling slaughter separate from mature sheep slaughter
The 2010 study referenced FI slaughter which combines lamb and yearling slaughter and mature
sheep slaughter. The revised methodology endeavors to differentiate between lamb and yearling
slaughter and mature sheep slaughter by assuming and applying the same relative percentages of
lamb and yearling slaughter and mature sheep slaughter reported for FI slaughter to commercial
14slaughter – and by extension, to state inspected slaughter.
NASS breaks down FI slaughter into lamb and yearling FI slaughter and mature sheep FI
slaughter. Using the portion of lamb and yearling FI slaughter in total FI slaughter allows for the
revised model to account for lambs and yearlings only, separate from the smaller, mature sheep
market. On average, lambs and yearling account for about 96 percent of total FI slaughter. This
percentage of lambs and yearlings in total FI slaughter was used to estimate the lamb portion of
NFI slaughter. The same proportion was used to estimate the number of lambs in the on farm
slaughter volume.
Inclusion of on farm slaughter
When first studied in 2010, on farm slaughter was considered inconsequential to the final
nontraditional calculation and thus not included; however, on farm slaughter has since grown (and
contracted) which warrants a closer look at its inclusion in estimating the size of the nontraditional
model. The revised methodology includes an estimate of farm slaughter as reported by NASS (on
farm slaughter for personal consumption). The farm slaughter estimate again assumes the same
relative percentages of lamb and yearling slaughter and mature sheep slaughter reported for FI
slaughter. From 2010 to 2019, the on farm lamb slaughter contracted by 3 percent to 86,310 head
(Figure 10). On farm lamb slaughter peaked in 2017 before falling in 2018 and 2019. In 2017,
slaughter lamb prices in the traditional, commercial market were relatively high, so perhaps buyers
believed they could get a more competitive price in buying lambs on farms and slaughtering them
on farm.
Figure 10. On Farm Lamb Slaughter
The number of lambs slaughtered on farm – as captured from NASS producer surveys –
accounted for 1.6 percent of the total annual lamb crop (less lamb deaths) from 2000 to 2004. This
percentage increased to nearly 2.5 percent from 2010 to 2019 (Figure 11).
15Figure 11. On Farm Slaughter as Percentage of Total Lamb Crop
Growth in share of replacement lambs
Lambs retained as replacements – from the NASS producer surveys – were included in the revised
nontraditional calculation. The inclusion of replacement lambs in the calculation had the greatest
impact on enhancing the number of “missing” lambs. Between 2000 and 2014 the share of
replacement lambs in the total lamb crop (less lamb deaths) was 18.3 percent and gained over 4
percent to 20 percent from 2015 to 2019 (Figure 12). As prices strengthened, particularly in 2017,
producers retained a greater percentage of lambs back for flock rebuilding.
Figure 12. Percentage of Replacement Lambs in Total Lamb Crop
Adjustable lamb death loss
The 2010 study assumed a constant lamb death loss of 5 percent. The revised methodology
utilized annual lamb death loss estimates reported by NASS, which averaged 11 percent over the
2000-2019 range, – approximately double the death loss estimate applied in the 2010 study. By
162019, the death rate among lambs had reached nearly 12 percent of the total lamb crop (Figure
13).
Figure 13. Lamb Death Loss as Percentage of Total Lamb Crop
Figure 14 depicts the total estimated number of lambs marketed and the estimated commercial
lamb slaughter. The estimated number of lambs marketed (also called market lamb inventory) was
calculated by subtracting the lamb death loss, replacement lambs,9 and on farm lamb slaughter
from the total lamb crop. The estimated commercial slaughter is calculated by summing together
the FI lamb and yearling slaughter and the lamb portion of state inspected slaughter and custom-
exempt slaughter (NFI slaughter).
Figure 14. Estimated Total Lambs Marketed and Commercial Lamb Slaughter
9NASS reported replacement lambs for January 1, 2020 are actually replacement lambs for 2019, so the
data was lagged one year. The 2020 replacement data was entered in the spreadsheet for the revised
nontraditional calculation as 2019 replacement lambs.
17The revised nontraditional lamb market volume estimate is contained in Figure 15 and Table 2. It is
calculated as the numeric difference between the assumed higher net lamb crop inventory and the
expected lower lamb slaughter. The revised nontraditional estimate is sharply lower than the 2010
calculation. In 2000 to 2009, the average annual nontraditional estimate was 133,000 head per
year and between 2010 and 2019 it averaged 97,000 head per year. This is down from an
estimated 1.2 million head per year from the 2010 study. At a maximum, the nontraditional, or
“missing” lambs were an estimated 351,000 head in 2011. This calculation method yielded a
negative volume of 94,000 head in 2019.
Figure 15. Revised Nontraditional Lamb Volume Estimate
In 2018 and 2019, the total number of lambs marketed was less than the number slaughtered
which produced a negative nontraditional estimate. The total number of lambs marketed declined
by 0.4 percent in 2018 and then increased 0.4 percent in 2019. However, the total lambs
slaughtered jumped 4 percent in 2018 and then an additional 2 percent in 2019. Data
measurement errors may account for the calculation that the number of lambs slaughtered
exceeded those available to market. This hypothesis will be explored further later in this study.
Both the replacement rate and on farm slaughter – both not previously included in the
nontraditional estimate – accounted for 700,000 to 800,000 head in recent years, comprising about
75 percent of the “missing” nontraditional lambs. The most significant revision to the current
nontraditional estimate is the inclusion of replacement lambs in the revised calculation.
Replacement lambs averaged 719,000 head from 2000 to 2009 and 657,800 head during 2010 to
2019. As the lamb crop contracted over time, replacement lambs grew from about 16 percent of
the lamb crop in the early 2000s to 20 percent by 2019. On farm slaughter averaged about 1
percent of the total lamb crop in 2000 to 2009, and 2 percent during 2010 to 2019. These
replacement lambs could be diverted to the slaughter channel if the producer changed their mind
after the report survey was submitted due to market or production factors.
The allowance for an annual adjustable death rate, rather than a fixed death loss as in the original
2010 study accounted for some of the reduction in the revised nontraditional estimate. Overall, the
death loss grew from about 10 percent of the lamb crop in 2000 to 12 percent by 2019.
18Table 2. Nontraditional Lamb Volume Estimate, Number of Head
Nontraditional/
INVENTORY SLAUGHTER "Missing"
NFI
Lamb Lambs FI Lambs Lambs
Lamb Death Replacement on farm Total and and Total
Crop Losses Lambs slaughter Inventory Yearlings Yearlings Slaughter Total
2000 4,645,000 490,200 679,000 65,991 3,409,809 3,141,000 143,852 3,284,852 124,957
2001 4,519,500 474,800 732,000 62,334 3,250,366 2,921,300 149,734 3,071,034 179,332
2002 4,355,000 428,800 703,000 62,746 3,160,454 2,944,300 184,715 3,129,015 31,439
2003 4,035,000 395,300 704,500 68,514 2,866,686 2,662,000 164,738 2,826,738 39,948
2004 4,040,000 385,000 783,000 69,455 2,802,545 2,529,000 154,029 2,683,029 119,517
2005 4,015,000 384,700 786,000 71,109 2,773,191 2,425,100 136,141 2,561,241 211,950
2006 3,950,000 400,100 734,500 76,008 2,739,392 2,429,000 144,481 2,573,481 165,911
2007 3,895,000 426,000 697,000 80,637 2,691,363 2,413,100 157,552 2,570,652 120,711
2008 3,710,000 416,000 646,500 87,200 2,560,300 2,271,100 153,716 2,424,816 135,484
2009 3,690,000 400,000 655,000 88,733 2,546,267 2,165,300 179,704 2,345,004 201,263
2010 3,570,000 370,000 665,000 88,712 2,446,288 2,104,800 182,824 2,287,624 158,664
2011 3,490,000 380,000 660,000 86,644 2,363,356 1,859,500 152,557 2,012,057 351,299
2012 3,445,000 365,000 670,000 85,926 2,324,074 1,869,100 158,661 2,027,761 296,313
2013 3,345,000 360,000 635,000 87,657 2,262,343 1,987,600 186,188 2,173,788 88,555
2014 3,335,000 365,000 650,000 88,375 2,231,625 1,968,200 191,807 2,160,007 71,617
2015 3,290,000 374,000 665,000 89,708 2,161,292 1,885,100 212,338 2,097,438 63,854
2016 3,265,000 373,000 666,000 89,701 2,136,299 1,901,500 215,925 2,117,425 18,875
2017 3,230,000 367,000 662,000 91,055 2,109,945 1,835,500 228,253 2,063,753 46,192
2018 3,235,000 388,000 650,000 87,281 2,109,719 1,893,100 251,050 2,144,150 -34,431
2019 3,230,000 388,000 660,000 86,301 2,095,699 1,905,600 284,180 2,189,780 -94,081
Note: Replacement lambs lagged on year. Replacement lambs reported Jan. 1, 2020 for 2019 replacements.
Source: All data sourced from USDA/NASS.
Accommodating for Differences in Birth Year and Slaughter Year
The 2010 study implicitly assumed that lambs were born and slaughtered in the same calendar
year. The first nontraditional model in this study made the same assumption. However, this is not
always the case and warrants the need to assess whether allowing lambs to be slaughtered either
in the same calendar year that they were born, or the following calendar year significantly affects
the nontraditional estimate. Relaxing the constraint that lambs are born and slaughtered in the
same year will also test validity of the nontraditional estimate in the previous section.
Most lambs in the U.S. are born in the spring and remain on pasture throughout the summer and
early fall.10 These lambs may not be slaughtered until the first quarter of the following year. This is
because many lambs are maintained on a slow or constant growth rate after weaning to target
specific production dates. Many lambs are thus pastured to slow their rate of gain and are then
sent to feedlots at around 10 to 12 months of age which would be early the following year. Feedlots
serve to manage supply and therefore spring-born lambs may be placed on feed in the fall and not
slaughtered until the following calendar year – particularly if targeting the spring holiday market
including Passover, Western Easter, Greek Orthodox Easter, and Muslim holidays which fall on
different dates each year. Adapting the model to a more realistic lambing/slaughter sequencing
may better reflect the impact of seasonal lambing patterns and feedlot placements on slaughter
lamb availability.
10
There are areas of the U.S. where fall lambing occurs.
19To calculate the nontraditional lamb supply estimate, total lamb slaughter is subtracted from total
lamb availability by producers. The assumption is the inventory of lambs available is larger than
that captured by state and federal slaughter reports. To relax the constraint that all lambs must be
born and slaughtered in the birth year, a revised calculation was developed. The revision allows all
lambs available in the current year or year x to be slaughtered in year x, but also in the following
year. On average, the NASS data indicate that approximately 46 percent of market lambs are
slaughtered in the same year they were born (range: 40 to 51 percent) and 54 percent are
slaughtered the following calendar year (range: 49 to 60 percent).
The supply of nontraditional lambs is estimated as follows: the total lamb crop in year x, less the
death loss, replacement lambs, on farm slaughter and the third and fourth quarter lamb slaughter
(FI and NFI) in year x, less lamb and yearling slaughter for the first and second quarters of the
following year (year x+1). The model is as follows:
Total lamb cropx – on farm slaughter of lambsx – replacement lambsx – lamb death lossx –
lamb/yearling slaughter third quarterx – lamb/yearling slaughter fourth quarterx –
lamb/yearling slaughter first quarterx+1 – lamb/yearling slaughter second quarterx+1.
The revised nontraditional supply estimate and the adjusted estimate taking into account
differences in birth and slaughter years are very similar (Figure 16). At most, the estimates differ by
169,000 head and at a minimum, 16,000 head. Both estimates revealed an inversion in 2018 and
2019, whereby the lamb slaughter number exceeded the number of available market lambs, or
inventory.
Figure 16. Nontraditional Estimates: Model 1 vs. Model 2
A t test of the two estimated series – accounting for the differences in birth and slaughter year, and
constraining slaughter to birth year – revealed that one cannot reject the null hypothesis that the
means of the two series are equal.11 Thus, the observed difference between the sample means of
11 The F test of two sample variances could not reject the null hypothesis of equal variances. A two tailed t
test assuming equal variances was thus estimated to find a two-tailed p-value of 0.34 which is higher than
the standard significance level of 0.05. Therefore, one cannot reject the null hypothesis, the observed
differences between the means is not enough to say that the average annual nontraditional estimate
between Model 1 and Model 2 differ significantly. Normal distribution was assumed for both series.
20the two models is not sufficient enough to say that the two methods differ significantly. Therefore,
the nontraditional volume estimate accommodating for a different slaughter year than birth year,
while factually accurate, does not make a significant difference to the revised nontraditional
estimate. This is important because constraining slaughter to birth year (while not practiced in the
industry) facilitates a current year estimate of the nontraditional market.
A Look Back: How the Revised Estimate Differs
Figure 17 contains the percentage of annual lamb crop that could not be accounted for based on
the NASS slaughter data using the 2010 study methodology with FI slaughter and the revised
methodology. To have a common basis for comparison, lambs that could not be tracked using
each methodology are shown in the figure below as a percentage of the annual lamb crop. Across
the extended 2000-2019 range, on average, approximately 31 and 3 percent of the annual lamb
crop could not be tracked of the two methods, respectively.
Measurement Error
It is important to acknowledge the potential (and likely) impact of measurement error on any
inferences and/or conclusions drawn based on the NASS data employed. The revised
nontraditional estimate produced a negative number whereby lamb slaughter exceeded calculated
lamb availability, or inventory. This finding gave rise to an investigation into NASS data collection
methods. The annual NASS Sheep and Goat Reports provide information about the statistical
methodology used, including survey procedures and reliability.
Figure 17. Percent Lamb Crop that could not be tracked through NASS Summary Data
From the NASS Sheep & Goat Report 2020:
Survey Procedures: A random sample of United States operations was surveyed to
provide data for these estimates. Survey procedures ensured that all sheep and goat
operations, regardless of size, had a chance to be included in the survey. Large operations
were sampled more heavily than small operations. About 21,600 operators were contacted
during the first half of January by mail, telephone and face-to-face personal interview and
66 percent of the reports were usable.
21The sampling of large operations more heavily than small operations could suggest the possibility
that smaller sheep producers are underrepresented in the NASS survey of inventory (lamb crop,
on farm slaughter, replacement lambs, and lamb death loss), and hence the nontraditional
estimate. NASS does not publish the inventory breakdown of the 21,600 operators in the January
Sheep and Goat Report. It is assumed that smaller sheep producers are more likely to sell lambs
into nontraditional markets that are not captured in the federally or state inspected slaughter data.
It is also possible that some small, newer producers have not been identified by NASS and asked
to respond to the annual inventory survey.
The USDA Animal and Plant Health Inspection Service Veterinary Services (APHIS- VS) found that
20 percent of small (20-99 head) and 12 percent of medium-sized (100-499 head) operations “sold
directly to consumer or ethnic market” in 2010 (APHIS, 2012:15). By comparison, only 5 percent of
the larger flocks (500 or more head) directly sold to consumers or ethnic market.
In 2009, APHIS found that 93 percent of all U.S. sheep operations had 1-99 head of breeding
sheep. Another 6 percent had 200-499 head and a total of 1 percent operations had over 500 head
(AHPIS, 2012:150). In 2015, a survey of producers by the American Sheep Industry Association
revealed that 73 percent of U.S. sheep operations had 1-100 ewes (ASI, 2016) (Figure 18). Nine
percent of operations had 500+ ewes according to ASI.
Figure 18. Percent of Operations by Flock Size
The two sources above of operations by flock size represent different survey methods and thus
should not be compared to establish a trend over time. It is unlikely that the sheep industry went
from 1 percent of producers having 500+ ewes in 2009 to nearly 10 percent of producers having
500+ head in 2015. It is possible that the APHIS numbers skew toward the smaller flocks and the
ASI data skew toward the larger ones.
The NASS regional breeding ewe and lamb crop data reveal that while Mountain and West regions
are contracting in inventory, there are pockets of growth across Texas, parts of the Midwest and
East and Southeast. However, regionally where the inventory shows growth is not necessarily
mirrored in regional FI slaughter data. This suggests that there are pockets of inventory growth that
are “missing” and not captured in NASS slaughter data. For example, in 2015-2019 the lamb crop
grew 23 percent or 7,000 head (after accounting for death loss and replacement rates) in Region 1,
22the Northeast,12 but FI slaughter data only captured 16 percent of this growth, or 5,300 head. It is
possible, however, that the lambs were slaughtered in other areas, such as in New York and New
Jersey.
A recent Cornell University study reveals that perhaps the supply of lambs for slaughter/processing
by producers exceeds the demand by slaughter plants in New England. In 2019 Cornell published
The State of the USDA Inspected Red Meat Slaughter and Processing Industry in New York and
New England.13 The general conclusion is that lamb slaughter and processing is not as profitable
as other species, such as cattle and hogs. “Respondents stated that lambs are inconsistent to
slaughter, and (they) have decreased the slaughter and processing of lambs in order to increase
the slaughter and processing numbers of other livestock that bring in more revenue,” (2019:10).
“The survey found that 87.8 percent of plants would slaughter and process more lambs if the lambs
were brought in shorn and clean,” (2019:10). A parallel concern that adds costs to lamb processing
is that there was no market for lambskins resulting in their disposal as waste. “Plants are turning
away business in the busy months due lack of cooler space and labor constraints,” (2019:15). The
survey found that between 2016 and 2017 the surveyed livestock plants in New England
processed 849 fewer head of lambs, or down 1 percent. In the same period, cattle numbers were
up 318 head and hog numbers were up 3,491 head.
Another example of potential mismatched data is in the regional reported slaughter data for Region
6 which includes Texas and New Mexico.14 From 2015 to 2019 the lamb crop grew by 18,000
head, however regional slaughter numbers only reflected a 5,500 head gain during this time. It is
believed that lambs from this region are slaughtered, but not necessarily captured in the state and
federal slaughter numbers.15 It is possible that many lambs are transported out of the region to the
East and Southeast for slaughter.
In another example, while the lamb crop in Region 2 (New York and New Jersey) was down 3,000
head in 2015-2019, FI slaughter was up 42,400 head in this same period. Appendix B lists the
Regional FI slaughter, lamb crop, and breeding ewe data. The number of live sheep imported from
Canada increased 114 percent between 2015 and 2019, which might explain some of the uptick in
New York and New Jersey slaughter numbers. These sheep are primarily slaughter lambs which is
believed to be the reason for the difference.
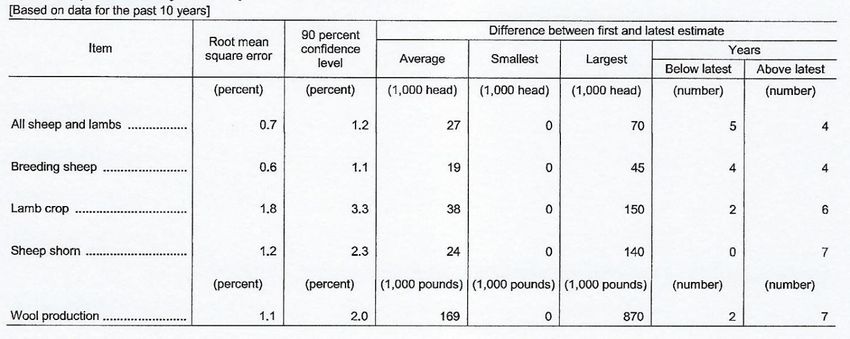
The following paragraphs and “Reliability Table” (Table 3) were excerpted from the NASS 2020
Sheep and Goat Report.
12
Region 1 includes New England (CT, ME, NH, VT, MA, RI).
13 The research surveyed 52 livestock slaughter and processing plants in New England in 2017.
14 Region 6 includes Texas, New Mexico, Arkansas, and Louisiana; however, state data was not published
for Arkansas and Louisiana and therefore could not be added to the regional total. NASS reports that all
states receive surveys for the annual sheep producer survey, so it is unclear to why individual state totals are
not published for each state.
15 An additional concern is whether what is anecdotally called “bird” slaughter – custom-exempt facilities that
primarily slaughter poultry but will reportedly also slaughter lambs – is lamb slaughter that is reported to the
state.
23You can also read