Upfield plant-based spreads and margarine vs. dairy butter - Life Cycle Assessment Technical Summary
←
→
Page content transcription
If your browser does not render page correctly, please read the page content below
Upfield
plant-based spreads
and margarine
vs. dairy butter

Life Cycle Assessment Technical Summary

March 2020
Version 1

              PLANT-BASED SPREADS AND MARGARINE VS. DAIRY BUTTER. LCA TECHNICAL SUMMARY   1
LIFE CYCLE ASSESMENT …….…….…….…….…….…….…….…….…….…….…….…….…….…….…….…….. 3
METHOD …….…….…….…….…….…….…….…….…….…….…….…….…….…….…….…….…….…….…….…... 3
CRITICAL REVIEW …….…….…….…….…….…….…….…….…….…….…….…….…….…….…….…….…….…….3
FUNCTIONAL UNIT ………….…….…….…….…….…….…….…….…….…….…….…….…….…….…….……….. 3
ENVIRONMENTAL IMPACT INDICATORS CONSIDERED ……….…….…….…….…….…….…….…..….. 3
FROM FARM-TO-PLATE ……..…….…….…….…….…….…….…….…….…….…….…….…….…….…….…….. 4
DATA COLLECTION AND MODELLING………….…….…….…….…….…….…….…….…….…….…….……... 4
RESULTS AND DISCUSSION …….…….…….…….…….…….…….…….…….…….…….…….…….…….……….. 5
CLIMATE CHANGE IMPACTS ………….…….…….…….…….…….…….…….…….…….…….…….…….……... 5
FRESHWATER CONSUMPTION ……….…….…….…….…….…….…….…….…….…….…….…….………..….. 6
LAND OCCUPATION ………….…….…….…….…….…….…….…….…….…….…….…….…….…….…….…….... 6
LCA CONCLUSIONS AND OUTLOOK ………….…….…….…….…….…….…….…….…….…….…….………... 7
CALCULATION OF EQUIVALENCIES ………….…….…….…….…….…….…….…….…….…….…….………... 8
ABOUT QUANTIS ………….…….…….…….…….…….…….…….…….…….…….…….…….…….…….…….…….. 9
REFERENCES ……….…….…….…….…….…….…….…….…….…….…….…….…….…….…….…….…….……….. 9
PLANT-BASED SPREADS AND MARGARINE VS. DAIRY BUTTER. LCA TECHNICAL SUMMARY 2In 2018 Quantis conducted a Life Cycle Assessment (LCA) of Upfield’s plant-based spreads and margarines in 21
European and North American markets. These products were compared to dairy butter sold in the same markets. This
document provides a short summary of the scope of the LCA, the methodology used, what is included in the study and
how the calculations were performed to achieve the results, the results for the average Upfield’s plant-based spreads
and margarines and dairy butter and the methodology and sources used to calculate the equivalences for the
comparative claims.
LIFE CYCLE ASSESMENT
LCA is a science based methodology used to assess environmental impacts resulting from for example, greenhouse gas
emissions, waste production, water, land and energy use. Environmental impacts are calculated over the life cycle of a
product, from extraction of raw materials to the end-of-life.
METHOD
For the study, a framework for conducting a large scale regionalised LCA was developed and applied to compare the
environmental impacts of 212 plant-based fat spreads, 16 plant-based creams and 40 dairy alternatives sold in 21
countries, per kg of product. Data was collected with a cradle-to-grave approach for the different product recipes, key
ingredients sourcing countries, production factory locations, energy mixes, packaging designs, transportation and end-
of-life scenarios. Spatially (archetype) differentiated agricultural life cycle inventory data were generated, as well as
land use change (LUC) emissions for agricultural ingredients. A total of 18 environmental indicators were assessed.
The LCA compares environmental impacts of Upfield’s plant-based products and dairy butter and creams using an
attributional approach as per PAS 2050 (BSI, 2012), aligning with the latest international standards for dairy products,
published by the International Dairy Federation (IDF, 2015) and the European Dairy Association (EDA, 2016).
CRITICAL REVIEW
The LCA respects the ISO 14040 and 14044 standards for public disclosure of results. The LCA was peer reviewed by an
independent panel of three independent experts on topics such as LCA, agronomy and dairy production, and has been
published in the International Journal of Life Cycle Assessment.
FUNCTIONAL UNIT
The functional unit (FU) is a reference unit for which all results are calculated and presented. The functional unit of the
study was:
• For the dairy butter vs plant-based fat spreads, the functional unit (FU) was 1 kg of product (fresh matter) for
spreading, baking or shallow frying, at consumer’s home.
• For the dairy cream vs plant-based cream comparison, the FU was 1 kg product (fresh matter) for whipping
or cooking, at consumer level.
ENVIRONMENTAL IMPACT INDICATORS CONSIDERED
The assessment includes 15 environmental impact indicators from the European ILCD 2011 Midpoint+ v1.08 impact
assessment method (JRC-IES 2011).
Three additional indicators were included: land occupation (m2.y), which reflects the total area of land used over one
year and is a proxy for biodiversity and ecosystem services (Nemecek et al. 2011, Milà i Canals et al. 2012), water
consumption (m3), the total amount of fresh water consumed (ISO 14046), which includes, for example,
evapotranspiration from irrigation water, and water scarcity footprint (m3 water equivalent (eq)) based on the AWARE
approach that assesses the water deprivation potential considering spatial water scarcity differences (Boulay et al.
2017).
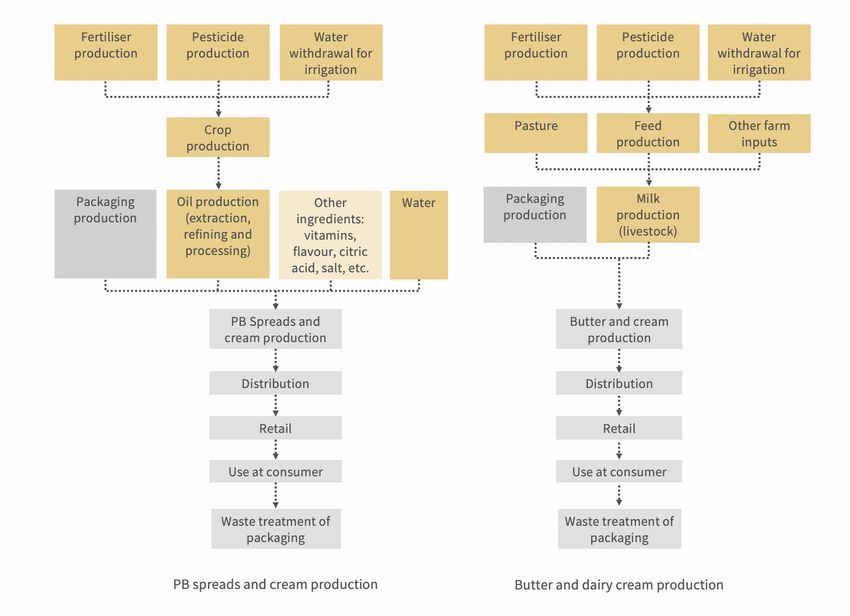
PLANT-BASED SPREADS AND MARGARINE VS. DAIRY BUTTER. LCA TECHNICAL SUMMARY 3FROM FARM-TO-PLATE
The LCA considers all identifiable activities across the product life cycle (cradle-to-grave) for all products in the 21
markets where they are sold (see Figure 1).
The study includes the impacts from:
• farming (crop production or milk production)
• production of plant-based spreads and margarine or dairy butter or creams
• packaging
• distribution
• retail
• consumption
• waste management of packaging
Figure 1. Schematic of the systems evaluated
The study does not include the impacts from:
• Capital goods at the distribution centre and at the point of retail.
• Labour, commuting of workers, administrative work, cattle insemination and disease control processes.
• Food loss and food waste during distribution, at retail point and at the consumer’s home.
DATA COLLECTION AND MODELLING
• Plant-based spreads and margarine: Primary data on the recipes and ingredient sources for plant-based
spreads and margarine were provided by Upfield. A range of life cycle inventory databases was used to
model crop production, oil processing and raw milk production in all markets relevant to each system’s
supply chain.
The LCA modelling tool SimaPro version 8.3 was used to model individual datasets (such as oilseeds and
packaging) required for plant-based products and for the life cycle of dairy products. Data from all life cycle
stages of plant-based spreads and margarine were aggregated and assessed in a customized modular Excel
model to enable efficient sensitivity and uncertainty analyses for the large portfolio of product scenarios in
this study.
PLANT-BASED SPREADS AND MARGARINE VS. DAIRY BUTTER. LCA TECHNICAL SUMMARY 4• Dairy butter: Default data representative of North American and European averages and published by the
USDA, FIL-IDF Canada, European Dairy Association and the European Commission were used to model dairy
processing, packaging and distribution. All data has been assessed to ensure that it meets the quality
standards required to make comparative assertions.
RESULTS AND DISCUSSION
All plant-based spreads and margarine had a significantly lower climate impact than dairy butter, with and without
land use change (LUC) inclusion. The regionalised analysis highlighted large variabilities across products, ranging from
0.98 to 6.93 (mean 3.3) kg CO2-eq for 212 plant-based spreads and margarine and 8.08 to 16.93 (mean 12.1) kg CO2-
eq for 21 dairy butter with 95th confidence interval. The main drivers of GHG emissions for plant-based products are
oilseed farming and the associated LUC emissions, which can vary significantly depending on the type of oilseed,
quantity and sourcing country; in the worst-case scenario, the climate advantage is no longer valid due to LUC. Thus,
the inclusion of LUC is essential for a robust assessment and hotspot identification. Overall, the risk of shifting impacts
was small, as most of the plant-based spreads and margarine also had lower impacts for the water scarcity footprint
and land occupation; 8 of the 212 products were not lower, due to oilseed ingredients with high embodied impacts.
CLIMATE CHANGE IMPACTS
Table 1 shows overall that plant-based spreads and margarine (mean: 3.1 kg CO2-eq) in the 21 markets studied have
lower climate change impacts than dairy butter (mean:12.1 kg CO2-eq), however, Figure 5 shows the regionalized LCA
results highlighted large variabilities on the individual product level, driven by difference in product recipe design and
spatial variabilities of sourcing ingredients.
Plant-based spreads and
margarine Dairy butter GWP difference
Country GWP (kg CO2-eq/kg) GWP (kg CO2-eq/kg) kg CO2-eq/kg %
Austria 3.66 13.64 9.98 -73%
Belgium 3.61 12.74 9.13 -72%
Canada 2.23 11.06 8.83 -80%
Switzerland 2.93 12.38 9.45 -76%
Czech Republic 3.23 11.96 8.73 -73%
Germany 2.96 12.68 9.72 -77%
Denmark 3.05 9.87 6.82 -69%
Spain 4.57 14.47 9.90 -68%
Finland 3.2 9.45 6.25 -66%
France 3.71 12.28 8.57 -70%
Greece 3.43 14.20 10.77 -76%
Hungary 2.96 10.43 7.47 -72%
Ireland 3.06 11.77 8.71 -74%
Netherlands 3.24 12.23 8.99 -74%
Poland 2.78 13.12 10.34 -79%
Portugal 4.2 14.47 10.27 -71%
Romania 2.37 10.86 8.49 -78%
Sweden 2.91 10.07 7.16 -71%
Slovakia 3.01 12.06 9.05 -75%
United Kingdom 2.99 12.37 9.38 -76%
United States 3.09 12.05 8.96 -74%
21 Markets 3.14 12.10 8.96 -74%
Table 1. Greenhouse gas emissions (climate footprint) for plant-based spreads and margarine and dairy butter and creams in
the 21 markets. Results are expressed in kg CO2eq per kg of product.
PLANT-BASED SPREADS AND MARGARINE VS. DAIRY BUTTER. LCA TECHNICAL SUMMARY 5FRESHWATER CONSUMPTION
For freshwater consumption and water scarcity results, there are high variabilities across product recipes and markets
(Table 2). Overall, for plant-based spreads and margarine, differences are driven by yield and irrigation of crops and
orchards. Plant-based spreads and margarine generally have a lower water consumption with a few exceptions; dairy
butter in Ireland, for example, has a lower water consumption, due to embedded variabilities of dairy farming systems,
influenced by different herd structures, feed intake compositions and manure management systems. The dairy
farming systems in Ireland have a relatively higher proportion of pasture, hay, silage, haylage and agricultural residues
rather than grains and concentrated feed.
Plant-based spreads and Dairy butter and
margarine creams WC difference
Country WC (m3 water /kg) WC (m3 water /kg) (m3 water /kg) %
Austria 0.06 0.12 0.06 -51%
Belgium 0.06 0.12 0.06 -47%
Canada 0.17 0.33 0.16 -49%
Switzerland 0.06 0.16 0.10 -64%
Czech Republic 0.03 0.12 0.09 -76%
Germany 0.06 0.13 0.08 -58%
Denmark 0.08 0.16 0.09 -53%
Spain 0.07 0.10 0.03 -33%
Finland 0.06 0.21 0.15 -70%
France 0.07 0.09 0.02 -27%
Greece 0.07 0.15 0.09 -57%
Hungary 0.03 0.10 0.07 -68%
Ireland 0.06 0.05 -0.01 24%
Netherlands 0.06 0.11 0.05 -45%
Poland 0.03 0.09 0.06 -68%
Portugal 0.08 0.11 0.03 -28%
Romania 0.02 0.06 0.04 -65%
Sweden 0.05 0.14 0.10 -69%
Slovakia 0.03 0.12 0.09 -77%
United Kingdom 0.07 0.10 0.04 -35%
United States 0.02 0.24 0.22 -90%
21 Markets 0.05 0.15 0.10 -65%
Table 2. Freshwater consumption for plant-based spreads and margarine and dairy butter and creams in the 21
markets. Results are expressed in m3 of water per kg of product.
LAND OCCUPATION
In terms of land occupation, there are some overlaps between plant-based spreads and margarine and dairy butter if
the constraints of consumer countries are ignored. However, in the respective consumer markets, most plant-based
spreads and margarine (211 of the 212) have lower impacts compared to dairy butter (Table 3).
Overall, when comparing plant-based spreads and margarine and dairy butter products, there is little risk of shifting
climate impacts to water and land related impacts, however, special attention should be paid to agricultural
ingredients from regions with high embodied land occupation or water scarcity footprints. There are opportunities for
further reducing the environmental impacts of plant-based fat spreads by, for example, adapting product recipes,
opting for alternative agricultural oilseeds ingredients and/or adapting sourcing countries to avoid deforestation or
other land use change related climate risks. Meanwhile, it is important to consider potential constraints, such as the
PLANT-BASED SPREADS AND MARGARINE VS. DAIRY BUTTER. LCA TECHNICAL SUMMARY 6choice of oils based on consumer preferences (taste, nutritional benefits and product function, e.g. harder fats are
used for products in warmer climates).
Plant-based spreads and Dairy butter and
margarine creams LO difference
Country LO ( m2.y /kg) LO ( m2.y /kg) ( m2.y /kg) %
Austria 3.59 12.40 8.81 -71%
Belgium 4.72 11.43 6.71 -59%
Canada 7.57 11.14 3.57 -32%
Switzerland 2.98 11.53 8.55 -74%
Czech Republic 3.63 10.44 6.82 -65%
Germany 2.97 10.76 7.78 -72%
Denmark 4.38 8.70 4.32 -50%
Spain 5.40 13.93 8.53 -61%
Finland 4.84 9.14 4.30 -47%
France 3.74 11.17 7.44 -67%
Greece 3.26 12.90 9.64 -75%
Hungary 3.30 9.79 6.49 -66%
Ireland 4.51 13.34 8.82 -66%
Netherlands 4.05 9.87 5.82 -59%
Poland 3.15 20.11 16.97 -84%
Portugal 4.08 15.88 11.79 -74%
Romania 2.62 25.50 22.88 -90%
Sweden 3.84 9.64 5.79 -60%
Slovakia 3.30 15.01 11.71 -78%
United Kingdom 4.48 10.60 6.12 -58%
United States 2.93 11.77 8.85 -75%
21 Markets 3.73 11.89 8.16 -69%
Table 3. Land occupation for plant-based spreads and margarine and dairy butter and creams in the 21 markets.
Results are expressed inm2 per year per kg of product.
LCA CONCLUSIONS AND OUTLOOK
The regionalized LCA conducted in this study is the largest scale regionalized agricultural LCA comparing dairy butter
and plant-based spreads and margarine published to date. It shows that plant-based spreads and margarine have lower
climate, water and land impacts than dairy butter, despite variability in product recipes and geographies and influence
of LUC emissions. For climate change, the assessment shows all plant-based spreads and margarine perform better than
dairy butter regardless of the choice of functional unit (mass-based or fat-based), inclusion of LUC, or allocation
approach of oilseeds. It also shows that LUC of oilseed ingredients could dominate climate impacts for plant-based
spreads and margarine (Figure 2); further, the hypothetical worst-case sourcing scenario (i.e. with the worst
combination of oilseed type and sourcing country) performs worse than dairy butter for climate impact, due to LUC
associated with growing oilseed ingredients. Thus, inclusion of spatial LUC emissions is important for robust assessment
and hotspot identification when taking steps towards mitigating the climate impacts of food products. With respect to
land occupation and water scarcity, most plant-based spreads and margarine had lower impacts compared to dairy
butter in their respective consumer markets, with only a few exceptions (8 of 212 products) which contained oilseed
ingredients with high embodied impacts, caused by either very low yield or very high water demand from growing in
high water stressed regions.
When moving towards transparency of sustainable supply chains and developing potential mitigation strategies,
producers can only understand the impacts of their products and look for opportunities to reduce these impacts if they
PLANT-BASED SPREADS AND MARGARINE VS. DAIRY BUTTER. LCA TECHNICAL SUMMARY 7fully and accurately assess their product supply chains. The regionalized LCA highlights significant interindividual
variabilities on the product level for plant-based spreads and margarine, driven by differences in product recipe designs
and spatial variabilities of sourcing ingredients.
The framework introduced and demonstrated in this study offers opportunities for hotspot identification as well as
insights for improving the sustainability of a large portfolio of products. For example, towards more sustainable plant-
based spreads and margarine, a key factor would be to reduce embodied environmental impacts from oilseed
ingredients through better understanding and improvements in supply chain sourcing, farm level agricultural practice,
and product recipe design. The key challenges of performing large scale regionalized LCA lies in the collection and
organization of all relevant data and models, performing gap assessment and prioritization, developing missing data or
improving data quality, and linking inventory data with impact assessment, to draw robust conclusions and meet
requirements for data quality.
The application of the methodology framework in this study demonstrated the feasibility of conducting large-scale
regionalised LCA for agri-food products. This principle is also relevant for other product type evaluations and this study
offers stepwise guidance. We believe it will contribute to the operationalisation of regionalised LCA in practice
towards identifying inter-product variabilities as well as highlighting hotspots for improving transparency and
sustainability of product supply chains.
Figure 2. Climate change results per stage of life cycle per 1 kg of product
** CO2-eq emission per kg of dairy butter by farm activity: Enteric emissions: 4.54 kg; Manure management: 1.64 kg; Pasture feed: 0.41 kg2; Pasture
peat degradation: 0.32 kg; Feed fodder: 2.23 kg; Fodder land use change: 1.23 kg; other farm activities: 0.81 kg.
The average enteric emissions account for 38% for the dairy butter carbon footprint of the 21 markets, with variabilities ranging from 32-48% for each
country market, respectively.
CALCULATION OF EQUIVALENCIES
Using the results of the analysis and other data sources, Quantis made the calculation of equivalencies to put in
perspective the results of the greenhouse gas emissions, land occupation and water consumption of plant-based
spreads and margarine and dairy butter to make information more meaningful and understandable for a larger
audience.
In the equivalencies, the country weighted average results for plant-based spread and margarine are calculated based
on the market share of different products, provided by Upfield. The “21 market” weighted for plant-based spreads and
margarine and dairy butter are calculated by multiplying the weighted country average carbon footprint, water
consumption and land occupation by the market share derived from the 2018 dairy butter production data (Eurostat1,
USDA2 and Canadian dairy Information Center3) for respective countries.
The equivalency calculations are derived using the following data sources:
PLANT-BASED SPREADS AND MARGARINE VS. DAIRY BUTTER. LCA TECHNICAL SUMMARY 8Equivalency Equivalency Explanation Source
Unit
Dairy butter - Average dairy butter consumption in kg per capita https://www.statista.com/statistics/415277/butter-
consumption per consumption-per-capita-by-country-europe/
person
Smartphone 0.008 Charging an average smartphone overnight https://www.zdnet.com/article/heres-how-much-it-costs-to-
charging Kg CO2-eq charge-a-smartphone-for-a-year/
https://slate.com/technology/2012/03/is-charging-your-cell-
phone-overnight-a-major-waste-of-energy.html
Plastic bottles 0.1 500 ml PET bottle (full life cycle, from production to end ecoinvent v3.4
saved Kg CO2-eq of life)
Km driven in a 0.25 Emissions from driving an average internal combustion ecoinvent v3.4
petrol car Kg CO2-eq engine gas-powered car (tailpipe)
Annual Carbon Kg CO2 Average per capita carbon footprint by country. It Cite as: Updated from Peters et al. (2012) and Peters et al.
footprint of a per capital includes both territorial accounting and consumption- (2011)
person carbon based accounting. Published by the GCP (global carbon project) team.
Cup of coffee 0.1 Full life cycle assessment of 1 Lungo cup of portioned WFLDB + Ecoinvent
Kg CO2-eq coffee made with a capsule
Flight 0.275 Air travel, per passenger, life cycle footprint ecoinvent & IPCC2013
Kg CO2-eq
Grilled beef burger 2.5 Full LCA of a ready-to-eat grilled beef burger patty RegletteFood_2019-09-19
patty Kg CO2-eq
1
Eurostat https://ec.europa.eu/eurostat/databrowser/view/tag00038/default/table?lang=en (accessed January 31st, 20202)
2
USDA https://www.ers.usda.gov/webdocs/DataFiles/48685/Dairyglance.xlsx?v=1337.1 (accessed January 31st, 20202)
3
Canadian Dairy Information Center https://aimis-simia-cdic-ccil.agr.gc.ca/rp/index-eng.cfm?action=pR&pdctc=&r=261#wb-cont (accessed
January 31st, 20202)
DO YOU WANT TO KNOW MORE ABOUT THE STUDY?
Read the complete study published by The International Journal of Life Cycle Assessment and get more detailed
information at: https://link.springer.com/article/10.1007/s11367-019-01703-w
ABOUT QUANTIS
Quantis guides top organizations to define, shape and implement intelligent environmental
sustainability solutions. In a nutshell, our creative geeks take the latest science and make it
actionable. They deliver resilient strategies, robust metrics, useful tools, and credible
communications.
With offices in the US, France, Switzerland, Germany, Italy and Colombia and clients around
the world, Quantis is a key partner in inspiring sustainable change on a global scale.
(re)discover Quantis at www.quantis-intl.com
PLANT-BASED SPREADS AND MARGARINE VS. DAIRY BUTTER. LCA TECHNICAL SUMMARY 9REFERENCES
Blonk Agri-footprint BV (2015) Agri-footprint - Part 2 - Description of data. Gouda, the Netherland
Boulay A-M et al (2018) The WULCA consensus characterization model for water scarcity footprints: assessing impacts of
water consumption based on available water remaining (AWARE). Int J Life Cycle Assess 23:368–378
Cederberg C, Stadig M (2003) System expansion and allocation in life cycle assessment of milk and beef production. Int J Life
Cycle Assess 8:350–356
De Schryver A, Galatola M, Kerkhof A-M (2016) Guidance for modelling transport from factory to client in PEFCRs. Issue
paper, v0.1, June 2016. European Commission DG-Environment. Brussels, Belgium
DFC 2012. Environmental and Socioeconomic Life Cycle Assessment of Canadian Milk. Dairy Farmers of Canada. Montreal,
Canada.
Durlinger B, Tyszler M, Scholten J, et al (2014) Agri-Footprint; a Life Cycle Inventory database covering food and feed
production and processing. In: Proceedings of the 9th International Conference on Life Cycle Assessment in the Agri-Food
Sector. pp 310–317
EDA (2016) Product Environmental Footprint Category Rules for Dairy Products. Draft report (28 July 2016). The European
Dairy Association. Brussels, Belgium
Ekvall T, Tillman A-M (1997) Open-loop recycling: Criteria for allocation procedures. Int J Life Cycle Assess 2:155
Eurostat database. URL: https://ec.europa.eu/eurostat/data/database Access June 2016
FAO (2010) Greenhouse gas emissions from the dairy sector - a life cycle assessment. Animal Production and Health Division,
Food and Agriculture Organization of the United Nations. Online, Rome
FAO and WHO. 2011. Codex Alimentarius – Milk and Milk Products. Second edition. The Food and Agriculture Organization of
the United Nations and the World Health Organisation. Rome, Italy
FAO, IDF, IFCN 2014. World mapping of animal feeding systems in the dairy sector. Food and Agriculture Organisation of the
United Nations, the International Dairy Federation, the IFCN Dairy Research Network. Rome, Italy
FAOSTAT (2006-2011) Vegetable oil production and import volumes. //faostat.fao.org/. Accessed Nov 2016
FEFAC (2016) Product Environmental Footprint Category Rules for Feed for Food Producing Animals. Draft report v1.5 (22
July 2016). The European Feed Manufacturers' Federation. Brussels, Belgium
Gerber P, Vellinga T, Opio C, et al (2010) Greenhouse Gas Emissions from the Dairy Sector, A Life Cycle Assessment. FAO
Food and Agriculture Organisation of the United Nations. Animal Production and Health Division, Rome
Gonzalez Fischer C, Garnett T (2016) Plates, pyramids, planet. FAO and the Environmental Change Institute & The Oxford
Martin Programme on the Future of Food, The University of Oxford
Humbert S, Guignard C (2015) PEF / OEF: Default data to be used to model distribution and storage. Issue paper, v2.1,
December 2016. European Commission DG-Environment, Brussels
IDF (2015) A common carbon footprint approach for Dairy. The IDF guide to standard life cycle assessment methodology for
the dairy sector. International Dairy Federation. Brussels, Belgium
IPCC (2006) IPCC guidelines for national greenhouse gas inventories. Volume 4: Agriculture, forestry and other land use. IGES,
Kanagawa, Japan
PLANT-BASED SPREADS AND MARGARINE VS. DAIRY BUTTER. LCA TECHNICAL SUMMARY 10ISO (2006) Environmental management – life cycle assessment – requirements and guidelines, ISO 14044:2006(E).
International Organization for Standardization, Geneva
JRC-IES (2011). International Reference Life Cycle Data System (ILCD) Handbook- Recommendations for Life Cycle Impact
Assessment in the European context. First edition November 2011. European Commission-Joint Research Centre - Institute
for Environment and Sustainability. Publications Office of the European Union, Luxemburg
Kounina A, Margni M, Henderson AD, Jolliet O (2018) Global spatial analysis of toxic emissions to freshwater:
operationalization for LCA. Int J Life Cycle Assess 1–17.
LEAP (2015) Environmental performance of animal feeds supply chains: Guidelines for assessment. Livestock Environmental
Assessment and Performance Partnership. The Food and Agriculture Organization of the United Nations (FAO), Rome, Italy
McGuire S (2016) Scientific Report of the 2015 Dietary Guidelines Advisory Committee. Washington, DC: US Departments of
Agriculture and Health and Human Services, 2015. Adv Nutr 7:202–204
Mutel C, Liao X, Patouillard L, et al (2018) Overview and recommendations for regionalized life cycle impact assessment. Int J
Life Cycle Assess. doi: 10.1007/s11367-018-1539-4
Nemecek T., Bengoa X., Lansche J., Mouron P., Riedener E., Rossi V. & Humbert S. (2015) Methodological Guidelines for the
Life Cycle Inventory of Agricultural Products. Version 3.0, July 2015. World Food LCA Database (WFLDB)
O’Brien D, Capper JL, Garnsworthy PC, et al (2014) A case study of the carbon footprint of milk from high-performing
confinement and grass-based dairy farms. J Dairy Sci 97:1835–1851
Peano L, Bengoa X, Humbert S, et al (2012) The World Food LCA Database project: towards more accurate food datasets. In:
Proceedings 2nd LCA conference
Quantis 2016. ALCIG - Agricultural Life Cycle Inventory Generator. https://alcig.quantis-software.com Accessed 2019 July 9th
Schau EM, Palomino J-A, Michalopoulos G, Russo C (2016) Product environmental footprint category rules for olive oil – 3rd
Draft. Draft version 0.5. URL:
http://ec.europa.eu/environment/eussd/smgp/pdf/pilots/draft_pefcr_olive_oil_pilot_for_3rd_consultation.pdf. Accessed
June 10th, 2017
Thoma G, Popp J, Nutter D, et al (2013) Greenhouse gas emissions from milk production and consumption in the United
States: A cradle-to-grave life cycle assessment circa 2008. Int Dairy J 31:S3–S14. doi: 10.1016/j.idairyj.2012.08.013
US EPA. 2015. Advancing Sustainable Materials Management: Facts and Figures 2013 – Assessing Trends in Metrial
Generation, Recycling and Disposal in the United States. U.S. Environmental Protection Agency.
Weidema BP, Bauer C, Hischier R, et al (2013) Overview and methodology: Data quality guideline for the ecoinvent database
version 3
Wickham H (2016). ggplot2: Elegant Graphics for Data Analysis. Springer-Verlag New York. ISBN 978-3-319-24277-4
Willett W, Rockström J, Loken B, et al (2019) Food in the Anthropocene: the EAT–Lancet Commission on healthy diets from
sustainable food systems. The Lancet. doi: 10.1016/S0140-6736(18)31788-4
PLANT-BASED SPREADS AND MARGARINE VS. DAIRY BUTTER. LCA TECHNICAL SUMMARY 11You can also read