Upper Connecticut River Direct Tributaries Basin 16 Tactical Basin Plan
←
→
Page content transcription
If your browser does not render page correctly, please read the page content below
Upper Connecticut River Direct
                                        Tributaries
                                        Basin 16 Tactical Basin Plan

                                                                                         Connecticut River, Maidstone Vermont

                           January 2021 | Draft for Management Review

Tactical Basin Plan was prepared in accordance with 10 VSA § 1253(d), the Vermont Water Quality Standards 1, the Federal Clean Water
                            Act and 40 CFR 130.6, and the Vermont Surface Water Management Strategy.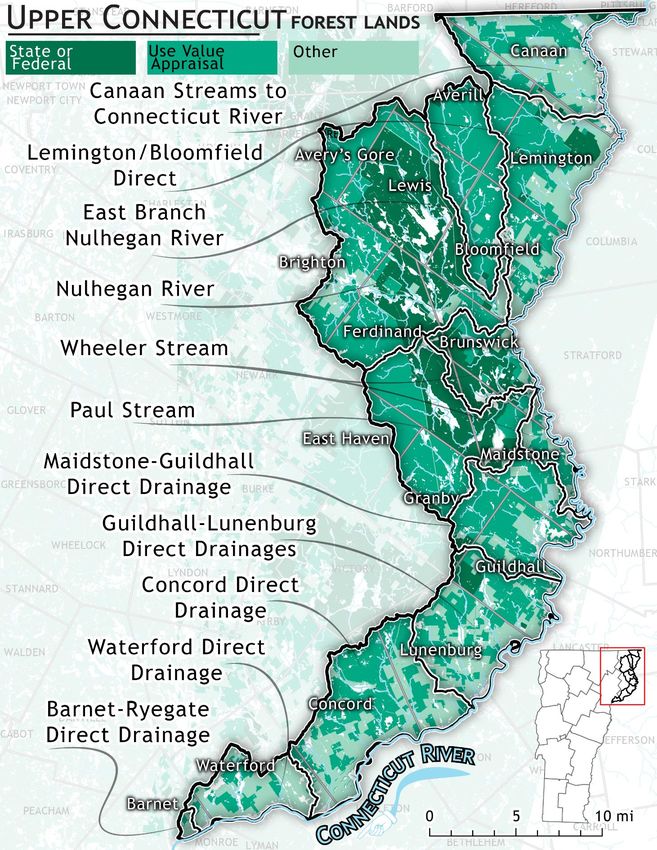
Tributaries – Basin 16
                                2020 TACTICAL BASIN PL

Plan prepared by: Ben Copans

GIS & Mapping support: Sean Regalado & Phillip Jones

Cover Photo: Ben Copans

The Vermont Agency of Natural Resources is an equal opportunity agency and offers all persons the benefits
of participating in each of its programs and competing in all areas of employment regardless of race, color,
religion, sex, national origin, age, disability, sexual preference, or other non-merit factors.

This document is available in alternative formats upon request.

Call 802-828-1535

VT Relay Service for the Hearing Impaired

1-800-253-0191 TDD>Voice - 1-800-253-0195 Voice>TDD

 BASIN 16 – UPPER CONNECTICUT RIVER BASIN PLAN – DRAFT FOR PUBLIC REVEIW                                       i
List of Basin 16 Towns
Averill                  Brunswick                Granby                   Maidstone
Avery’s Gore             Canaan                   Guildhall                Waterford
Barnet                   Concord                  Lemington
Bloomfield               East Haven               Lewis
Brighton                 Ferdinand                Lunenburg
               Basin 16 Watershed Boundary and Towns

 BASIN 16 – UPPER CONNECTICUT RIVER BASIN PLAN – DRAFT FOR PUBLIC REVEIW               iii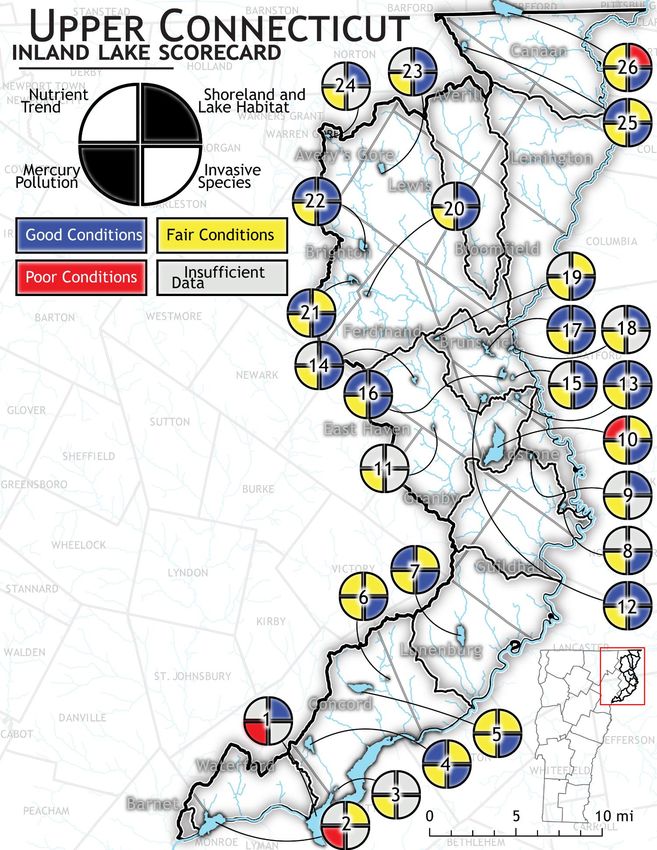
Basin 16 Tactical Plan Overview

Contents
Executive Summary......................................................................................................................... 1
What is a Tactical Basin Plan? ......................................................................................................... 4
Chapter 1 – Basin Description and Conditions ............................................................................... 6
  A. Basin 16 Overview ................................................................................................................... 6
   B. Water Quality Conditions in Basin 16 ..................................................................................... 9
Chapter 2 – Priority Areas for Surface Water Protection ............................................................. 17
  A. Surface Water Classification ................................................................................................. 19
   B. Class I Wetland Designation .................................................................................................. 24
   C. Warm- and Cold-Water Fish Habitat Designations ............................................................... 25
   D. Outstanding Resource Waters Designation .......................................................................... 25
   E. Identification of Existing Uses ............................................................................................... 26
Chapter 3 – Priority Areas for Surface Water Restoration ........................................................... 26
  A. Stressed or Impaired Surface Waters ................................................................................... 26
   B. Basin Specific Total Maximum Daily Loads (TMDLs) ............................................................. 29
Chapter 4 – Strategies to Address Pollution by Source Sector ..................................................... 33
  A. Agriculture............................................................................................................................. 34
   B. Developed Lands ................................................................................................................... 39
   C. Wastewater ........................................................................................................................... 44
   D. Natural Resources ................................................................................................................. 47
Chapter 5 – The Basin 16 Implementation Table ......................................................................... 60
  A. Progress in Basin 16 .............................................................................................................. 60
   B. Coordination of Watershed Partners .................................................................................... 60
   C. Basin 16 Implementation Table ............................................................................................ 61
   D. Basin 16 Monitoring and Assessment Table ......................................................................... 68
List of Acronyms ............................................................................................................................ 71
References .................................................................................................................................... 73
Appendix A. 2014 Basin 15/16 TBP Status Update ....................................................................... 77
Appendix B. Existing Use Tables ................................................................................................... 82
Appendix C. Dams in Basin 16....................................................................................................... 83
Appendix D. Municipal Water Quality Protectiveness Table for Basin 16 ................................... 86

 BASIN 16 – UPPER CONNECTICUT RIVER BASIN PLAN – DRAFT FOR PUBLIC REVEIW                                                                             iv
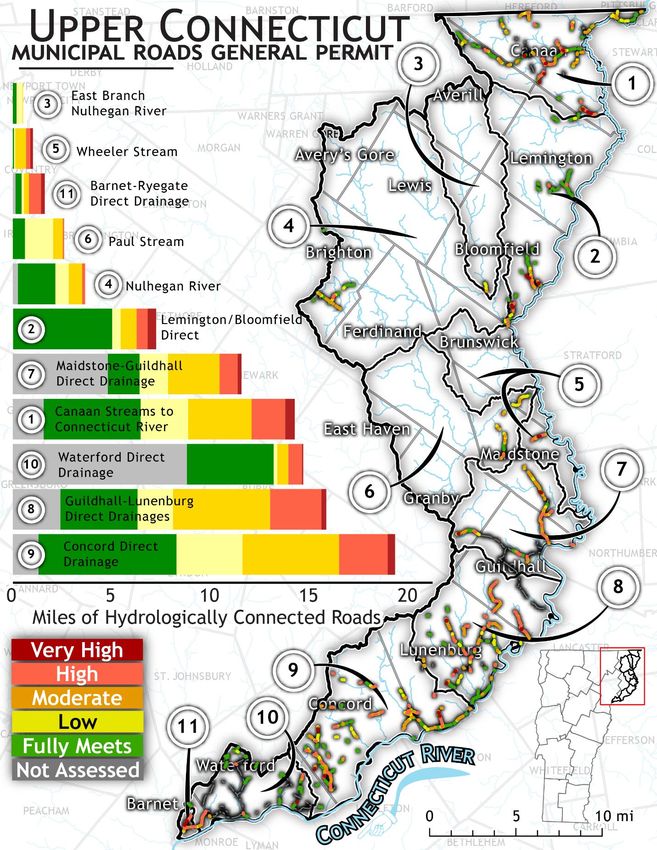
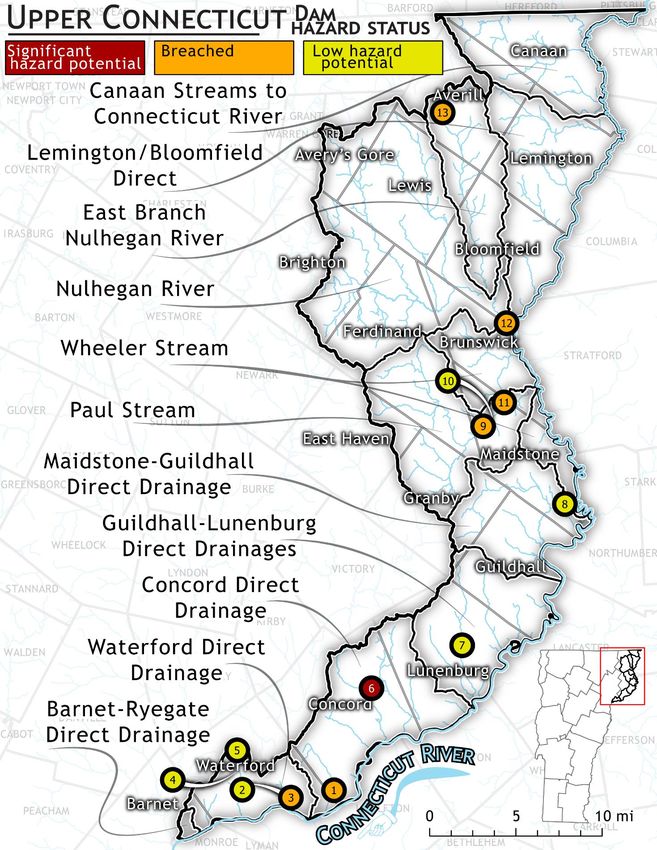
List of Figures
Figure 1. Status of 31 strategies from the 2014 Basin 15/16 TBP. ................................................. 3
Figure 2. Requirements for tactical basin planning ........................................................................ 4
Figure 3. Steps to the basin planning process on a 5-year schedule. ............................................. 4
Figure 4. The five chapters of Vermont Tactical Basin Plans. ......................................................... 5
Figure 5. Basin 16 is located in Northeast VT and is a 482 square mile watershed. ...................... 6
Figure 6. Land cover estimates by acreage for the eleven sub-basins of Basin 16. ....................... 7
Figure 7. Geomorphic condition of assessed streams in Basin 16 from reference to poor
condition based on Phase I and Phase II assessments. ................................................................ 11
Figure 8. Scorecard information for lakes and ponds in Basin 16. ............................................... 13
Figure 9. Surface water protection highlights in Basin 16. ........................................................... 18
Figure 10. Map of A(1) and B(1) candidates in Basin 16 for aquatic biota, aesthetics and fishing
uses that either exceed the 2016 VWQS or need additional sampling to determine their status
and potential Class I wetlands. ..................................................................................................... 23
Figure 11. Priority waters for restoration in Basin 16. ................................................................. 28
Figure 12. Estimated percent of nitrogen sources delivered to the Long Island Sound from Basin
16 based on the SPARROW model (Astor, 2019). ........................................................................ 30
Figure 13. Estimates of Nitrogen loading reaching Long Island Sound per square kilometer. .... 31
Figure 14. Agricultural land cover in Basin 16. ............................................................................. 34
Figure 15. Acres of field BMPs implemented in State FY2019 by sub watershed relative to 2016
NLCD agricultural land use acres highlighting 3 watersheds with lower levels of BMP
implementation.. .......................................................................................................................... 36
Figure 17. Upper Connecticut River project priority for roads based on REI's as part of the
Municipal Road General Permit as of November 2020. ............................................................... 43
Figure 18. Aquatic organism passage priorities as of October of 2020 based on the Upper
Connecticut Aquatic Organism Passage Team made up of local, state, and federal partners. ... 51
Figure 19. Graph showing a 37% increase in impervious surface within 400 feet of Maidstone
Lake from 2003 through 2016 and an increase in mean phosphorus concentration over this
same timeframe. ........................................................................................................................... 54
Figure 20. Lake Wise assessment locations around Maidstone Lake ........................................... 55
Figure 21. Forestland in Basin 16 represented by forestland management and ownership types.
....................................................................................................................................................... 58
Figure C1. Non-historic dams located in Basin 16. ....................................................................... 84

 BASIN 16 – UPPER CONNECTICUT RIVER BASIN PLAN – DRAFT FOR PUBLIC REVEIW                                                                                     v
List of Tables
Table 1. Focus areas and priority strategies for restoration and protection in Basin 16. .............. 2
Table 2. A list of uses that can be placed into each water class in the Vermont Water Quality
Standards. ..................................................................................................................................... 20
Table 3. Class A(2) designated public water sources in the Basin 16. .......................................... 20
Table 4. List of rivers and streams that either meet criteria for A(1) or B(1) for aquatic biota use
or require more monitoring to make a determination.. .............................................................. 20
Table 5. List of rivers and streams that meet criteria for B(1) for fishing. ................................... 21
Table 6. Lakes that meet criteria for A(1) or B(1) aesthetics or require additional monitoring to
determine their status and their corresponding map identification number. ............................. 24
Table 7. Class I wetlands candidates that require additional monitoring to determine their
status............................................................................................................................................. 25
Table 8. Basin 16 priority waters and pollutants. This table corresponds with Figure 11 map
numbers. ....................................................................................................................................... 27
Table 9. Towns with completed stormwater mapping reports ranked by number of high priority
projects identified in the mapping report. Click on the town to link to report. .......................... 40
Table 10. Basin 16 wastewater treatment facilities and other facilities subject to NPDES Direct
Discharge Permits. ........................................................................................................................ 45
Table 11. Summary implementation strategies for the Basin 16 Tactical Basin Plan.. ................ 62
Table 12. Basin 16 priorities for monitoring and assessment. Monitoring on private lands
requires landowner permission. ................................................................................................... 68
Table A1. 2014 Basin 16 report card with 2020 updates from local, state, and federal watershed
partners. ........................................................................................................................................ 77
Table B1. Determination of existing uses of flowing waters for swimming in Basin 16. ............. 82
Table B2. Determination of existing uses of flowing waters for boating in Basin 16. .................. 82
Table B3. Determination of existing uses of flowing waters for fishing in Basin 16. ................... 82
Table C1. Active dams in Basin 16. These dams are either in service, partially breached, or
deleted. Dams that are not “in-service” are in italics. .................................................................. 85

 BASIN 16 – UPPER CONNECTICUT RIVER BASIN PLAN – DRAFT FOR PUBLIC REVEIW                                                                                 vi
Executive Summary
      Basin 16 comprises multiple sub-basins that drain to the Connecticut River north of the Passumpsic
      River confluence. The basin stretches from Canaan to Barnet draining portions of Caledonia, and
      Essex counties and covers significant areas of 17 individual towns and gores. The Basin 16 Tactical
      Basin Plan (TBP) provides a detailed description of current watershed condition and identifies water
      quality focused strategies to protect and restore the basin’s surface waters.

      The goal of the Tactical Basin Plan is to “Protect the Best and Restore the Rest” when it comes to surface
                                           waters of the State of Vermont.

      Adapting how we manage and use our surface waters in the face of climate change is one of the
      chief overarching challenges for Basin 16, and beyond (State of Vermont, 2015). In Vermont,
      climate change is causing increases in storm intensity and total precipitation (Betts, 2011) (National
      Oceanic and Atmospheric Administration, 2013). These increases will likely lead to a rise in
      flooding, water quality and ecosystem impairments, and reduced water-based recreational availability
      to Vermonters (Pealer & Dunnington, 2011).

      Protective measures, such as strategic land acquisition and limitations on development in riparian
      areas, may be the most economical solution to address the challenges presented by climate change
      and to achieve healthy surface waters (Watson, Ricketts, Galford, Polasky, & O'Niel-Dunne, 2016)
      (Weiskel, 2007). But where pollution from historic and current land use occurs, strategies are
      identified in this plan that will complement protective measures, such as river corridor easements,
      riparian area plantings, floodplain and wetland restoration, dam removals, and agriculture,
      silviculture and stormwater best management practices. To implement these strategies, a significant
      investment in time by federal, state, and local stakeholders is required. These coordination efforts
      are ongoing.

      The information from monitoring events over the last 10 years have been incorporated in Chapters
      1, 2, and 3, which cover the condition of surface waters, protection priorities, and restoration
      priorities, respectively. Overwhelmingly, the waters in Basin 16 meet or exceed water quality
      standards.

      In Chapter 2, a total of 52 river segments, lakes, ponds, and wetlands are identified for protection or
      additional monitoring. Of the 52 waters, 22 river segments and two lakes and ponds meet criteria for
      enhanced protection for fishing, aesthetics, or aquatic biota. Eleven river segments and 15 lakes and
      ponds are identified for additional monitoring to determine if they meet reclassification criteria. Two
      wetlands are identified as potential Class I candidates and are recommended for further study to
      determine if they meet Class I wetland criteria. Target areas for protection are outlined in Table 1
      and Figure 10.

BASIN 16 – UPPER CONNECTICUT RIVER BASIN PLAN – DRAFT FOR PUBLIC REVEIW                                            1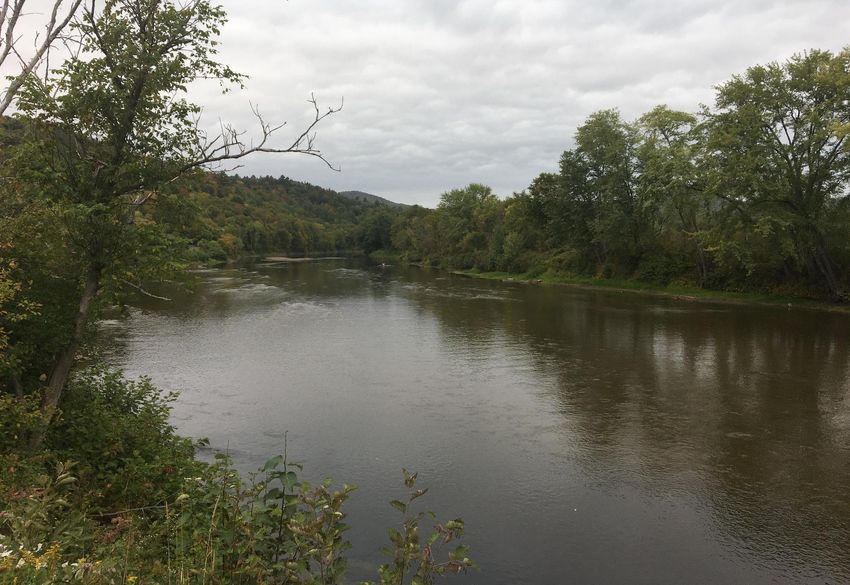
Table 1. Focus areas and priority strategies for restoration and protection in Basin 16.
 Focus Areas                 Priority Strategies
 Agriculture
 Mink Brook, Dean            • Connect farmers with the Connecticut River Watershed Farmers Alliance.
 Brook and Willard           • Continue biannual meetings of the Caledonia and Essex County Agricultural Workgroup.
 Stream watersheds           • Support workshops, outreach, and technical assistance necessary to support the implementation
                               of nutrient management plans, soil health practices, agricultural best management practices.
                               (BMPs), to reduce nitrogen and E. coli runoff.
                             • Develop a basin specific trial to support the advancement of interseeding.
                             • Provide technical and financial support to farmers to acquire equipment necessary for effective
                               implementation of BMPs such as cover cropping and no/minimal tillage.
                             • Identify a process and priorities for including floodplain and wetland restoration projects as farms
                               transition ownership or are conserved.
 Developed Lands - Stormwater
 Canaan, Bloomfield,         • Develop a Stormwater Master Plan for Canaan and Beecher Falls.
 Guildhall, Lunenburg        • Implement priority stormwater projects identified in Stormwater Mapping Reports.
 Developed Lands - Roads
 Maidstone Lake, Miles       • Complete Road Erosion Inventories (REIs) and implement BMPs on high priority road segments.
 Pond, Wallace Pond          • Provide and support training for road crews on using REI results to prioritize projects, to update
 watersheds.                   road segment status in the MRGP database as well as the installation and maintenance of road
                               BMPs to meet MRGP standards.
                             • Provide support for towns to apply for better roads grants, shared hydroseeder program, and to
                               reduce invasive species spread.
 Wastewater
 Maidstone Lake, Miles       • Promote septic system maintenance through local outreach and education programs, such as a
 Pond, Wallace Pond.           septic social.
 Natural Resources - Rivers
 Connecticut River and       • Develop and prioritize potential floodplain restoration and river corridor easement locations and
 lowest reaches of             implement these in coordination with basin partners.
 tributaries. Upland         • Expand local sources of native tree species as sources for riverine buffer planting.
 tributaries for strategic   • Target strategic wood additions and culvert replacements to restore Brook Trout habitat.
 wood addition and           • Provide support to towns to strengthen floodplain and river corridor protections in local flood
 culvert replacements.         hazard bylaws.
 Natural Resources - Lakes
 Maidstone Pond, Miles       • Complete and implement a Lake Watershed Action Plan for Maidstone Lake.
 Pond, Wallace Pond          • Complete outreach to the Miles and Wallace Pond communities around increasing nutrient trends
                               and opportunities to support Lake Wise assessments and implementation.
                             • Support aquatic invasive species spread prevention efforts.
 Natural Resources - Wetlands
 Connecticut River           • Complete site visits and/or location specific restoration maps for potential wetland restoration
 floodplain and lowest         locations.
 reaches of tributaries.     • Increase wetland restoration opportunities by developing a funding model for smaller wetland
                               restoration projects and for partners to acquire and steward wetlands.
                             • Estimate nitrogen reduction potential for wetland restoration projects.
 Natural Resources - Forests
 Existing & Prospective      • Implement forest infrastructure restoration projects on state-owned forest lands.
 A(1) & B(1) watersheds      • Provide outreach, technical assistance, and workshops to private forestland owners, foresters, and
                               loggers on Acceptable Management Practices and Use Value Appraisal (Current Use) Program, use
                               of skidder bridges, and voluntary harvesting guidelines.
                             • Support forestland conservation and skidder bridge loan program.

 BASIN 16 – UPPER CONNECTICUT RIVER BASIN PLAN – DRAFT FOR PUBLIC REVEIW                                              2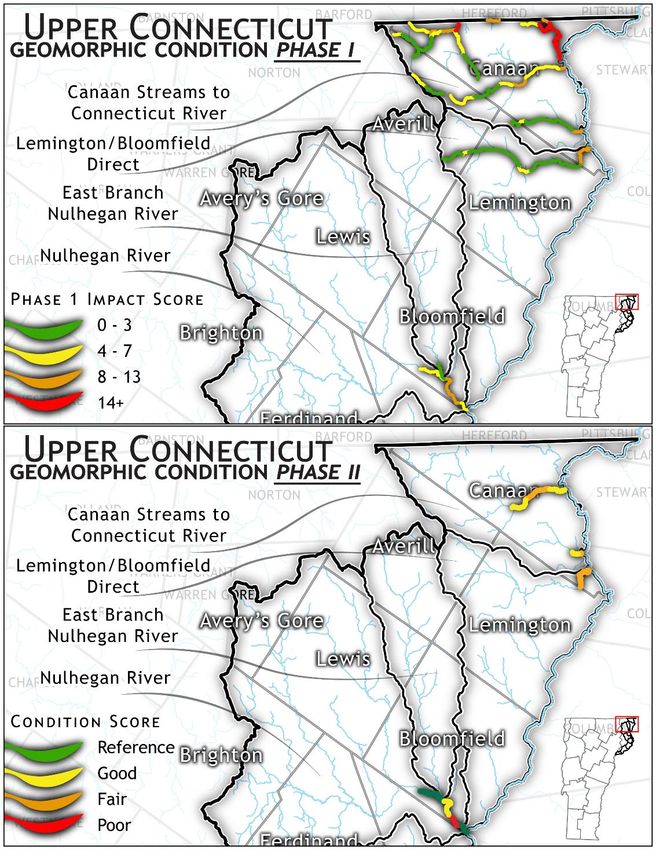
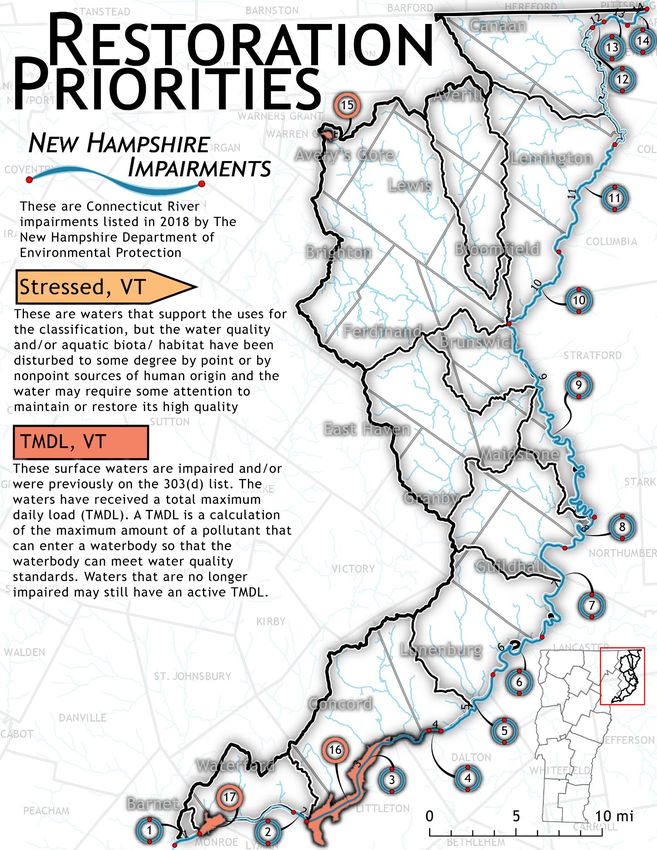
Although most surface waters monitored in Basin 16 meet or exceed water quality standards, there
are waters in need of restoration. In Chapter 3, a total of 17 lakes, ponds, or river segments are
identified for restoration. Fourteen of these segments are on the Connecticut River and are listed as
impaired by the State of New Hampshire. Three lakes are considered impaired due to elevated
mercury and acid concentrations as shown in Figure 11.

Chapters 4 and 5 outline sector-based strategies to meet protection and restoration goals, by providing
a list of 47 detailed strategies and 43 monitoring priorities for the next five years.

The 2014 Basin 15/16 plan identified
31 strategies to address protection
                                                          STRATEGY STATUS UPDATE 2014
and restoration of surface waters in                            Basin 15/16 TBP
Basin 16. Of the 31 strategies
identified, nine are complete, 15 are
in progress, five are awaiting action,
and two are discontinued (Figure 1).
Seventy-seven percent of the
strategies identified in the 2014 TBP
are active or complete 1. The Basin 16
                          0F

report card in Appendix A includes
the 2014 list of strategies with
detailed updates on progress.

While water quality improvements
are being made in Basin 16, limited
capacity, resources, and interest are
primary challenges to
implementation. The 47 priority
strategies identified in this plan
reflect input from the public, state
and federal water quality staff,
watershed groups, and regional           Figure 1. Status of 31 strategies from the 2014 Basin 15/16 TBP.
planning commissions. During the basin planning process partners expressed that outreach,
technical support and training on how to best protect and maintain our natural resources, in addition
to continued financial and technical support is critical in order to meet water quality goals.

1Complete = strategies with an explicit start and end point. In progress = strategies actively being pursued.
Discontinued = strategies that have not been initiated and are no longer being pursued. Awaiting action = strategies that
have not been initiated for various reasons such as a lack of resources or local support, or low priority (i.e., other
projects need to be completed first) but are still a priority.

    BASIN 16 – UPPER CONNECTICUT RIVER BASIN PLAN – DRAFT FOR PUBLIC REVEIW                                                 3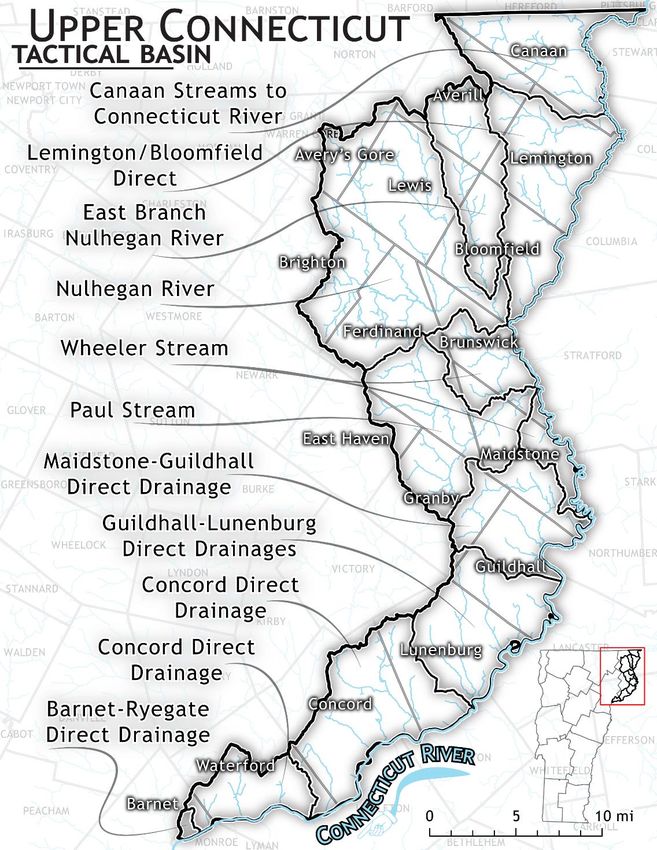
What is a Tactical Basin Plan?
A Tactical Basin Plan (TBP) is a strategic guidebook produced by the Vermont Agency of Natural
Resources (ANR) to “protect the best and restore the rest” of Vermont’s surface waters.

                                                        Tactical basin planning is carried out by the
                                                        Water Investment Division (WID) in
                                                        collaboration with the Watershed Management
                                                        Division (WSMD) and in coordination with
                                                        other state agencies and watershed partners.
                                                        Tactical Basin Plans (TBPs) are integral to
                                                        meeting a broad array of both state and federal
                                                        requirements (see Figure 2) including the U.S
                                                        Environmental Protection Agency’s (EPA) 9-
                                                        element framework for watershed plans
                                                        (Environmental Protection Agency, 2008) and
                                                        state statutory obligations including those of
                                                        the Vermont Clean Water Act, and Act 76 of
                                                        2019 and 10 V.S.A. § 1253.
   Figure 2. Requirements for tactical basin planning
The basin-specific water quality goals, objectives, strategies, and projects described in the TBPs aim
to protect public health and safety and ensure public use and enjoyment of Vermont waters and
their ecological health as set forward in the Vermont Surface Water Management Strategy (VSWMS)
and the Vermont Water Quality Standards (VWQS), and as identified in Total Maximum Daily
Loads. The TBP process (Figure 3) allows for
the issuance of plans for Vermont’s fifteen
basins every five years, as required by statute
10 V.S.A. § 1253.

The basin planning process includes:
   1. Monitoring water quality as described
       in the Water Quality Monitoring
       Program Strategy
   2. Assessing and analyzing water quality
       data
   3. Identifying strategies and projects to
       protect and restore waters
   4. Seeking public comment and
       finalizing the plan
   5. Implementing and tracking plan
       priorities (ongoing).               Figure 3. Steps to the basin planning process on a 5-year schedule.

 BASIN 16 – UPPER CONNECTICUT RIVER BASIN PLAN – DRAFT FOR PUBLIC REVEIW                                    4
Chapters 1-4 in the TBP provide an overview of the basin, protection and restoration priorities and
efforts to protect and restore water quality for each sector. Together this information supports the
targeted strategies listed in the implementation table in Chapter 5 as outlined in Figure 4.
•Basin Overview - presents water quality monitoring and assessment results that
Chapter 1 identify water quality protection and restoration priorities
•Protection priorities - lists waters that meet criteria for special state designations
Chapter 2 based on water quality data
•Restoration priorities - lists waters that do not meet water quality standards and are
considered impaired or otherwise not fully supporting uses
•Identifies causes and sources of pollution to these waters and in some cases
Chapter 3 pollutant reductions needed to restore water quality across each land use sector,
including those necessary to meet Total Maximum Daily Load (TMDL) targets
•Strategies by sector - addresses pollution sources across agricultural, developed
lands (stormwater and roads), wastewater, and natural resources (rivers, lakes,
wetlands and forests)
Chapter 4 •Summarizes efforts to protect and restore water quality through regulatory and
nonregulatory programs highlighting gaps that need to be filled in each sector
through targeted strategies to protect and restore waters
•Implementation table - outlines targeted strategies and the associated priority
areas, towns, partners and potential funding sources necessary to implement these
•Supports the prioritization of financial and technical resources to those projects that
Chapter 5 will have the greatest influence on surface water protection or remediation
•Monitoirng and assessment table - provides a preliminary list of water quality
monitoring priorities to guide monitoring over the next 5 years.
Figure 4. The five chapters of Vermont Tactical Basin Plans.
The tactical basin planning process engages water quality partners in building on the 2014 Basin Plan
as highlighted in the Basin 16 Report Card located in Appendix A that provides status updates for
strategies identified in the previous basin plan. This plan identifies strategies that serve as the next
five-year game plan for the Agency and partners that targets individual projects that are tracked via
its online counterpart, the Watershed Projects Database (WPD). The WPD is found on ANR’s
Clean Water Portal and is continuously updated to capture project information from the TBP
process, on the ground assessments, and emerging projects due to natural and anthropogenic events.
ANR’s Clean Water Portal is an online platform that houses a variety of clean water tools to assist
with project planning, searching existing projects, funding opportunities, and more. The Clean
Water Portal links to the Annual Performance Report that outlines progress in implementing clean
water practices for each basin in Appendix A and the Clean Water Cashboard that provides funding
levels for each basin.
BASIN 16 – UPPER CONNECTICUT RIVER BASIN PLAN – DRAFT FOR PUBLIC REVEIW 5Chapter 1 – Basin Description and Conditions
A. Basin 16 Overview
Basin 16 encompasses 482
square miles in Vermont,
draining a small portion of
Caledonia, and nearly all of
Essex Counties. The
watershed 2 comprises 11 sub-
3F
watersheds (Figure 5) which
include the Leach Stream,
Willard Stream, Nulhegan
River, Paul Stream, and many
other smaller Connecticut
River tributaries.
The northern most point of
the basin originates in Canaan
around the headwaters of
Leach Stream and covers the
Vermont drainages to the Connecticut
River south to the Passumpsic
River confluence. All waters in
each of the sub-watersheds
flow southeast towards the
Connecticut River. Detailed
information about each of
these rivers can be found in
the individual basin assessment
reports for Basin 16.
Figure 5. Basin 16 is located in Northeast VT and is a 482 square mile
watershed. Lakes and ponds are not
abundant in the Basin, but a few large and popular lakes are found here, including Maidstone Lake,
Miles Pond, Shadow Lake, and Wallace Pond. On the other hand, Basin 16 has large areas of
wetlands (Figure 6).
2 A river basin is an area of land drained by a river and its tributaries. The terms ‘basin’ and ‘watershed’ are used
interchangeably in this report. The Upper Connecticut River Basin is also referred to as Basin 16.
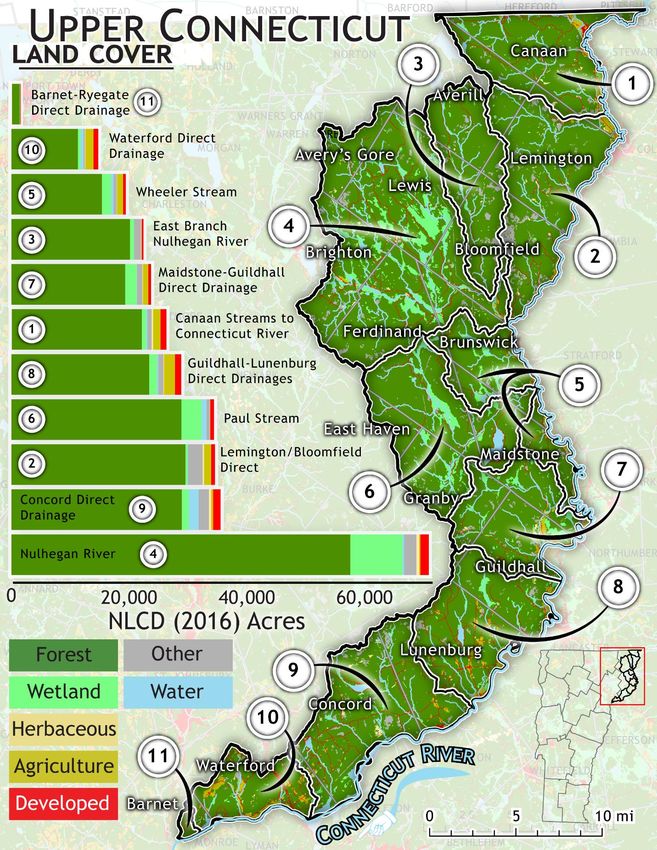
BASIN 16 – UPPER CONNECTICUT RIVER BASIN PLAN – DRAFT FOR PUBLIC REVEIW 6Figure 6. Land cover estimates by acreage for the eleven sub-basins of Basin 16. (Source: 2016 LULC data) BASIN 16 – UPPER CONNECTICUT RIVER BASIN PLAN – DRAFT FOR PUBLIC REVEIW 7
Land Use and Land Cover
The Upper Connecticut River Basin is a predominantly forested landscape covering 83% of the
basin while more than six percent is wetlands. Developed and agriculture land use each cover about
2.5% of the basin (Figure 6). A basin wide analysis of land use change from 2001 to 2016 showed
significant differences in several land use categories. Forest land cover decreased by around 3,000
acres (1.2%) and herbaceous land cover decreased by 1,950 acres (50%). The latter was largely offset
by an increase in shrub/scrub land cover of about 5,400 acres (96%). This suggests that most of the
loss in forest land cover is related to logging operations, where regrowth is occurring, not
conversion to agricultural or developed lands. About half of this loss in forest land cover was
mapped in the Lyman Brook, headwaters of the Nulhegan River, and East Branch of the Nulhegan
River watersheds with losses of 729, 760 and 759 acres, respectively. In agricultural lands, there has
been a loss of 525 acres (8%) of hay/pasture lands, but an increase in cultivated crops of nearly 60
acres (3%), most of which (35 acres) are within the Willard Stream watershed. Developed land cover
increased by 2.4 acres during this timeframe. Wetland and water acreage varied inversely, which is
likely related to water levels when mapping was done.

The forested landscape and wetlands are largely responsible for the good water quality in headwaters
areas of the basin. The areas in Basin 16 that are experiencing degraded water quality trends are near
concentrated residential and road development (Maidstone Lake, Wallace Pond, Miles Pond), or
concentrated agriculture along the Connecticut River. Managing land use to reduce discharge of
polluted runoff and allowing adequate space for treatment can both improve and protect water
quality. Good existing management practices and quality local stewardship may also be responsible
for the overall superior water quality of this basin.

Climate Change and Implications for Basin 16
Climate is defined by long-term weather patterns, which in turn, influence human and natural
systems. The 2014 Vermont Climate Assessment established state-level, climate change information
with implications for local surface waters. Since 1941, Vermont average temperatures have increased
2.7° F with warming occurring twice as fast in winter (Galford, 2014). The latter results in earlier
thaw dates for rivers, lakes and ponds, and mountain snowpack. Average annual stream flows are
increasing, which is expected to continue in the future. High flows now happen more frequently,
leading to increased inundation flooding and fluvial erosion (stream-related erosion) all of which can
be exacerbated or alleviated by land-use management decisions.

The impact of increased runoff and streamflow in a watershed depends on local land use and land
cover. In developed areas, more precipitation can increase stormwater volume and velocity thereby
mobilizing larger pollutant loads (Galford, 2014). In addition, increased streamflow will increase bed
and bank erosion and deliver more sediments downstream. In areas where non-point source
pollution is a concern more runoff can increase sediment, nutrient, and pathogen loading to surface
waters (Galford, 2014). Changes in climate increasingly require watershed restoration projects to
preserve natural sediment attenuation locations and incorporate stormwater and non-point source

 BASIN 16 – UPPER CONNECTICUT RIVER BASIN PLAN – DRAFT FOR PUBLIC REVEIW                                 8
runoff controls to counteract pollutant transport as well as consider the potential for higher peak
flows. Restoring floodplain connectivity along streams is essential to provide space for sediment,
debris, and nutrients to settle and store naturally and to maintain ecosystem resilience as the climate
changes.

Aquatic habitats affected by increased runoff and streamflow could experience increases in sediment
mobilization, nutrients and scouring in addition to increased water temperature. In response, local
freshwater plant and animal species may shift their geographic ranges and seasonal activities and
alter their abundance (Stamp J, 2020). Maintaining habitat connectivity, river and lake riparian
buffers, and stream equilibrium conditions will help reduce the impacts of climate change on
Vermont’s rivers, lakes and ponds, and wetlands.

Streamflow is influenced by several environmental factors with precipitation being the most
important. Daily precipitation data for the basin is available from the PRISM climate dataset
(http://prism.oregonstate.edu/) for the period 1981-2018. DEC analysis showed that, during this
time, trends in annual average precipitation, annual maximum 1-day precipitation, and number of
days per year with one or more inches of precipitation increased for all watersheds. When
comparing the beginning and end of this period, trends show an increase of more than two days per
year of 1+ inches of precipitation (from around six days to more than eight) and more than five
additional inches of total annual precipitation in this region from less than 40 to more than 45 inches
per year.

Monitoring data also indicate changing drought conditions in the region. A decrease in drought
severity is reflected in trends for the Standardized Precipitation Index (SPI), the most used drought
index worldwide. Long-term rainfall records (125 years) from nearby St. Johnsbury show significant
positive (wetter) trends in the SPI for each of the four seasons, suggesting that droughts have
become less severe on a seasonal basis. It is important to note these trends reflect what has been
observed in the past, and in some cases these trends may or may not persist into the future. For
example, many models and the information in the 2014 Vermont Climate Assessment suggest an
increased frequency and severity of low-flow, drier conditions for Vermont due to predictions of
longer periods between heavy rainfall events in future decades. Additional information on climate
change in Vermont can be found at: https://climatechange.vermont.gov.

B. Water Quality Conditions in Basin 16
There is a wide variety of water quality monitoring and assessment work that is supported by DEC
and its partners which are described in detail in the Water Quality Monitoring Program Strategy. The
results of this work provide a window into the condition of a Basin’s waters.

Several monitoring programs are active in this basin, most of which are led by programs in the
WSMD. These include the Biological and Aquatic Studies Section (BASS)that focuses on biological
monitoring of macroinvertebrate and fish communities as well as targeted chemistry sampling
around Wastewater Treatment Facilities (WWTF) or other pollution concerns. BASS also supports

 BASIN 16 – UPPER CONNECTICUT RIVER BASIN PLAN – DRAFT FOR PUBLIC REVEIW                                  9
the LaRosa volunteer water quality monitoring program that has supported an annual one day
sampling event which has included Halls Stream, the Nulhegan River and Paul Stream to evaluate
nutrient and chloride levels across the Connecticut River watershed across Vermont, New
Hampshire, Massachusetts and Connecticut. The Rivers Program supports stream geomorphic
assessments that evaluate geomorphic and habitat conditions of rivers. The Lakes and Ponds
Management and Protection Program supports the Spring Phosphorus and Lay Monitoring
Programs, which evaluate nutrient conditions and trends on lakes, as well as shoreland condition,
and in-depth lake assessments in addition to surveys for aquatic invasive species. Additionally, the
Wetlands Program conducts chemical and biological assessments of wetlands.

In addition to the WSMD programs, a network of streamflow gages is funded and operated in
partnership among DEC, Vermont Agency of Transportation (AOT), and Vermont Department of
Public Service (VDPS). The Vermont Fish and Wildlife Department (FWD) conducts fishery
assessments and temperature monitoring to understand recreational fish populations and evaluates
streams for strategic wood addition to restore habitat.

Condition of Rivers and Streams
Bioassessment on Streams
The Watershed Management Division (WSMD) in DEC assesses the health of a waterbody using
biological, chemical and physical criteria as described in the Vermont Water Quality Monitoring
Program Strategy 2011-2020 which was updated in 2015. Most of these data can be accessed
through the Vermont Integrated Watershed Information System (IWIS) online data portal. The
biological assessment of streams in VT is carried out by the WSMD using biological indices that
measure the health of streams by looking at multiple structural and functional aspects of the
macroinvertebrate and fish communities. Biomonitoring is best used for detecting aquatic life
impairments and assessing their relative severity, and for recognizing streams at or near a reference
level condition that may be suitable to higher levels of protection through reclassification. The
ratings for the community assessments range from Poor - not meeting Vermont’s water quality
standards (VWQS) - to Excellent - exceeding water quality standards. The monitoring information
below was collected in Basin 16 from 2010 to 2019.

Macroinvertebrate Monitoring Results
A total of 55 macroinvertebrate assessments were completed between 2010 and 2019 at 36 sites in
Basin 16. Results of these assessments are described below. In addition, to ensure a comprehensive
understanding of water quality basin wide, a gap analysis was conducted by DEC to identify sites
without current monitoring data. These will be prioritized for the 2022 monitoring season and can
be found in Chapter 5 in the Basin 16 Monitoring and Assessment Table.

From the most recent assessment, 33 streams (92%) exhibited Very Good or better condition. Of
these, 15 were found to be Excellent meaning at reference or natural condition.

 BASIN 16 – UPPER CONNECTICUT RIVER BASIN PLAN – DRAFT FOR PUBLIC REVEIW                                10
In the most recent assessments, the East Branch of the Nulhegan River was rated as Good-Very Good
and Good at river mile 0.7 and 4.2 respectively, suggesting that this stream meets VWQS. Only one
site, Paul John Stream, was rated as Fair/Good condition back in 2012.

Fish Monitoring Results
Twenty-one individual sites were sampled for fish in Basin 16 from 2010 through 2019. Five
sampling events (events are dates when a site was sampled – and several sites were sampled on
multiple dates) were unable to be assessed due to Brook Trout being the only species present,
significant wetlands upstream, or unsafe sampling conditions. On the most recent sampling dates,
six sampling sites exhibited
fish communities in
Excellent condition and
seven sampling sites
exhibited fish communities
in Very Good condition
which indicate the fish
communities at these sites
exceed VWQS. Two
sampling sites exhibited
fish communities in Good
condition at Keyer Brook
and Mill Brook, which
were likely related to a low
density of Brook Trout
and increased prevalence
of non-native Rainbow
and Brown Trout in both
streams. More information
about the results of these
sampling sites and events
can be found in the
Vermont Integrated
Watershed Information
System (IWIS).

Stream Geomorphic
Assessments
There is limited coverage
of Phase I or Phase II
Stream Geomorphic
                                Figure 7. Geomorphic condition of assessed streams in Basin 16 from reference to
                                poor condition based on Phase I and Phase II assessments.

 BASIN 16 – UPPER CONNECTICUT RIVER BASIN PLAN – DRAFT FOR PUBLIC REVEIW                                 11
Assessments (SGAs) in Basin 16 (Figure 7). With the exception of the Nulhegan River, streams in this basin are primarily in confined valleys and are particularly sensitive where these steeper streams reach the broad Connecticut River floodplain. The Phase I and 2 SGAs show areas of Poor to Fair geomorphic condition along most of the lowest reaches of streams as they cross the Connecticut River floodplain. This plan recommends that additional Phase II SGA’s or SGA lite assessments be conducted for Leach Stream and portions of the Nulhegan River watershed where there is a sentinel monitoring site or where significant strategic wood addition has been done or is planned. In addition, spot checks of previous SGA work on Keyer Brook, Willard Stream, Bolter Brook, and Capon Brooks could be done as part of project development efforts in these watersheds. Final SGAs can be accessed at: https://anrweb.vt.gov/DEC/SGA/finalReports.aspx. In 2004, a fluvial geomorphology assessment of the Connecticut River noted large areas of historical straightening, ongoing channel adjustments, and significant erosion related to these modifications as well as the loss of riparian vegetation and sediment inputs from some tributaries. This assessment covered the Connecticut River mainstem from Pittsburg downstream as far as Gilman and the backwater of the Moore Reservoir and was completed by Field Geology Services for the Connecticut River Joint Commissions. The state of New Hampshire has listed a reach of the Connecticut River as impaired due to substrate alteration in Lemington likely related to the sedimentation from tributaries and eroding streambanks of the Connecticut River. The DEC Rivers program plans to provide River Corridor mapping for the Connecticut River. Condition of Lakes and Ponds There are twenty-six lakes and ponds in Basin 16 that are ten acres or greater. Two of the largest are Moore (3181 acres) and Comerford (1029 acres) reservoirs on the Connecticut River, which are shared between Vermont and New Hampshire and are used to support hydropower generation. Maidstone Lake is the second largest lake in the basin at over 756 acres, followed by Neil Pond (188 acres), and Shadow Lake (Concord) (132 acres). Lakes that are ten acres or greater should be in accordance with the Vermont Hydrology Policy and meet the Hydrology Criteria (§29A-304) in the 2017 VT Water Quality Standards. Lakes in Vermont are scored on the VT Inland Lakes Scorecard (Figure 8), which is a user-friendly interface developed by the Vermont Lakes and Ponds Management and Protection Program (VLPP). The VT Inland Lakes Scorecard provides available data on overall lake health by providing a rating of a waterbody’s nutrient trend, shoreland and lake habitat, atmospheric pollution, and aquatic invasive species. Lake-specific water quality and chemistry data can be accessed online through the VT Lay Monitoring Program webpage. Of the twenty-six lakes monitored in Basin 16, only Wallace Pond has poor conditions for shoreland and lake habitat although eight other waterbodies scored as fair. Maidstone lake has the only poor condition rating for nutrient trends while Wallace Pond and Miles Pond are scored as fair. BASIN 16 – UPPER CONNECTICUT RIVER BASIN PLAN – DRAFT FOR PUBLIC REVEIW 12
#           Lake       Status Trend     AIS     Mercury Shore
26   Wallace          Nut/Phos Yellow   Blue    Yellow  Red
25   Forest (Averill)           Blue    Blue    Yellow Yellow
24   Unknown (Av G)      pH    White    White   Yellow Blue
23   Lewis               pH    White    Blue    Yellow Blue
22   Mcconnell           pH     Blue    Blue    Yellow Blue
21   Nulhegan            pH     Blue    Blue    Yellow Yellow
20   Mile                pH    White    Blue    Yellow Blue
19   Notch               pH    White    Blue    Yellow Yellow
     Brunswick
18                     White White      White   Yellow   Blue
     Springs
17   Dennis              pH     Blue    Blue    Yellow    Blue
16   Wheeler             pH     Blue    Blue    Yellow    Blue
15   Tuttle                    White    Blue    Yellow    Blue
14   South America       pH    White    Blue    Yellow    Blue
13   Paul Stream         pH     Blue    Blue    Yellow    Blue
12   West Mountain       pH     Blue    Blue    Yellow    Blue
11   Unknown (Fer)       pH    White    White   Yellow   White
10   Maidstone           pH     Red     Blue    Yellow   Yellow
9    Dutton                    White    White   Yellow    Blue
8    Stevens             pH    White    Blue    Yellow   White
7    Neal                pH     Blue    Blue    Yellow   Yellow
5    Miles                     Yellow   Blue    Yellow   Yellow
4    Shadow                     Blue    Blue    Yellow   Yellow
3    Joslin Turn               White    White   Yellow   White
2    Comerford          Blue   White    White    Red     Yellow
1    Moore                     White    White    Red      Blue

       Figure 8. Scorecard information for lakes and ponds in Basin 16.

         BASIN 16 – UPPER CONNECTICUT RIVER BASIN PLAN – DRAFT FOR PUBLIC REVEIW   13
There are three main airborne pollution types that affect lakes and ponds in Vermont: sulfur oxides, nitrogen oxides, and mercury. Mercury contamination has resulted in fish consumption advisories in nearly every lake in Vermont and those of nearby states as well, so all lakes in Basin 16 get a fair condition score for mercury except for Comerford and Moore reservoirs which are rated as poor condition and considered impaired for mercury (Figure 8). Due to the way reservoirs are managed for hydroelectrical production, dramatic shifts in water level cause the release of bio-available mercury that is otherwise sequestered in the sediments and this mercury is more easily transferred up the food web to fish and loons. Sulfur and nitrogen oxides are largely transported to Vermont from out of state air emissions. As part of the Vermont acid lake impaired TMDL, the State of Vermont urged USEPA to enforce the Clean Air Act and its amendments to meet emission reduction targets. Vermont joined the USEPA, 7 states and 13 citizen groups to sue a major emitter of air borne pollutants and won a settlement in 2007. Nationwide emissions and deposition of acid forming pollutants have declined. As a result, Vermont’s in-lake acid concentrations have declined, resulting in less acidic conditions. Achieving pre-industrial conditions will be unlikely, but the improvements are significant. Lakes and ponds in Basin 16 are regularly monitored for low pH (high acidity), which impacts biological communities. Two ponds in the basin both called “Unknown”, one in Avery’s Gore and one in Ferdinand, are considered impaired for acidity because of their low pH. The majority of other lakes and ponds in the basin also show low pH and are considered acid stressed by the VLPP. These ponds are monitored periodically. More information about long-term monitoring of VT’s acid lakes can be found at: https://dec.vermont.gov/watershed/map/monitor/acid-rain Several lakes in the basin have been surveyed in the past demonstrating “good” scores for the lack of aquatic invasive species (AIS). A “poor” score indicates that there is at least one invasive species present, regardless of its abundance or ‘nuisance’ level. New introductions occur mainly in waterbodies that have access for watercraft (mainly motorboats), and the incoming boat traffic is from AIS infested waters. Boat access areas are present at five locations in the basin, which provide light use by boaters including Maidstone, Miles, Neal, Shadow, and the main channel of the CT River. Maidstone and Miles have active and successful VT Public Access Greeter Programs, checking hundreds of boats annually. Their results show that the majority of incoming boats have not visited regional or local waterbodies containing AIS. A small number of incoming boats did previously visit AIS infested waterbodies including Lake Champlain, some regional Vermont waterbodies, and the Atlantic Ocean. Other access locations are smaller and are limited to personal watercraft, mainly kayaks and canoes, which provide less of a threat to potential AIS introductions. As more AIS waterbodies and threats are in close proximity, and incoming boat traffic is expected to increase, implementing a basinwide AIS Spread Prevention Program will limit the threat of the introduction of AIS in the basin lakes and ponds. More information about how these lakes are managed is found in the Natural Resources – Lakes section of Chapter 4. Those wishing to better understand the scoring process are encouraged to read the ‘How Lakes Are BASIN 16 – UPPER CONNECTICUT RIVER BASIN PLAN – DRAFT FOR PUBLIC REVEIW 14
Scored’ sections and watch the recorded webinar on the YouTube channel for the DEC Watershed
Management Division.

Condition of Wetlands
Wetland Monitoring
The Vermont Wetlands Program uses its Bioassessment Project to gather data about the health of
Vermont wetlands. Based on a 2017 analysis of bioassessment data, the principal factors that
correlate with poor wetland condition are:

   •   presence of invasive species,
   •   disturbance to the wetland buffer or surrounding area,
   •   disturbance to wetland soils, and
   •   disturbance to wetland hydrology (how water moves through a wetland) through ditching
       (e.g., agricultural), filling (e.g., roads) and draining (e.g., culverts).
Wetlands in remote areas and at high elevations tend to be in good condition, with the most
threatened wetlands occurring in areas of high development pressure and exhibiting habitat loss.
The wetlands program has 12 surveys in this basin with an average score that is higher than all the
other basins in Vermont. While the wetlands surveyed may not be representative of the entire basin,
this suggests that the basin has many wetlands with the best conditions in the state.

The State of Vermont also uses the Vermont Rapid Assessment Method (VRAM) to rapidly assess
both wetland condition and function. Scores can range from 4 to 100. This basin is relatively under-
sampled, with 12 VRAM wetland assessments. The assessments are concentrated in and near the
Nulhegan Basin area. Scores range from 71 to 95 with a mean of 83. While these assessments cannot
be directly used to infer wetland condition in this watershed compared with others, this mean score
is much higher than the overall state average of 64 and does likely represent an overall tendency
towards good-condition wetlands in this basin. Factors that impact wetlands in other areas of the
state such as urban development and agriculture are very limited in extent in this watershed and
mostly limited to the immediate Connecticut River floodplain.

Interested organizations and citizens can help build the dataset of wetlands in Basin 16 by
conducting VRAM analysis. Individuals or groups interested in learning the VRAM protocol should
contact Wetlands Scientist Charlie Hohn at Charlie.Hohn@vermont.gov for further information.

Condition of Fisheries
Flowing Water Fisheries
Brook Trout are the most widespread fisheries resource in Basin 16. Self-sustaining populations of
Brook Trout exist in nearly all of the cold streams in the basin, and they are joined by naturally
reproducing populations of Brown and Rainbow Trout in some of the small direct tributaries to the

 BASIN 16 – UPPER CONNECTICUT RIVER BASIN PLAN – DRAFT FOR PUBLIC REVEIW                               15
Connecticut River. While connectivity exists between the Connecticut River and larger basins, very few naturalized Brown Trout are found in the Paul Stream and Nulhegan Basin and at this point pose little threat to native Brook Trout populations. Bedrock geology and extensive stream electrofishing throughout the basin suggest that Basin 16 streams are chemically less productive than those in other parts of the state. A Basin 16 stream is expected to support a lower abundance of trout than a stream of similar habitat quality in a more productive part of the state. There are also many stream reaches in Basin 16 that are too warm for salmonids in summer because they are below ponds or one of the many large wetlands found in the basin. The Northeast Kingdom of Vermont has some of the most intact Brook Trout habitat throughout the native range of Eastern Brook Trout (Eastern Brook Trout Joint Venture, 2006). Many watersheds in this area are secure strongholds, because of habitat integrity and resilience (Fesenmyer, 2017). Despite these exceptional conditions, the lack of in-stream wood is one of the main factors limiting Brook Trout biomass in northeastern Vermont (Kratzer J. F., 2013). Historically, rivers in the northeast were filled with natural wood pieces, jams, and rafts that shaped the structure and function of rivers and resulted in high floodplain connectivity (Pike, 1999) (Wohl, 2014). Extensive logging and log-drives denuded the landscape and severely degraded the rivers. To drive logs, numerous splash-dams were built along the rivers, long stretches were straightened, side channels were blocked, and boulders, trees, and other instream obstructions were removed to prevent logjams. Repeated cycles of clear-cutting ended in the 1980’s, and since then, many watersheds have become reforested. But many rivers in the Northeast Kingdom have entered an alternative stable state of single-thread channels with substantially reduced overbank flow, sedimentation, and avulsions (Wohl, 2014) and it will be decades before riparian trees reach sizes and ages capable of restoring wood recruitment and retention to historic, natural rates. In addition, large boulders that were removed to aid log drives are very unlikely to come back naturally. Despite the large proportion of forested, undeveloped land in Basin 16 and despite extensive electrofishing by FWD in Basin 16, relatively few streams qualify as B(1) fishing waters (Table 2). This is believed to be mostly a result of the low productivity of streams in this basin. In streams with sufficiently cool water temperatures and the right size and slope to hold large woody material, adding large wood could increase Brook Trout abundance enough to meet B(1) fishing standards. There may be opportunities for classifying many Basin 16 streams as A(1) for fishing, as many small streams have little to no ongoing human activity. However, past logging practices eliminated the “natural condition” of these streams by reducing the age of the riparian forest and decreasing wood loading. While only time can restore the age of the riparian forests and the natural wood recruitment process, strategic wood addition can be used to help restore natural wood loadings in the meantime. Lakes & Ponds Fisheries The pond-dwelling Brook Trout populations of Basin 16 represent a rare fisheries resource for the state. There are only eight ponds in the state that are known to support naturally reproducing populations of Brook Trout that are robust enough to provide quality angling opportunities without BASIN 16 – UPPER CONNECTICUT RIVER BASIN PLAN – DRAFT FOR PUBLIC REVEIW 16
additional stocking. Two of these ponds, Unknown Pond (Avery’s Gore) and West Mountain Pond,
are in Basin 16. Additionally, Unknown Pond (Ferdinand) has a modest population of wild Brook
Trout, which are supplemented with stocking of triploid (sterile) Brook Trout, and Lewis Pond has a
small population of wild Brook Trout that continue to persist despite the recent establishment of
Smallmouth Bass. While it is poorly documented, it is very likely that there were self-sustaining
populations of Brook Trout in many more Vermont ponds before European settlement. Habitat
degradation and the introduction of non-native fish species has eliminated them from most of these
habitats. Therefore, protecting existing pond-dwelling, self-sustaining Brook Trout populations is a
high priority. Listing the tributaries of these ponds as A(1) waters may be appropriate, although all
of these ponds and their tributaries are on conserved lands, and so they are already protected.

Maidstone Lake supports a self-sustaining population of Lake Trout. Within the last 20 years,
Smallmouth Bass were illegally introduced and have become established in Maidstone Lake and
Lewis Pond.

Summary
Most surface waters in Basin 16 meet or exceed water quality standards. However, both restoration
and protection efforts are required to maintain and improve water quality in Basin 16 as well as to
address downstream water quality concerns on the Connecticut River and Long Island Sound. The
following chapters provide an overview of priority waters for protection and restoration and identify
sector specific strategies to meet our water quality goals.

Chapter 2 – Priority Areas for Surface Water Protection
In order to protect Vermont surface waters and their designated uses, the VWQS establish water
quality classes and associated management objectives. In addition to the pathways provided by the
VWQS, Tactical Basin Plans identify opportunities to increase protection of high-quality waters
through land stewardship programs, local protection efforts, conservation easements, and land
acquisition.

As specified in the VWQS, all surface waters are managed to support designated uses valued by the
public at a level of Class B(2) (i.e., good condition) or better. Designated uses include: swimming,
boating, fishing, aquatic biota, aquatic habitat, aesthetics, public water source, and irrigation. This
section of the plan identifies surface waters where monitoring data indicate conditions may meet or
exceed the VWQS management objectives and criteria for A(1) and B(1) designated uses. These
high-quality waters may be protected by the anti-degradation policy of the VWQS or by upward
reclassification through one of the following pathways:

 •   Reclassification of surface waters
 •   Class I Wetland designation
 •   Outstanding Resource Waters designation
 •   Designation of waters as cold-water fisheries

 BASIN 16 – UPPER CONNECTICUT RIVER BASIN PLAN – DRAFT FOR PUBLIC REVEIW                                  17
You can also read