URBAN FLOODING IN HALIFAX, NOVA SCOTIA: THE EXTENT OF THE ISSUE AND THE APPROACH THROUGH POLICY - DIVA
←
→
Page content transcription
If your browser does not render page correctly, please read the page content below
DEGREE PROJECT IN ,
SECOND CYCLE, 15 CREDITS
STOCKHOLM, SWEDEN 2017

Urban Flooding in Halifax,
Nova Scotia:
The extent of the issue and the approach
through policy.

MACKENZIE CHILDS

KTH ROYAL INSTITUTE OF TECHNOLOGY
SCHOOL OF ARCHITECTURE AND THE BUILT ENVIRONMENT
TRITA SoM EX 2017-
43

www.kth.se
Abstract
        In recent years, urban flooding events have been reported frequently in Halifax. The climate is
changing, precipitation events are becoming less frequent but more intense, and urban development is
accelerating. Halifax has unique characteristics including topography, location and recent changes to the
stormwater management system, which influenced the decision to conduct this study.
        I used a mixed methods approach involving direct observation, a document review, and
interviews. I visited flood-prone areas in Halifax during days of moderate precipitation, aiming to gather
an applied understanding of impacts. I researched the changing climate, stormwater management, and
recent flooding events through the document review, and conducted a policy analysis to understand the
level to which policies address flooding. Through interviews, I gathered opinions and information on
whether flooding is an issue in Halifax and whether policy addresses it.
        Between 2014 and 2017, at least seven flooding events were reported in Halifax, and there have
been numerous recorded flooding events since 1992. When compared to data prior to 1987, flooding
events seem to be increasing in frequency. Precipitation levels are difficult to predict and do not display
a conclusive pattern, but there is a general pattern showing a decrease in days of precipitation, while
the amount of precipitation stays the same or increases.
        Certain Halifax policies address flooding, but the level of focus varies among documents. The
areas covered varies within documents as well, as some govern the entire Halifax Regional Municipality,
while others focus on the city of Halifax. Some documents include requirements, while others are
guidelines, intended to be used by the city and developers, as examples of best practices. There is a
consensus among interviewees that flooding is an issue in Halifax, even if people are not yet aware of it.
There is a lack of consensus on the extent to which existing policies address flooding. Although Halifax is
not necessarily a leader in flood mitigation and adaptation, there is some level of discourse about it.
        Currently it is difficult to know if flooding is an issue in Halifax, as climate change and
precipitation are impossible to predict, but it is possible the issue can intensify in the future. Other cities
in Canada have created policies aimed at mitigating and adapting to flooding and other extreme events,
and they have begun to question the sustainability of their existing stormwater management systems.
Sea-level rise and coastal flooding are more commonly addressed in Halifax policies, rather than urban
flooding, but it is understood that climate change will have an effect. This research shows that Halifax
has begun to acknowledge that flooding may be an issue in the future, but it is unclear to what extent
existing policy can address it.

                                                                                                                  i
Table of Contents
Abstract .......................................................................................................................................................... i
List of Figures ............................................................................................................................................... iv
Introduction .................................................................................................................................................. 1
Literature Review .......................................................................................................................................... 3
   Climate Change ......................................................................................................................................... 3
       World .................................................................................................................................................... 3
       North America ....................................................................................................................................... 4
       Canada .................................................................................................................................................. 7
       Atlantic Canada ................................................................................................................................... 10
   Flooding................................................................................................................................................... 10
       Urban Flooding.................................................................................................................................... 14
Approach and Methods .............................................................................................................................. 18
   Why Halifax? ........................................................................................................................................... 18
   Methods .................................................................................................................................................. 20
       Direct Observation .............................................................................................................................. 21
       Document Review and Data Analysis ................................................................................................. 21
       Interviews............................................................................................................................................ 22
Findings ....................................................................................................................................................... 23
   Flooding in Nova Scotia........................................................................................................................... 23
   Precipitation Patterns in Halifax ............................................................................................................. 25
   The Built Form ......................................................................................................................................... 30
   Halifax Stormwater ................................................................................................................................. 31
   Extreme Weather Events in Halifax and Nova Scotia ............................................................................. 33
   Halifax’s Flood Preparedness .................................................................................................................. 36
   Site Visits ................................................................................................................................................. 39
   Interviews................................................................................................................................................ 43
   Policy Analysis ......................................................................................................................................... 49
       Centre Plan (Draft) .............................................................................................................................. 50
       The Halifax Green Network Plan (Draft) ............................................................................................. 51
       ClimateSMART: Climate change risk management strategy for HRM (2007) .................................... 53
       Halifax Regional Municipal Planning Strategy (2014) ......................................................................... 55
       Halifax Municipal Planning Strategy (2017) and the Halifax Peninsula Land Use By-law (2017) ....... 56
       Halifax Stormwater Management Guidelines (2006) ......................................................................... 57
       The Municipal Climate Change Action Plan (2013) ............................................................................. 57

                                                                                                                                                                   ii
Future Plans ............................................................................................................................................ 59
Discussion.................................................................................................................................................... 60
   To What Extent is Flooding an Issue? ..................................................................................................... 60
   Does Policy Address the Issue? ............................................................................................................... 61
Conclusions ................................................................................................................................................. 64
References .................................................................................................................................................. 65
Appendix A: Interview Questions ............................................................................................................... 73

                                                                                                                                                              iii
List of Figures
Figure 1: Global changes in average temperature and precipitation ........................................................... 4
Figure 2: Changes in average temperature and precipitation projections in North America ...................... 5
Figure 3: Extreme weather projections in North America ............................................................................ 6
Figure 4: Trends in annual departures of average annual precipitation in Canada, from the 1951 to 1980
normals ......................................................................................................................................................... 8
Figure 5: Annual precipitation trends in Canada between 1948 and 2003 .................................................. 8
Figure 6: Seasonal change in precipitation in Canada since 1950 ................................................................ 9
Figure 7: Seasonal change in precipitation in Canada by the 2050s........................................................... 10
Figure 8: Flood disasters in Canada between 1990 and 2013 .................................................................... 12
Figure 9: Significant floods in Canada between 1900 and 2012 ................................................................. 13
Figure 10: Flood disasters in Canada between 1990 and 2013, with Nova Scotia marked ........................ 13
Figure 11: Map of Halifax ............................................................................................................................ 18
Figure 12: Geological features of Halifax .................................................................................................... 19
Figure 13: Topography of Halifax ................................................................................................................ 20
Figure 14: Flooding in Nova Scotia between 1992 and 2015 ..................................................................... 24
Figure 15: Flooding in Nova Scotia between 1758 and 1987 ..................................................................... 24
Figure 16: Amount of monthly precipitation in Halifax between 2014 and 2017 ...................................... 26
Figure 17: Amount of days of precipitation in Halifax between 2014 and 2017 ........................................ 27
Figure 18: Amount of historical and projected precipitation in Nova Scotia and Halifax .......................... 28
Figure 19: Intensity of short period rainfall in Nova Scotia and Halifax ..................................................... 29
Figure 20: Temperature and precipitation for Halifax between 1981 and 2010 ........................................ 29
Figure 21: Historical and projected temperature for Halifax...................................................................... 30
Figure 22: Pervious and impervious surfaces on the Halifax peninsula ..................................................... 31
Figure 23: Sewer systems in Halifax ............................................................................................................ 32
Figure 24: Flooding in Bedford, 2014 .......................................................................................................... 34
Figure 25: Flooding in Halifax, 2014 ............................................................................................................ 34
Figure 26: Flooding in Halifax, 2015 ............................................................................................................ 35
Figure 27: Flooding in Halifax, 2016 ............................................................................................................ 36
Figure 28: Halifax’s ranking on flood preparedness factors ....................................................................... 38
Figure 29: Locations of site visits in Halifax ................................................................................................ 39
Figure 30: Photographs from site visits in Halifax ...................................................................................... 40

                                                                                                                                                                iv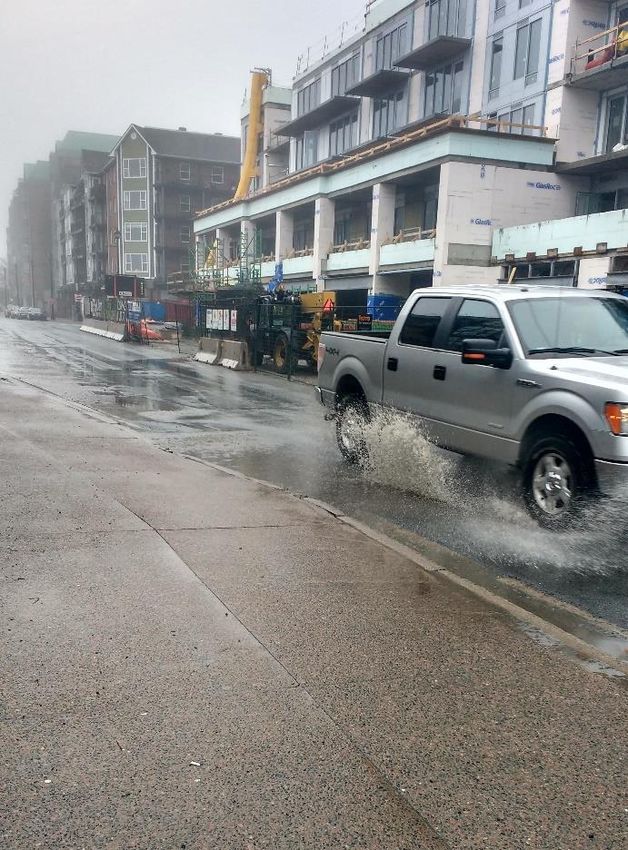
Introduction
        Climate change is increasingly being understood as a major global problem. It is clear humans
are having an irreversible impact and that the earth and oceans are warming, precipitation levels are
changing and sea level is rising. These changes to the natural systems are impacting the human
population and causing devastating effects.
        Climate change is affecting freshwater and ocean resources, causing issues in food security and
production, impacts on human health and safety, and overall vulnerability to changing systems. The
developed and the developing world are affected differently, as are the urban and rural areas.
“Adaption to climate change depends centrally on what is done in urban centres, which now house
more than half the world’s population and concentrate most of its assets and economic activities” (Revi
et al., 2014, p. 541). The world is becoming increasingly urban, and urbanization is intensifying existing
natural problems through the alteration of the environment.
        One of these problems is urban flooding, which has three main drivers: land-use change, design
capacity, and climate change. Through urbanization, there is an increase in impervious surfaces such as
buildings, roads and parking lots, and a reduction of vegetation and soil. This results in increased runoff
volumes and overwhelmed stormwater systems, as water moves along the surface, rather than
percolating into the ground. Many of today’s stormwater systems were built decades ago and are not
meant to accommodate the volume and intensity of water they receive today. It is projected that
climate change will have an impact not only on the amount of precipitation, but on the intensity of
precipitation events. Cities must implement flooding mitigation and adaptation efforts, while taking into
consideration the existing built environment and future urban development.
        With this study I aim to explore urban flooding in Halifax, Nova Scotia and understand to what
extent current policy addresses urban flooding. I chose to study Halifax because of the history of its
sewer system and recent stormwater system changes, it’s topography, location, amalgamation into the
Halifax Regional Municipality, and recent, reported flooding events.
        The city of Halifax is located within the Halifax Regional Municipality (HRM) in Nova Scotia, and
consists of a peninsula and a portion of the mainland. In 1996, the City of Halifax, City of Dartmouth,
Town of Bedford and County of Halifax amalgamated to create the Halifax Regional Municipality,
resulting in the need to create new policies and to have inter-jurisdictional consistency (Halifax Regional
Municipality, 2005, December 13). There are only six main points of access onto the peninsula: three
roads, two bridges and a ferry terminal. The shape of the peninsula results in a long coastline along the

                                                                                                              1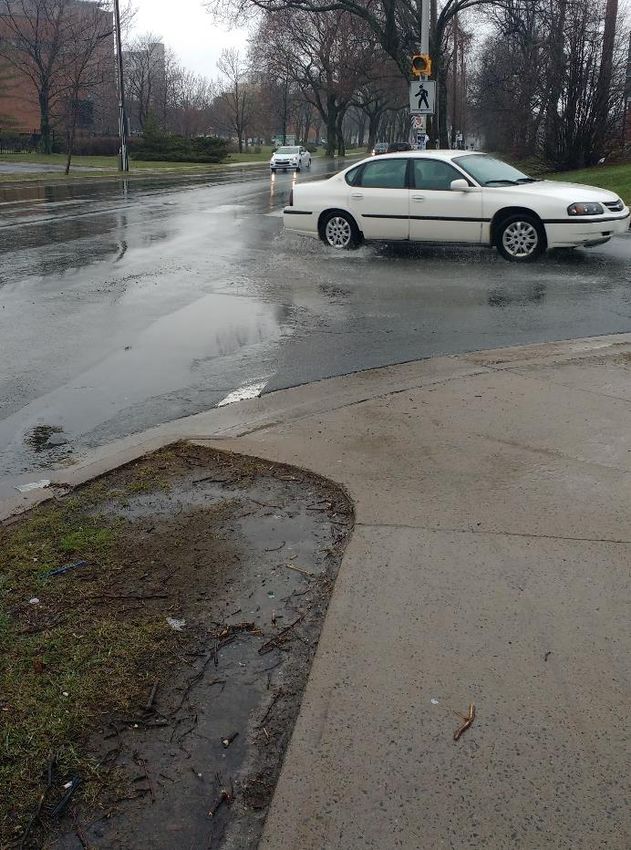
harbour. The Halifax Regional Municipality (HRM) has kilometers of coastlines and contains numerous
lakes and rivers. The topography of the city of Halifax and the surrounding area is unique, as it contains
drumlins, resulting in the combination of large hills and flat settings. Although Halifax is located on the
coast, this study will not focus on coastal flooding, as the majority of existing research and policy focuses
on coastal flooding and sea level rise.
           Notable flooding events have been occurring throughout Canada in recent years, in conjunction
with severe weather events. The climate has shifted, resulting in the frequency and intensity of
precipitation, and an increase in reported flooding. Flooding in Nova Scotia, including Halifax, is difficult
to predict and can be caused by heavy rainfall, sudden thawing of ice and snow, and infrastructure
failure.
           Halifax’s water infrastructure consists predominately of a combined sewer system and has
undergone recent changes. Until 2008, sewage was sent directly into the Halifax Harbour without
treatment, but in 2008 wastewater treatment plants began operating along with the existing combined
sewer systems. Combined sewer systems combine sewage and rainwater and direct it all to a water
treatment plant, where treatment occurs before discharging it into a body of water. This system is not
unique to Halifax, as it is a common method in cities across Canada. These systems have been in use
since the mid-1900s, and some places are beginning to question their sustainability.
           For this study, I focus on understanding the level of flooding occurring in Halifax, explore the
possible reasons for it, and analyze policy to determine how it addresses urban flooding. The specific
research questions are:

To what extent is urban flooding occurring in Halifax and is it an issue? To what extent do existing policy
                                      documents address urban flooding?

                                                                                                                2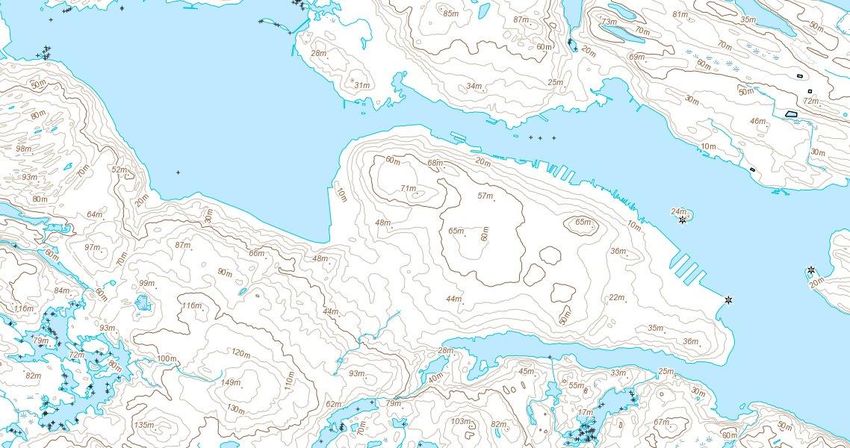
Literature Review
Climate Change
World
        It is now widely understood that humans are having an irreversible impact on the earth’s
climate and that anthropogenic climate change is having drastic effects. The Intergovernmental Panel on
Climate Change states, “it is extremely likely that more than half of the observed increase in global
average surface temperature from 1951 to 2010 was caused by the anthropogenic increase in GHG
[greenhouse gas emissions] concentrations and other anthropogenic forcings together” (IPCC, 2014, p.
48). It is also likely that the global water cycle has been affected by anthropogenic impact since 1960,
including the likelihood that there are more places with increased heavy precipitation events than
places with decreased precipitation events (IPCC, 2014). Natural and human systems are being affected
globally and it is predicted that changes will continue unless there are substantial and continued
reductions in greenhouse gas emissions (IPCC, 2014). Even if greenhouse gas emissions were reduced at
this moment, global temperatures would continue to rise for years and other affects would remain, as
greenhouse gases exist in the atmosphere for decades (EPA, 2016). In addition to reducing our emissions
and mitigating our effects on the climate, we need to adapt and be sure our communities are
appropriately prepared for climate change effects, as there is high probability many events will increase
in frequency and intensity.
        Figure 1 shows the global changes in average temperature and precipitation based on
projections for a scenario where there is stringent mitigation for greenhouse gas emissions in place
(RCP2.6), and a scenario where there are high greenhouse gas emissions (RCP8.5). These Representative
Concentration Pathways (RCP’s) are used to make projections based on population size, economic
activity, lifestyle, energy use, land use patterns, technology, and climate policy (IPCC, 2014).
        The two scenarios show how drastic the differences can be depending on the world’s mitigation
approach and the necessity of adaptation. A higher average surface temperature in (a) is illustrated by a
darker red, and a higher average precipitation in (b) is illustrated with a darker blue.

                                                                                                           3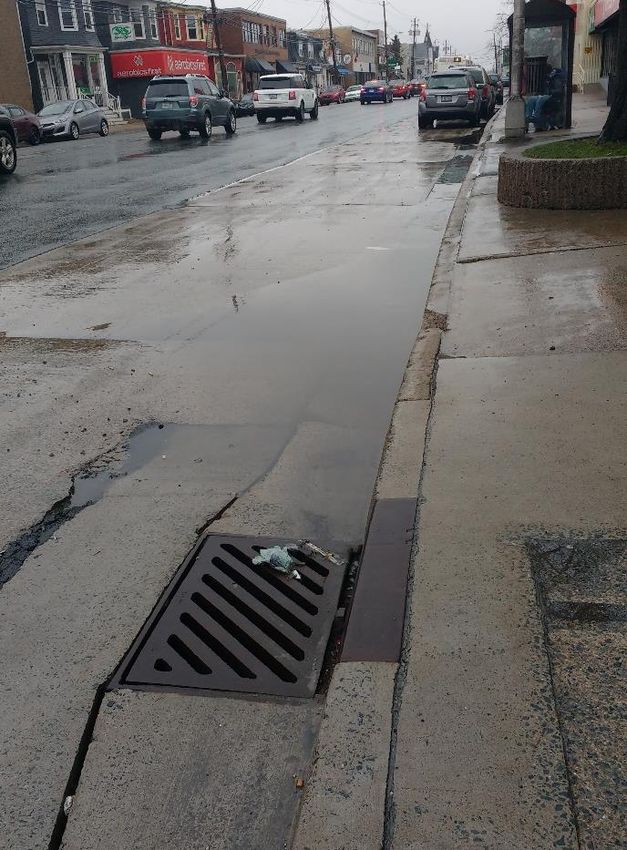
Figure 1: Global changes in average temperature and precipitation
(IPCC, 2014)
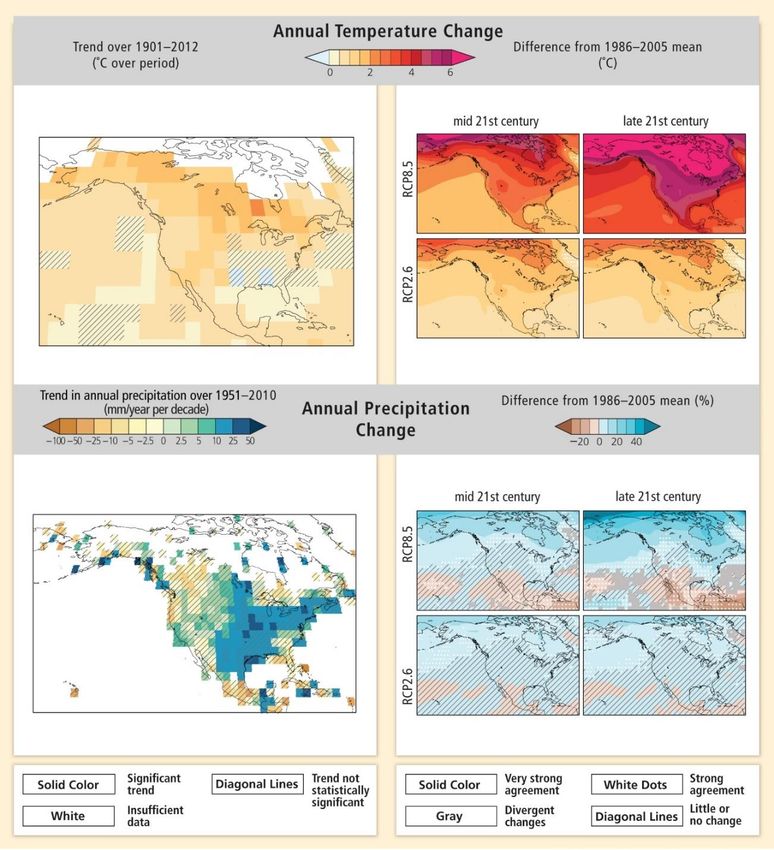
North America
The climate in North America has shifted with an increase in high heat weather events, fewer
days of frost, and an increase in precipitation (Romero-Lankao et al., 2014). These events and changes
will continue to increase over decades. The following images use RCP’s for temperature and
precipitation to assess risk with climate change. Figure 2 shows the changes in average temperature and
precipitation for North America using the RCP2.6 (stringent mitigation for greenhouse gas emissions)
and RCP8.5 (high greenhouse gas emissions) scenarios. The trend of annual temperature change from
1901-2012 shows an overall increase by up to approximately 3 degrees Celsius across most of North
America. The trend in annual precipitation from 1951 to 2010 shows the mm/year and whether the
change is significant or not. There are large sections of North America with insufficient data. The
projection of annual average temperature and annual average precipitation for 2046-2065 and 2081-
2100, relative to 1986-2005, is illustrated using both RCP2.6 and RCP8.5 situations. The RCP2.6 for
temperature shows nominal change and the RCP8.5 shows major temperature increase. The RCP2.6 for
4precipitation shows nominal change and the RCP8.5 shows more precipitation in the North and less in
the South.
Figure 2: Changes in average temperature and precipitation projections in North America
(Romero-Lankao et al., 2014)
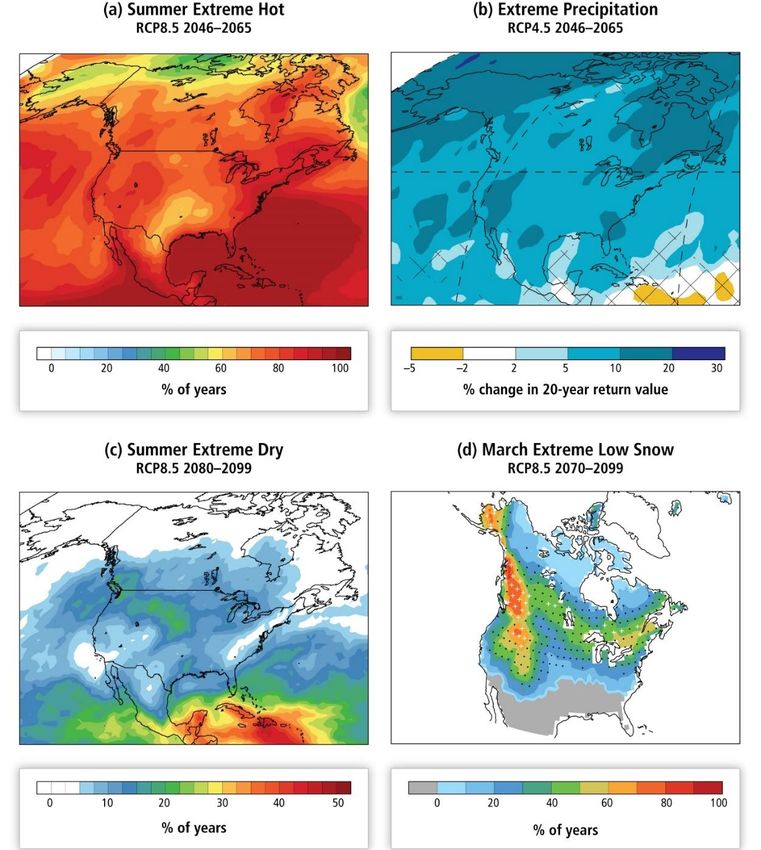
Precipitation
The Intergovernmental Panel on Climate Change (IPCC) has found an increase in precipitation
since 1901 in mid-latitude land areas, and that there are likely more areas where there has been an
increase in the amount of heavy precipitation events rather than decrease (Hewitson et al., 2014). As
5shown in Figure 3 (b), most of North America will “exhibit very likely increases of 5 to 20% in the 20-year
return value of extreme precipitation by the mid-21st-century”, using a RCP4.5 which is a potential
scenario focused on stabilization (Romero-Lankao et al., 2014).
Figure 3: Extreme weather projections in North America
(Romero-Lankao et al., 2014)
Adaptation
Climate change adaptation is critical to managing risks, and there has been an increase in effort
to implement adaptation processes among planners in the government. This effort has led to realization
6of the challenges including “the adequacy of informational, institutional, financial, and human
resources, and lack of political will” (Romero-Lankao et al., 2014, p. 1445). In North America, responses
to extreme events have been incremental, but adaptation is more evident at the municipal level of
government. At federal, provincial and municipal levels of government, there are three main challenges
facing climate change adaptation: economic resources, information and social capital and participation
(Romero-Lankao et al., 2014).
Canada
Similarly to the rest of the world, Canada’s climate has shifted over the past century. It is
evident that anthropogenic climate change is influencing climate trends and that these trends are
affecting natural systems (Vasseur & Catto, 2008). There have been changes in temperature, frequency
and intensity of storms, sea level rise, ice melt, and changes in precipitation. In certain parts of Canada,
data has been collected for more than a century, and since the mid-twentieth century in others (Warren
& Egginton, 2008).
On average, temperatures in the country have risen by more than 1.3°C since 1948, which is
twice as much as the global average (Vasseur & Catto, 2008). Temperature changes have been observed
across the country, with the greatest temperature increases occurring in the North and the rest of the
country experiencing increasing temperatures in more recent years.
Precipitation is more difficult to measure, as it is not continuous, and it exists in various states.
However, overall precipitation in Canada has increased approximately 12% over the past half century, as
shown in Figure 4 (Warren & Egginton, 2008). The IPCC states that there has been an increase in
precipitation in Canada between the mid-20th and early 21st century and there is the likelihood that
these increases will continue in areas north of 45°N later in the 21st century, including winter
precipitation (Romero-Lankao et al., 2014).
The map in Figure 5 shows the “regional distribution of linear annual precipitation trends (%
change) observed across Canada between 1948 and 2003” (Warren & Egginton, 2008, p. 45). The
majority of the country has experienced an increase in precipitation between 5% and 35% with the
Arctic experiencing the most extreme increase.
7Figure 4: Trends in annual departures of average annual precipitation in Canada, from the 1951 to 1980 normals
(Warren & Egginton, 2008)
Figure 5: Annual precipitation trends in Canada between 1948 and 2003
(Warren & Egginton, 2008)
Certain parts of the country have experienced a greater increase in spring and autumn
precipitation while others have experienced a decline in winter precipitation, as shown in Figure 6.
These maps denote the changes in participation in each season since 1950. The amount of change (in
millimetres) is indicated by the size of the circle. Brown circles show a decrease in precipitation and
green circles show an increase in precipitation (Warren & Egginton, 2008).
8Figure 6: Seasonal change in precipitation in Canada since 1950
(Warren & Egginton, 2008)
From 1950 to 2003 there have been changes in the frequency of precipitation, including, “more
days with precipitation, decrease in mean amount of daily precipitation, decrease in maximum number
of consecutive dry days, decrease in annual total snowfall (southern Canada), and increase in annual
total snowfall (northern and northeastern Canada)” (Warren & Egginton, 2008, p. 45). Based on data
collected from 1961-1990 and climate change models, the following maps show seasonal change in
precipitation by the 2050s (Figure 7). Excluding a decrease in precipitation in the southwestern part of
the country, all of Canada will experience an increase in precipitation each season.
9Figure 7: Seasonal change in precipitation in Canada by the 2050s
(Warren & Egginton, 2008)
Atlantic Canada
Atlantic Canada will experience an increase in temperature and precipitation, as will the rest of
Canada. From 1948 to 2005 there has been a temperature increase of 0.3°C (Vasseur & Catto, 2008).
There has been an increase in precipitation across Atlantic Canada of approximately 10% from 1948 to
1995, and further into the 1990s (Vasseur & Catto, 2008). Figure 5 and 6 support this, as they display an
increase in precipitation in Atlantic Canada. Figure 7 supports that this trend will continue until the
2050s, as it displays an increase in precipitation in the region. There is evidence supporting a trend
towards more extreme and frequent severe weather events including winter rain and thaw events and
flooding (Vasseur & Catto, 2008). Events that currently occur every 20 years will occur every 10 to 15
years by 2050 (Mladjic et al., 2011).
Flooding
Flooding can occur from changes in “seasonality, intensity, magnitudes, and types of
precipitation events”, as well as other aggravators (Burrell, 2012, p. 4). In many cities flooding is
becoming more prevalent, due to intense precipitation, snowmelt, ice jams, and warm-season
thunderstorms (Romero-Lankao et al., 2014). However, “changes in the magnitude or frequency of flood
10events have not been attributed to climate change”, as they are also caused by various factors including
land use and urbanization (Romero-Lankao et al., 2014, p. 1456). There are projected increases in
flooding, and although it is not solely attributed to climate change, it requires attention. Another reason
the frequency and magnitude of floods has yet been attributed solely to climate change is due to the
lack of long-term records. “However, recent detection of increasing trends in extreme precipitation and
discharges in some catchments implies greater risks of flooding on a regional scale” (IPCC, 2014, p. 53).
40% of natural disasters worldwide are floods and there has been an increase in reported
flooding in recent decades (Owrangi et al., 2014). In Canada, flooding is the most common and the most
expensive, natural disaster (Buttle et al., 2016). In the 20th century, flooding was the cause of at least
198 deaths and several billion dollars of damage, and unless policy and infrastructure design are
transformed, flood damages will increase (Burrell, 2012).
65% of flood disasters are caused by snowmelt runoff, storm rainfall, or the combination of the
two (Burrell, 2012). Flooding can occur year-round in Canada, although the cause of the flooding may
vary based on the season. During the spring and early summer, floods are often caused by snowmelt
and ice jams, while flash floods due to rain occurs in the summer. The short-duration events caused by
rain are more common and intense in the southern regions of Canada (Buttle et al., 2016). Figure 8
shows flood disasters across the country between 1990 and 2013 and differentiates the causes.
The Canadian Disaster Database collects data on all national disasters, including floods, however
“the methodology used to populate this dataset is unclear and inconsistent” (Ebbwater Consulting,
2015, July 13). This database only collects information on significant disasters, so does not include any
minor flooding incidents.
11Figure 8: Flood disasters in Canada between 1990 and 2013
(Buttle et al., 2016)
The Canadian Disaster Database considers a significant disaster to be one “which [conforms] to the
Emergency Management Framework for Canada definition of a "disaster" and [meets] one or more of
the following criteria:
- 10 or more people killed
- 100 or more people affected/injured/infected/evacuated or homeless
- an appeal for national/international assistance
- historical significance
- significant damage/interruption of normal processes such that the community affected cannot
recover on its own (Public Safety Canada, 2015).
Although data is lacking, the information displays a significant trend; flooding has increased over the
past 100 years. Between 1900 and 1909 there were only 3 significant floods, while between 1990 and
1999 there were 57 (Ebbwater Consulting, 2015, July 13). Figure 9 displays the number of significant
floods in Canada from 1900 to 2012, as collected by the Canadian Disaster Database.
12Figure 9: Significant floods in Canada between 1900 and 2012
(Ebbwater Consulting, 2015, July 13)
In Atlantic Canada, flood hazards are projected to increase due to climate change, and
precautionary measures are required (Burrell, 2012). Inland flooding – flooding occurring in non-coastal
areas – is common in Atlantic Canada and can be caused by heavy rainfall, sudden thawing of snow and
ice and infrastructure failure. Figure 8 displays a high number of flooding occurrences in Atlantic Canada,
specifically in Nova Scotia, with various causes. Nova Scotia is marked on the same map in Figure 10 for
context.
Figure 10: Flood disasters in Canada between 1990 and 2013, with Nova Scotia marked
(Buttle et al., 2016)
13Urban Flooding
Urban flooding can be defined as occurring, “when water is not absorbed into the ground,
and/or when volumes exceed storm water system capacity, forcing water to flow overland… [and some]
also include sewer backups, combined sewer outflows, and sewage treatment plant by passes…when
these are…caused by heavy rainfall” (Rain Community Solutions, 2017, March, p. 5). Flooding is being
exacerbated by urbanization of land, as it results in alterations to the natural land use, in turn affecting
the natural flow of precipitation. “Urbanization can enhance or reduce precipitation, depending on
climate regime; geographical location; and regional patterns of land, energy and water use. Urbanization
also has significant impacts on flood climatology through atmospheric processes tied to the urban heat
island (UHI), the urban canopy later (UCL), and the aerosol composition of airsheds” (Romero-Lankao et
al., 2014, p. 1471).
Over the last 200 years the human population has increased substantially, with over half the
population currently living in urban areas and an expected 6.4 billion people living in urban areas by
2050 (Owrangi et al., 2014). Humans are changing the land cover and dramatically increasing the
amount of impervious surfaces. The creation of urban infrastructure, such as roads and buildings,
increases the amount of impermeable surfaces which leads to stormwater runoff. The development of
impermeable surfaces due to urbanization can increase the possibility for urban flooding, as a number of
studies have shown (Burrell, 2012; Jung, Chang & Moradkhani, 2011). Stormwater-related flooding is a
global concern, with a survey showing that over 65% of respondents from 468 urban municipalities from
Africa, Asia, Australia, New Zealand, Europe, Latin America, the United States, and Canada expect an
increase in climate change induced stormwater runoff (Sandink, 2013).
There have been few studies, however, on the combination of climate change and varying
amounts of urban development (Jung, Chang & Moradkhani, 2011). Urban flooding occurs due to
geophysical characteristics of an area, the urban infrastructure, stormwater systems, and the climate, so
as there are multiple factors affecting the potential for urban flooding to occur, each must be
considered when studying flooding (Jung, Chang & Moradkhani, 2011).
Urban Flooding in Canada
Urban flooding is a growing concern in Canada, as the urban population has steadily increased
over the past 60 years, with 81% of the population now living in urban areas (at the time of the 2011
census) (Buttle, et al., 2016; Sandink, 2016). Cities across the country are experiencing severe flooding,
14with some experiencing multiple urban flooding events in a short amount of time. In a Canadian study of
26 municipalities, 60% reported a precipitation increase due to climate change (Sandink, 2013).
Stormwater Management
“Water management infrastructure in most areas of North America is in need of repair,
replacement, or expansion” (Romero-Lankao et al., 2014, p. 1456). Initially, in attempts to control
surface runoff from precipitation, sewer networks were created. The most common system in Canada is
a combined sewer system, which uses underground pipes to collect the runoff and carry it along with
wastewater to a sewage treatment facility, where it is treated and then discharged into a body of water
(Buttle et al., 2016). Most communities built prior to the 1950s have combined sewer systems, and
although newer developments may have separate sewer systems for runoff, they often lead to a
combined system.
These combined systems and other types of urban piped systems can be overwhelmed and
cause flooding (Buttle et al., 2016). Existing underground stormwater infrastructure is designed to
accommodate 1 in 5 year rainfalls with overland flow routes designed for 1 in 100 year rainfalls
(Sandink, 2013).
[In Canada], it is expected that an increase in magnitude of short (i.e., 1-day) and longer (i.e., 7-
day) duration precipitation extremes will have severe implications for various water resource-
related development and management activities such as combined sewers, flood control in fast
responding areas, and water storage systems. (Mladjic et al., 2011, p. 2583)
Most drainage systems are designed to cope with rainfall events with a 30-year return – those
expected to occur every 30 years – but due to an increasing amount of intense rainfall, the sewer
capacity will be exceeded, leading to flooding (Buttle et al., 2016).
Three historical eras of stormwater management in Canada were created by Hulley et al. and
Watt et al. to summarize the progression to where we are currently. The Storm Sewer Era (1880-1970)
involved a sewer network for transporting stormwater from urban areas to downstream rivers and
lakes. The capacity for these was typically between 1 in 2 and 1 in 10-year return periods. The
Stormwater Management Era (1970-1990) involved stormwater ponds and major overland systems
holding water when the minor sewer network was exceeded, and these major systems were designed
for 1 in 50 to 1 in 100 year returns. Finally, the Urban Stormwater Best Management Practices Era
15(1990-current) focuses on efforts to reduce pollution rather than focus solely on quantity (Sandink,
2016).
In urban planning, it is common to deal with drainage after other issues have been addressed,
rather than integrating it into planning policy and processes (Cettner et al., 2013). It is often viewed as a
technical problem, and as space is limited and design must coordinate with other areas of development,
it is crucial to have effective communication and an interdisciplinary approach. Although traditional
methods of stormwater management are common, they are being questioned for their unsustainable
methods (Cettner et al., 2013).
Combined Sewer Systems in Canada
Combined sewer systems are common in cities across Canada, however detailed data is not
available on the proportion of combined sewer systems versus separated sewers (Government of
Canada, 2013). Many were created in the mid-1900s and there has since been concerns about the
environmental impact. Many combined sewer systems, especially those developed prior to the 1940s,
have Combined Sewer Overflows (CSO) in place, which allows excess water to flow directly into a water
body (Government of Canada, 2013).
Certain cities understand the environmental impact of CSO’s and have developed, or are
developing, methods to change the process. In Edmonton, Alberta, 900km of pipes connect to a
treatment plant, and in order to prevent flooding during severe weather events, a CSO is in place,
allowing excess water to overflow into a river (EPCOR, 2017). In attempt to reduce the overflow, storage
tanks with a capacity of 25 million litres are being constructed and the connections between wastewater
and stormwater pipes are being eliminated (EPCOR, 2017). Ottawa, Ontario has combined sewer
systems, and aims to substantially reduce the amount of CSO’s by constructing reservoir tunnels inside
the system, designed to capture and contain overflow until the system can handle it (Stantec, n.d.).
Combined sewer systems and water treatment plants were constructed in Toronto, Ontario in the early
1900s. In the 1970s it was decided they were inadequate and newer parts of the city contain separated
sewers (City of Toronto, n.d.).
Urban Flooding Instances in Canada
Canada has recently experienced drastic flooding events across the country, with infrastructure
and changes in climate influencing the severity of the floods. Some of these cities have made the effort
to prepare for flooding and mitigate the effects. As Canada’s largest city, Toronto, Ontario is highly
16urbanized and, “experienced major flooding due to extreme rainfalls in 2000, 2005, and 2013” (Buttle et
al., 2016). In 2005, the intense rainfall caused flash flooding and damaged trees, parks, homes and
roads. Toronto has existing policies and programs that address flooding, including Ahead of the Storm:
Preparing Toronto for Climate Change (2008); The Wet Weather Flow Master Plan (2003 plus
amendments); the Basement Flooding Protection Subsidy Program; and the Flood Warning Forecast, and
policies that address stormwater management, including The Green Roof Pilot Incentive Program; A
Commitment to Double the Tree Canopy; The Green Development Standard; and Green Parking Lots
(Toronto Environment Office, 2008).
Ottawa, Ontario has been praised for its level of flood preparedness in a study conducted by Co-
operators Insurance and the University of Waterloo, receiving the highest grade of the fifteen cities
studied (Feltmate & Moudrak, 2015). However, since the time of the study, Ottawa has experienced
severe floods due to high amounts of rainfall (CTV News, 2017, October 30). In the spring of 2017
Ottawa had record-breaking flooding from snowmelt and increasing soil saturation. Throughout April
and May there were numerous days of rainfall, including those with 16 millimeters, 30 millimeters, 40
millimeters, and 55 millimeters, with 120mm of rain falling between May 1 to May 8. This led to
evacuations, hospital surgery cancellations, and military troops deployed (CBC News, 2017, May 14).
Peterborough, Ontario has been subject to flooding events since the early 2000s. In 2002, 73mm
of rain fell within 24 hours, causing widespread flooding. It was considered to be a 1 in 100 year rainfall
event. In 2004, Peterborough received 229mm of rain in 24 hours, including 87mm during one hour,
causing extensive flooding. This was considered to be a 1 in 290 year event. After these events the City
created a Flood Reduction Master Plan (Oulahen, 2008).
In 2013, Calgary, Alberta experienced flooding that forced approximately 100,000 people from
their homes and caused $6 billion in damage (The Canadian Press, 2014, June 20). Since the disaster,
experts have created 27 recommendations for the city, and as of June 2017, all recommendations had
begun and half were complete. These mitigation projects include stabilizing riverbanks, improving a
wastewater treatment plant, and improving bridges (Maclean, 2017, June 20).
Urban flooding has been occurring at varying intensities across Canada in recent years. The
combination of urbanization and climate change is expected to continue this pattern of flooding events.
Certain cities are creating policies and working towards completing flood mitigation efforts, but many
are working reactively and in response to a flooding event.
17Approach and Methods
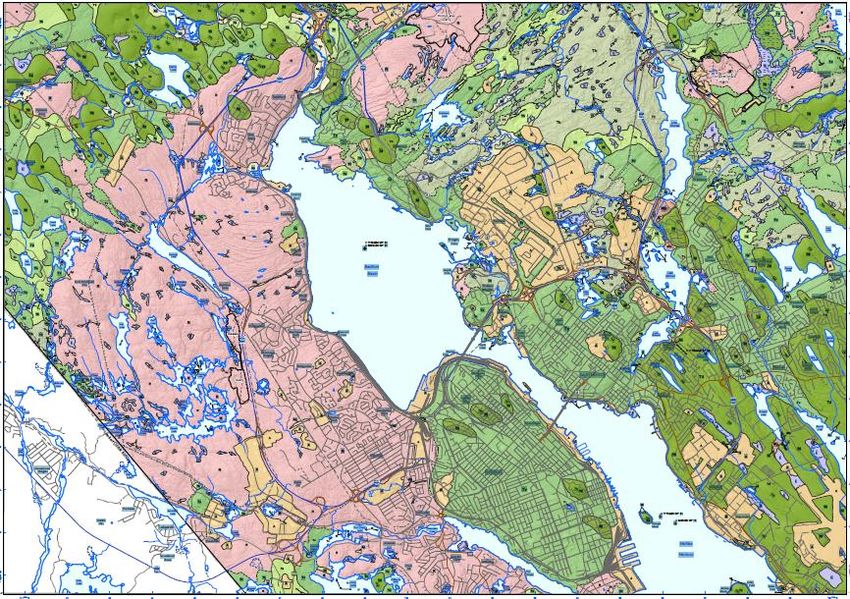
The aim of this research is to gain insight into urban flooding in Halifax, understand the level of
severity and concern, and to determine if policy documents are addressing the issue. This study focuses
on both the Halifax Regional Municipality and the city of Halifax, with some emphasis placed on the
Halifax peninsula. Figure 11 shows the Halifax Regional Municipality highlighted in red on the map to the
left, and the map to the right shows the city of Halifax highlighted in red, including the peninsula. The
wide scope of this study is due to the fact newspaper articles, weather and climate data, academic
articles, and government websites often use “Halifax” as a generic name for any one of these areas and
do not always specify. Some data sources are site specific, but as some are for the municipality, some
are for the city, and some are for the peninsula, the variability makes it difficult to focus on one specific
area. For example, some municipal planning documents refer to the Halifax Regional Municipality, while
some newspaper articles focus solely on the peninsula. The Halifax Regional Municipality has recently
re-branded as Halifax, but for ease of understanding, I will still use the Halifax Regional Municipality.
Figure 11: Map of Halifax
(Google Maps, 2017)
Why Halifax?
I chose to study Halifax because of the history of its sewer system and recent stormwater
system changes, it’s topography, location, and recent, reported flooding events. Halifax is located in a
central area along the southern shore of Nova Scotia, with a landscape consisting of drumlins as a
primary geological feature, as shown in Figure 12. The areas of dark green are drumlins, which are found
on the mainland and the peninsula, creating hill formations. The combination of drumlins and the
18peninsula creates a unique landscape, with a topography that varies between 10 meters and 71 meters
above sea level on the peninsula, and higher on the mainland, as shown in Figure 13 (Natural Resources
Canada, 2017).
Figure 12: Geological features of Halifax
(Utting, 2011)
19Figure 13: Topography of Halifax
(Natural Resources Canada, 2017)
The Halifax peninsula has only six main points of access: three roads, two bridges and a ferry
terminal, which is a notable feature when thinking about extreme weather events and any need to
evacuate. Although Halifax is a coastal city, this study does not focus on coastal flooding, rather inland
flooding. The majority of research conducted on flooding in Halifax concentrates on coastal flooding and
this study aims to shift the focus. In recent years, inland, urban flooding has been reported across
Canada, including Halifax, with an increasing frequency of flood-related news stories.
Although there is some uniqueness to Halifax in terms of topography and location, Halifax has a
stormwater system typical to Canada: a combined sewer system. The system combines wastewater and
stormwater and delivers it to a wastewater treatment facility. The facility was constructed in 2008,
which is noticeably later than other cities in Canada.
Methods
I used exploratory research methods and a mixed-methods approach of qualitative and
quantitative research in four stages, which were completed simultaneously. The first stage involved
direct observation and data collection. The second stage involved a document review of municipal
policies, newspaper articles and websites. The third stage involved interviewing six professionals in
20Halifax whose work or interests relate to urban flooding. The final stage was to analyze the collected
data to understand if flooding is an issue in Halifax and whether policy addresses it. I used inductive
reasoning; I did not begin the research with a hypothesis and did not make initial assumptions (Palys &
Atchison, 2008).
Direct Observation
In order to understand the impacts and severity of urban flooding in Halifax, I analyzed the area
through direct observation. Through existing personal experience and research on locations where
flooding frequently occurs, I chose areas to observe on days when precipitation occurred. The main
method of data collection was photography, as photographs provide visual data of the effects and
location of flooding. I recorded the date of the site visits and collected data on the amount of
precipitation that fell those days. Using this information, I compared the levels of precipitation to
average levels of precipitation and levels when other flooding events occurred.
Document Review and Data Analysis
In collaboration with qualitative data from observation, I collected quantitative data. I read
newspaper articles to gather information on past flooding events, and explored other websites and
documents to understand Halifax topography and built environment, flooding in Nova Scotia and
Halifax, and Halifax’s stormwater management system. It is important to understand the existing
stormwater management systems and if they are adequately handling precipitation levels. I used the
Government of Canada website to gather past weather conditions and historic climate data to
understand precipitation patterns. I completed a policy review of municipal documents to understand if
urban flooding and stormwater management is being addressed with current policy.
I analyzed a variety of policies including overarching planning documents, climate-specific
guiding documents, and those currently in a draft stage. I chose these documents because they pertain
to climate change or stormwater management; they are an existing planning document; or because they
are currently being developed. In order to review policy documents, I created an Excel spreadsheet
where I collected information from the following documents: Centre Plan (Draft), Halifax Green Network
Plan (Draft), ClimateSMART: Climate change risk management strategy for HRM (2007), Halifax Regional
Municipal Planning Strategy (2014), Halifax Municipal Planning Strategy (2017), Halifax Peninsula Land
Use By-law (2017), Halifax Stormwater Management Guidelines (2006), and Municipal Climate Change
Action Plan (2013). There are more specific planning documents for Community Plan Areas within
21Halifax, but there are over 20 and the Halifax Regional Municipal Planning Strategy and the Halifax
Municipal Planning Strategy encompass these areas. I collected data on the year the policy was created;
the page length; the issues addressed; how often words related to flooding are referenced; the detail to
which urban flooding is addressed; and if the document uses wording which requires and prohibits, such
as “must” or “will”, or wording which offers recommendation, such as “should” or “may”.
Interviews
I conducted three interviews with contacts from a professional firm, an environmental non-
profit organization, and academia. The interviewees were selected to gather a wide perspective on
flooding issues in Halifax, from those who work in different sectors. The first interview was with Glenn
Woodford, a Senior Engineer at Design Point Engineering and Surveying; the second interview was with
Camilla Melrose, a Water Programmer at Clean Foundation, a province-based non-profit organization;
and the third was with Dr. Peter Duinker, a professor at Dalhousie University and two of his colleagues –
Dr. James Steenberg, a Post-Doctoral Fellow and David Foster, a Research Associate.
The interview questions were structured into the following sections: who the interviewees are,
general Halifax flooding, Halifax policy and initiatives, and the future of urban flooding in Halifax. The
interviewees were asked the same questions, and were guided to stay on topic, yet were provided with
ample opportunity to discuss the questions and related topics. Not all interviewees were asked all of the
questions if there was a time constraint or the answer had already been provided through the
conversation. The interviews ranged from 15 minutes to 1.5 hours in length. The interview questions can
be found in Appendix A.
22Findings
Flooding in Nova Scotia
In recent years, cities and towns throughout Eastern Canada have been flooding. In 2017
specifically, there were record-breaking amounts of rain. Environment Canada’s senior climatologist
states there was two-and-a-half to three times the amount of rain, specifically in April 2017 (Gajewski,
2017, May 6). Normal rainfall for that time of year is usually around 75mm per month, yet in 2017 some
areas received over 200mm of rain in a month. Not only is increasing amounts of rain an issue, but much
of our urban fabric is impervious, reducing the places where this rainfall can be absorbed into the
ground. The senior climatologist states, “we’ve removed the green infrastructure and replaced it with
grey infrastructure…so when that raindrop falls, it become[s] immediately a flood drop” (Gajewski,
2017, May 6, para. 8).
Flooding in Nova Scotia can be difficult to predict; “the frequency and severity of any flood
event is governed by a complex interaction of weather events, local geography and human factors”
(Government of Nova Scotia, 2016, para. 2). As the climate is changing and weather events are
intensifying, the risks and impacts of flooding are expected to increase. As a project between Dalhousie
University, Nova Scotia Environment, The Chronicle Herald, the School of Information Management, and
the Institute for Big Data Analytics at Dalhousie University, a database containing historic records of
flooding in Nova Scotia between 1992 and 2015 has been created. The database contains events
reported by The Chronicle Herald, which are mapped, and listed with the year, location, and a brief
story. Figure 14 displays the map of these flooding events. The blue points display winter flooding
events, the green display spring, the red display summer, and the yellow display autumn. Figure 15
shows a map of historical floods from 1758 to 1987. The data for this map is from a document titled
“Flooding Events in Nova Scotia: A Historical Perspective.” By A.D. Kindervater.
23Figure 14: Flooding in Nova Scotia between 1992 and 2015
(Mathstat, n.d.)
Figure 15: Flooding in Nova Scotia between 1758 and 1987
(Mathstat, n.d.)
24The comparison of these maps shows the difference between the amount of flooding events in
Nova Scotia in the past and in more recent years, with recent years showing substantially more floods.
Although these maps show a pattern, the accuracy may be limited, as the data is only obtained from two
sources, and flooding may not have been recorded as frequently in the past. However, the clustering of
points around Halifax, on both maps, show the high amount of flooding events occurring, and that they
occur in all seasons.
Precipitation Patterns in Halifax
Halifax is located on the coast, and climate change is expected to have major effects on coastal
communities. Sea-level rise is a major risk, but more intense and frequent extreme weather events, such
as flooding are also expected. Due to an atmospheric current from the south and northwest that are
more intense in the winter, heavy snow and rain, winter thaws, and ice storms are increasingly common
(Halifax Regional Municipality, 2007).
As increased precipitation can be a contributing factor to flooding, it is important to understand
existing patterns. I collected climate data from the Government of Nova Scotia website of monthly
precipitation patterns in Halifax, and compared historical and projected precipitation patterns for
Halifax and Nova Scotia. Figure 16 shows the amount of precipitation received each month between
2014 and 2017, and includes historical amounts for comparison. I chose 2014 as the date to begin data
collection because noteworthy cases of urban flooding in Halifax have been documented since 2014.
The research for this project was completed in autumn of 2017, therefore no data was collected past
September 2017. It is important to note that this data is all precipitation, not solely rainfall.
This data shows varying patterns and alludes to the unpredictability of precipitation. The graph
illustrates the regular precipitation patterns of lower precipitation in the summer and higher amounts of
precipitation in the winter. Historical precipitation amounts are often higher than 2017 data, alternating
between higher and lower than 2016 data, and lower than 2014 and 2015 data.
There are certain months with high precipitation that correspond with flooding events occurring
in Halifax. These events occurred in October 2014, December 2014, February 2015, March 2015, April
2015, December 2015, and October 2016. Each of these had higher amounts of precipitation that
historically measured, except October 2014. October 2014 had less precipitation than historically
measured, and less precipitation than 2015 and 2016; this flooding event happened to occur from a
single afternoon of rain (CBC News, 2014, October 24).
25Figure 16: Amount of monthly precipitation in Halifax between 2014 and 2017
Precipitation (mm) in Halifax
350
300
Precipitation (mm)
250
200
150
100
50
0
J F M A M J J A S O N D
Month
Historical (1981-2010) 2014 2015 2016 2017
(Government of Canada, 2017c)
December 2014 is shown to have received double the amount of precipitation compared to
historical data. February 2015 received more precipitation than other years, by approximately 40 mm.
March 2015 received approximately the same amount of rain as historically received, and slightly less
than the previous year. Precipitation in the month of April has been fairly steady and April 2015
precipitation data is not unique. In December 2015, Halifax received slightly more precipitation than the
historical average, and substantially less than the previous year. In October 2016, Halifax received
approximately 60 mm more precipitation than the historical average. These flooding events are
discussed again, later in this section. There are other months from this data set that received
substantially more precipitation than usual, that do not have reported flooding events, including May
2017, June 2015, and October 2015.
In order to gain a greater understanding of the precipitation patterns, I compared data on the
amount of precipitation, to data on the amount of days of precipitation, as shown in Figure 17.
26You can also read