Urban PM2.5 levels under the EU Clean Air Policy Package
←
→
Page content transcription
If your browser does not render page correctly, please read the page content below
Service Contract on
                             Monitoring and Assessment
                      of Sectoral Implementation Actions
                            070307/2011/599257/SER/C3

                      Urban PM2.5 levels
                                  under the
                                EU Clean Air
                             Policy Package

                                          TSAP Report #12
                                               Version 1.0

                   Gregor Kiesewetter and Markus Amann
International Institute for Applied Systems Analysis IIASA

                                            October 2014
The authors
This report has been produced by Gregor Kiesewetter and Markus Amann, working at the International
Institute for Applied Systems Analysis (IIASA), Laxenburg, Austria.

Acknowledgements
This report was produced under the contract ‘Services related to the assessment of specific emission
reduction scenarios at EU and Member State level, notably reflecting national positions, the interaction with
climate policy, and possible flexible implementation mechanisms’, Specific Contract No.
070307/2013/666175/FRA/ENV.C.3                implementing                 Framework                 contract
No ENV.C.3/FRA/2013/0013‐IIASA of DG‐Environment of the European Commission.

Disclaimer
The views and opinions expressed in this paper do not necessarily represent the positions of IIASA or its
collaborating and supporting organizations.
The orientation and content of this report cannot be taken as indicating the position of the European
Commission or its services.
Executive Summary
Fine particulate matter with a diameter below 2.5µm (PM2.5) poses a significant threat to
human health. Current PM2.5 levels significantly exceed safe levels as defined by the WHO in
many European cities, leading to a shortening of life expectancy of several months.
Ambient PM2.5 is composed of a variety of components, originating from local emissions as well
as transboundary transport of pollution from natural as well as anthropogenic activities of many
economic sectors. While primary PM is mainly emitted from traffic and household combustion,
secondary PM is predominantly formed from precursor emissions from agriculture, industrial
and traffic sources.
This report quantifies source contributions to urban PM2.5 levels in the EU Member States, using
the station‐based modelling approach that has recently been added to the GAINS modelling
suite (Kiesewetter et al. 2013). For every urban roadside air quality monitoring station covered
by the model, the approach disaggregates modelled PM2.5 into chemical, sectoral and spatial
categories, encompassing sources of natural dust, transboundary transport of pollution, national
emissions, urban emissions, and local traffic emissions.
This report compares ‐ for Member States that have reported sufficient monitoring data to
AIRBASE ‐ the current levels of PM2.5 with the situation expected in 2030 under the Clean Air
Policy Package that has been proposed by the Commission in December 2013. In many cases, the
current transboundary contribution to PM2.5 already exceeds the WHO guideline values, so that
uncoordinated national actions of individual Member States will not be sufficient to attain the
WHO guideline value. The measures suggested by the Clean Air Policy Package would lead to a
decrease of urban roadside PM2.5 concentrations by roughly a factor of two, and even more in
some Member States. Most Member States would reach levels close to or even below the WHO
standards of 10µg/m3, and well below the current EU target value (which will be transformed
into a limit value in 2015) of 25µg/m3.

                                                                                              Page 1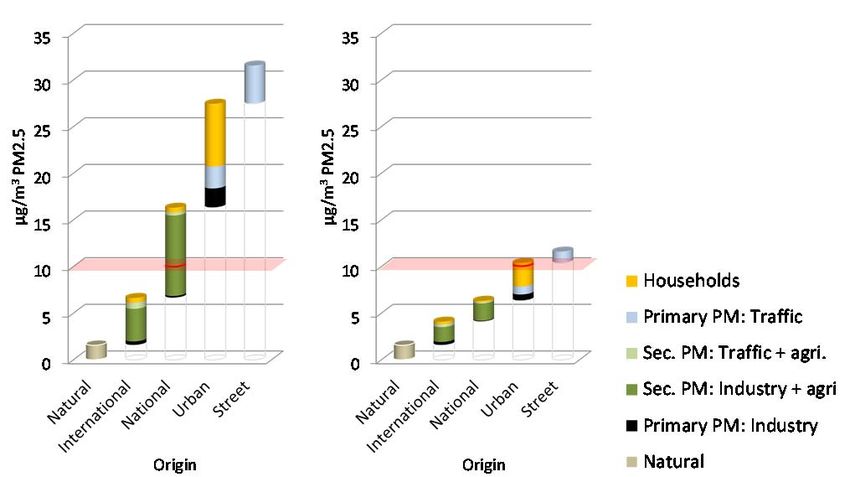
List of acronyms

CLE           Current legislation
EU            European Union
GAINS         Greenhouse gas ‐ Air pollution Interactions and Synergies model
IIASA         International Institute for Applied Systems Analysis
kt            kilotons = 103 tons
µg/m3         micrograms per cubic meter
NH3           Ammonia
      +
NH4           Ammonium
NMVOC         Non‐methane volatile organic compounds
      ‐
NO3           Nitrate
NOx           Nitrogen oxides
PM10          Fine particles with an aerodynamic diameter of less than 10 µm
PM2.5         Fine particles with an aerodynamic diameter of less than 2.5 µm
PPM           Primary Particulate Matter
PRIMES        Energy Systems Model of the National Technical University of Athens
SNAP          Selected Nomenclature for Air Pollutants; Sector aggregation used in the CORINAIR emission
              inventory system
SIA           Secondary Inorganic Aerosol
SO2           Sulphur dioxide
      2‐
SO4           Sulphate
SOA           Secondary Organic Aerosol
TSAP          Thematic Strategy on Air Pollution
VOC           Volatile organic compounds

     Page 2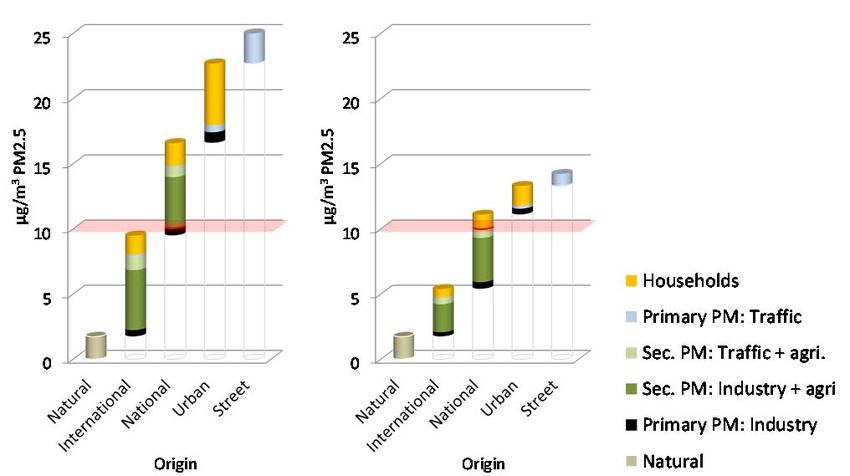
Table of contents

1     Introduction ................................................................................................................................................... 4

    1.1       Objective of this report ......................................................................................................................... 5

    1.2       Structure of the report .......................................................................................................................... 5

    1.3       Methodology ......................................................................................................................................... 5

2     Source contributions to PM2.5 ...................................................................................................................... 7

    2.1       Spatial origin of PM2.5 at background stations .................................................................................... 7

    2.2       Sectoral‐spatial source attribution of PM2.5 at urban traffic stations ................................................. 8

3     Discussion and conclusions .......................................................................................................................... 20

More information on the Internet
More information about the GAINS methodology and interactive access to input data and results is available at
the Internet at http://gains.iiasa.ac.at/TSAP. All detailed data of the scenarios presented in this report can be
retrieved from the GAINS‐online model (http://gains.iiasa.ac.at/gains/EUN/index.login?logout=1). The
situation for 2009 is modelled using interpolated emissions from the scenario “PRIMES 2013 REF CLE” (in
scenario group “TSAP_Dec_2013”). The 2030 Commission Proposal is listed in GAINS online as “B7 2030‐
Commission Proposal” and described in detail in Amann et al. 2014.
The graphs presented in this paper can also downloaded as a Powerpoint presentation at
http://www.iiasa.ac.at/web/home/research/researchPrograms/MitigationofAirPollutionandGreenhousegases/
TSAP‐reports.en.html.

                                                                                                                                                           Page 3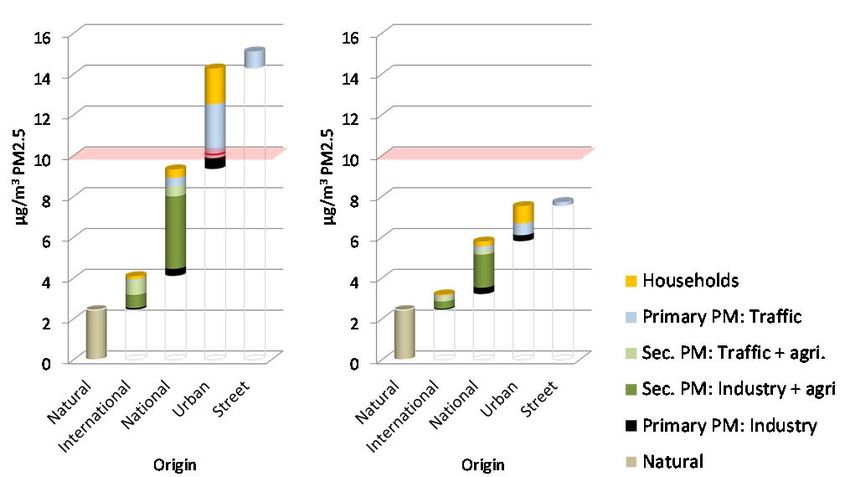
1     Introduction
Exposure to fine particulate matter has been shown       the atmosphere from precursor gases through well‐
to have significant negative impacts to human            known chemical reactions. The main compounds
health (Pope III et al. 2002; 2011; WHO 2013). The       involved in the formation of secondary inorganic
Air Quality Directive (2008/50/EC) of the European       PM (or aerosol, SIA) are ammonium (NH4+), nitrate
Union (EC 2008) specifies limit values for ambient       (NO3‐) and sulphate (SO42‐), which are chemical
PM10, i.e., particulate matter with an aerodynamic       products of the precursor gases ammonia (NH3),
diameter
Contributions:   The GAINS model includes all economic sectors,
                                                            chemical components, and spatial scales necessary
                                           Street           for a comprehensive treatment of PM2.5 (Amann et
                                                            al. 2011). Recently a downscaling methodology has
PM2.5

                                           City
                                                            been introduced which allows for the assessment of
                                           National
                                                            PM at individual air quality monitoring stations
                                           Transboundary
                                           Natural
                                                            (Kiesewetter et al. 2013). The TSAP Report #11
                                                            included a quantification of health impacts due to
Figure 1.1 Build‐up of PM2.5 contributions from different
                                                            PM2.5, and estimates on the attainment of PM10
geographical origins.
                                                            limit values. PM2.5 concentrations have so far not
Sources of PM and PM precursor gases are found              been discussed explicitly. However, owing to the
throughout all economic sectors. Primary PM (PPM)           structure of the GAINS model, contributions to
is mainly emitted from combustion processes such            PM2.5 at each station are modelled individually and
as household heating, industrial combustion, or             hence are traceable.
diesel engines. Unit emissions vary strongly across
technologies and fuels used in each sector; e.g., PM
emissions from gasoline cars are much lower than            1.1       Objective of this report
those from diesel engines, and natural gas heating          This report presents an assessment of source
produces much lower PM emissions than coal                  contributions to PM2.5 levels at European
stoves. Of the precursor substances for secondary           monitoring stations. The present situation (based
aerosol, NH3 is almost exclusively emitted from             on the year 2009) is compared with the envisaged
agricultural processes (both animal husbandry as            result of the Commission proposal for 2030 as
well as fertilizing of fields), while SO2 is                discussed in TSAP Report #11 (Amann et al. 2014).
predominantly generated in the energy producing             We here focus on the attribution of PM2.5
industry, and NOx emissions are spread between              concentrations at urban roadside stations to the
the transportation, industry, and household                 source sectors and spatial contributions.
combustion sectors.
Recently the European Commission has proposed a             1.2       Structure of the report
Clean Air Policy Package with the aim to further
reduce the impacts of harmful emissions from                The remainder of Section 1 provides a brief
industry, traffic, energy plants and agriculture on         summary of the methodology. Section 2 presents
human health and the environment (EC 2013). The             the source allocation of PM2.5 concentrations in
package includes a new Clean Air Programme for              the European background and at urban traffic
Europe with measures to ensure that existing                monitoring stations. Results are discussed and
targets are met in the short term, and new air              conclusions are drawn in Section 3. A more detailed
quality objectives for the period up to 2030. The           technical explanation of refinements to the
package also proposes a revised Directive on                methodology is given in the Technical Appendix.
National Emission Ceilings with stricter national
emission ceilings for the six main pollutants, as well      1.3       Methodology
as a new Directive to reduce pollution from
medium‐sized combustion installations.                      This report employs the GAINS model system
                                                            developed under the EC4MACS (European
The proposal of the European Commission has been            Consortium for Modelling of Air pollution and
informed by quantitative modelling of baseline              Climate Strategies) project, which was funded
emissions and associated impacts, of the scope for          under the EU LIFE programme (www.ec4macs.eu).
further emission reduction options, and of cost‐            In particular, we use the station based methodology
effective emission reduction strategies with the            described by Kiesewetter et al. (2013; 2014a;
GAINS Integrated Assessment Modelling suite by              2014b), and apply it to PM2.5 levels at urban traffic
the International Institute for Applied Systems             stations.
Analysis (IIASA). An assessment of the effects of the
proposal on air quality in Europe has been provided
in the TSAP Report #11 (Amann et al. 2014).

                                                                                                        Page 5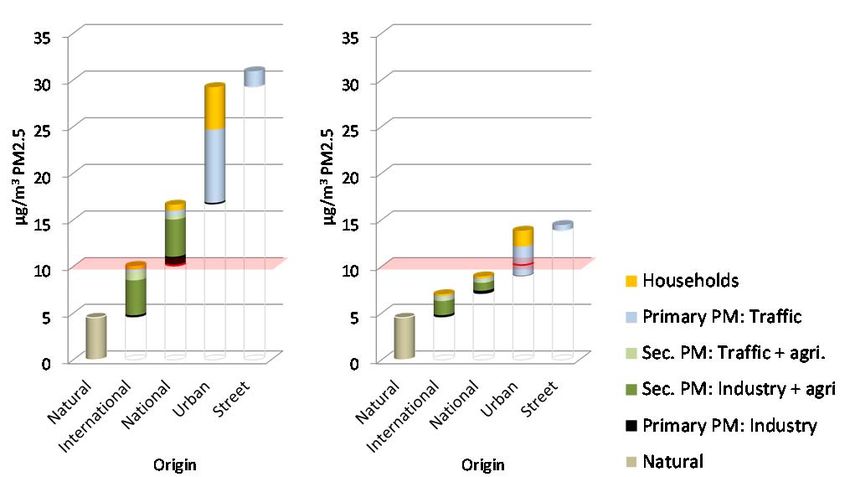
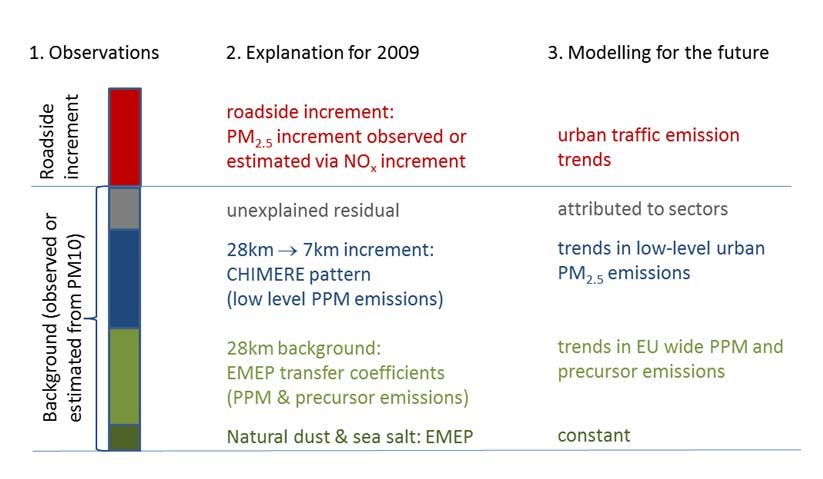
A schematic overview is shown in Figure 1.2. The with the CHIMERE CTM model. Thereby,
analysis combines bottom up emission modelling in unexplained residuals between bottom‐up
GAINS, simplified atmospheric chemistry and modelled and measured urban background
dispersion calculations, and observations reported concentrations have been allocated proportional to
to the AirBase database of the European the explained fractions, i.e., to their likely spatial
Environment Agency (EEA). and sectoral sources.
Measured urban background concentrations are At roadside stations, the additional PM2.5
explained to the extent possible with a linearised increment is derived from comparisons with related
atmospheric dispersion scheme based on source‐ background observations or, if unavailable,
receptor calculations with the EMEP model calculated from scaling the observed NOx roadside
(Simpson et al. 2012) at a resolution of 0.5°×0.25° increment with the appropriate ratio in emissions.
(approx. 28×28km2), and a more detailed, nested
Altogether, 1875 PM monitoring stations of all
simulation with the CHIMERE CTM model (Menut
types are covered in GAINS. This analysis is based
et al. 2013) at a resolution of approx. 7×7km2.
on 297 urban traffic stations that provide sufficient
In order to provide for a good coverage of stations monitoring detail to be included in GAINS (i.e.
throughout the EU, the analysis is done not only for PM2.5, PM10, NOx, etc), located in 21 Member
stations reporting PM2.5 in 2009, but includes all States. For the other Member States, insufficient
stations reporting PM10 and fulfilling the data data were available in 2009 to allow for the
coverage criteria to be covered by GAINS. The modelling of roadside stations. The full list of data
PM2.5 urban background concentration, either requirement criteria is available in TSAP Report #9
observed directly or estimated from observed (Kiesewetter et al. 2013).
PM10, is split into a regional component and an
A detailed explanation of the post‐processing
urban increment, based on the ratios of the
analysis is provided in the Technical Appendix.
28×28km2 concentrations modelled with the EMEP
model and the 287km scale increments produced
Figure 1.2. Overview of the PM2.5 station modelling scheme used in GAINS.
Page 6
2 Source contributions to PM2.5
As described above, the source allocation
calculations distinguish a large number of source 2.1 Spatial origin of PM2.5 at
sectors and countries of origin. However, for easier background stations
interpretation, the presentation in this report
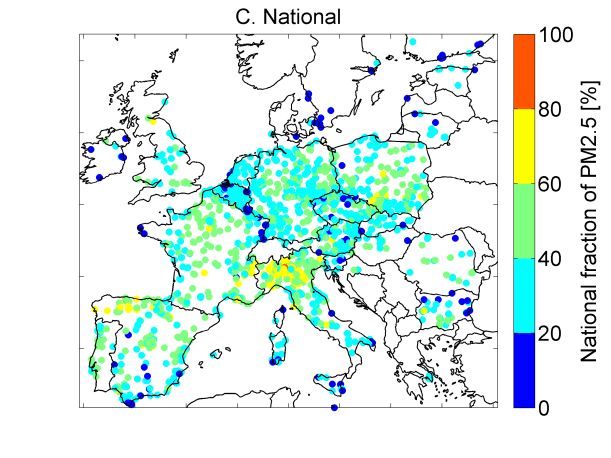
employs a more aggregated display: As an overview of the geographical origins of PM2.5
at rural and urban background stations, Figure 2.1
Spatial origin: shows the modelled relative spatial source
Graphs distinguish contributions from contributions to ambient PM2.5 at all stations
transboundary transport of pollution, national classified as background stations in AirBase. The
emission sources (outside a city), emissions within figures distinguish the four spatial source categories
the city, and traffic sources within the particular considered in this report: Natural (A),
street canyon. transboundary (B), national (C), and urban (D).
Sectoral contributions: Category C “national” contains contributions from
emissions in the same country where the station is
PPM is explicitly shown from industry (including
located, but excludes any local urban increment,
energy industry, industrial combustion, industrial
which is shown in category D. Natural, international
processes, solvent use, extraction and distribution
and national contributions together make up the
of fuels, waste management) and traffic (road and
regional background, i.e., the observed PM2.5 at
non‐road) sources.
rural background stations. The difference to PM
Secondary aerosol is split into contributions observed at urban background stations is assumed
involving industrial (SO2 and NOx) emissions and to originate from urban emission sources, and is
those involving traffic emissions (NOx). Both of displayed in the category “urban”.
these components combine with ammonia from the
Note that the percentages are relative to total
only source agriculture, hence these contributions
PM2.5 in 2009, i.e., to observed PM2.5 wherever
are attributed to “industrial + agriculture” and
available, or estimated from observed PM10
“traffic + agriculture” emissions respectively, to
otherwise (see Technical Appendix for details).
indicate the different sectors involved
Contributions from the domestic sector (mainly
household heating) are shown as totals, including
primary and secondary particles.
Page 7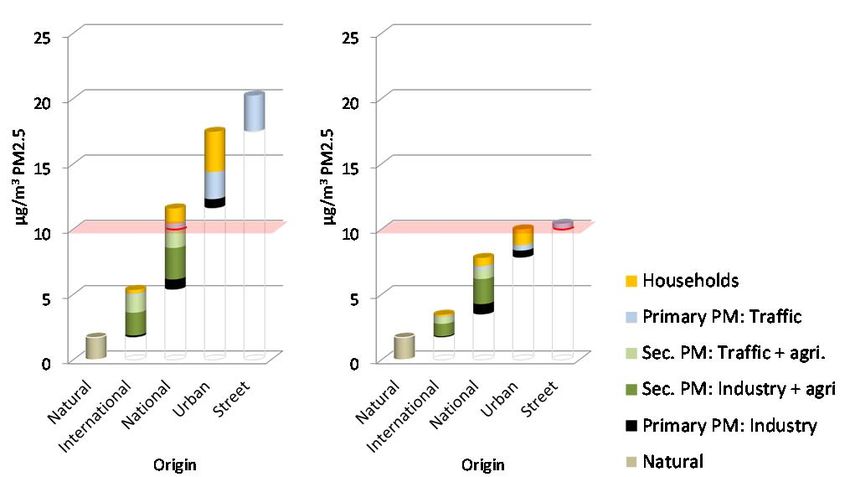
Figure 2.1. Spatial origins of PM2.5 at background monitoring stations covered by GAINS, shown as relative
fractions of total modelled PM2.5 at each station in 2009.
However, some Member States provide monitoring
2.2 Sectoral‐spatial source data for only a few urban traffic stations, while
attribution of PM2.5 at urban many more urban background stations are
reported. To increase the representativeness of the
traffic stations
analysis in cases where only few traffic stations are
This section provides for each EU Member State reported, the average roadside increment
with PM monitoring data from urban roadside calculated for the available roadside stations is
stations reported in the AIRBASE database the applied also to the other stations for which no
allocation of observed PM2.5 concentrations into roadside increment could be derived from the
source contributions according to their spatial observations. E.g., Poland reported for 2009 only
origin and chemical‐sectoral composition as three roadside monitoring stations with sufficient
described in Section 1.3. detail for the GAINS modelling, while observations
for 142 urban background stations are provided.
Graphs present averages for all modelled stations
that are classified as urban traffic sites in AirBase The following pages contain figures showing source
and covered by the modelling scheme (see contributions, in alphabetical order of Member
Kiesewetter et al., 2013 for details). The focus on States. The spatial categories used in the plots are
urban traffic stations allows for the full spatial range the same as in Figure 2.1, with the additional
of source contributions to be quantified, from long‐ category of local traffic contributions from within
range transboundary transport to local traffic the street canyon. For comparison, the WHO
emissions in the particular street canyon where a guideline value of 10µg/m3 is shown.
monitoring station is located.
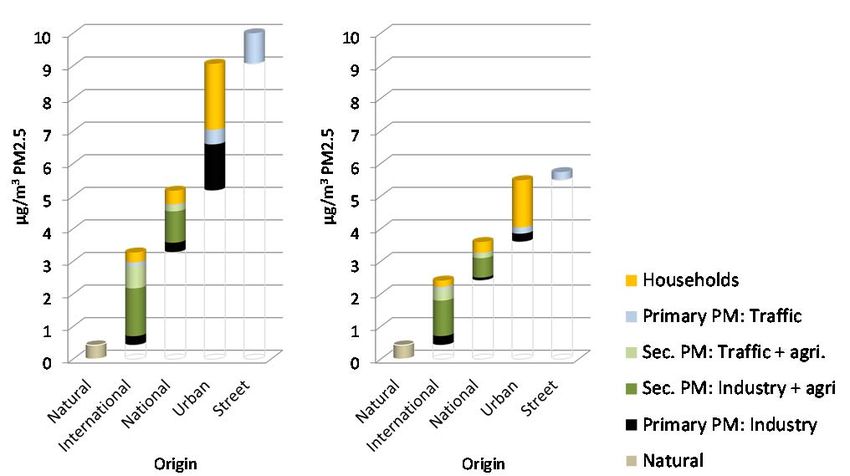
Page 8Austria (29 stations)
A. 2009 B. 2030 Commission Proposal
Figure 2.2. Source contributions to ambient PM2.5 at urban traffic stations in Austria (, in the base year 2009
(A) and for 2030 assuming adoption of the Clean Air Policy Package proposed by the Commission (B). Source:
IIASA GAINS.
Belgium (4 stations)
A. 2009 B. 2030 Commission Proposal
Figure 2.3. Source contributions to ambient PM2.5 at urban traffic stations in Belgium, in the base year 2009
(A) and for 2030 assuming adoption of the Clean Air Policy Package proposed by the Commission (B). Source:
IIASA GAINS.
Page 9Bulgaria (14 stations
A. 2009 B. 2030 Commission Proposal
Figure 2.4. Source contributions to ambient PM2.5 at urban traffic stations in Bulgaria, in the base year 2009
(A) and for 2030 assuming adoption of the Clean Air Policy Package proposed by the Commission (B). Source:
IIASA GAINS.
Czech Republic (33 stations)
A. 2009 B. 2030 Commission Proposal
Figure 2.5. Source contributions to ambient PM2.5 at urban traffic stations in the Czech Republic, in the base
year 2009 (A) and for 2030 assuming adoption of the Clean Air Policy Package proposed by the Commission
(B). Source: IIASA GAINS.
Page 10Estonia (3 stations)
A. 2009 B. 2030 Commission Proposal
Figure 2.6. Source contributions to ambient PM2.5 at urban traffic stations in Estonia, in the base year 2009 (A)
and for 2030 assuming adoption of the Clean Air Policy Package proposed by the Commission (B). Source: IIASA
GAINS.
Finland (2 stations)
A. 2009 B. 2030 Commission Proposal
Figure 2.7. Source contributions to ambient PM2.5 at urban traffic stations in Finland, in the base year 2009 (A)
and for 2030 assuming adoption of the Clean Air Policy Package proposed by the Commission (B). Source: IIASA
GAINS.
Page 11France (29 stations)
A. 2009 B. 2030 Commission Proposal
Figure 2.8. Source contributions to ambient PM2.5 at urban traffic stations in France, in the base year 2009 (A)
and for 2030 assuming adoption of the Clean Air Policy Package proposed by the Commission (B). Source: IIASA
GAINS.
Germany (79 stations)
A. 2009 B. 2030 Commission Proposal
Figure 2.9. Source contributions to ambient PM2.5 at urban traffic stations in Germany, in the base year 2009
(A) and for 2030 assuming adoption of the Clean Air Policy Package proposed by the Commission (B). Source:
IIASA GAINS.
Page 12Greece (3 stations)
A. 2009 B. 2030 Commission Proposal
Figure 2.10. Source contributions to ambient PM2.5 at urban traffic stations in Greece, in the base year 2009
(A) and for 2030 assuming adoption of the Clean Air Policy Package proposed by the Commission (B). Source:
IIASA GAINS.
Hungary (6 stations)
A. 2009 B. 2030 Commission Proposal
Figure 2.11. Source contributions to ambient PM2.5 at urban traffic stations in Hungary, in the base year 2009
(A) and for 2030 assuming adoption of the Clean Air Policy Package proposed by the Commission (B). Source:
IIASA GAINS.
Page 13Ireland (2 stations)
A. 2009 B. 2030 Commission Proposal
Figure 2.12. Source contributions to ambient PM2.5 at urban traffic stations in Ireland, in the base year 2009
(A) and for 2030 assuming adoption of the Clean Air Policy Package proposed by the Commission (B). Source:
IIASA GAINS.
Italy (70 stations)
A. 2009 B. 2030 Commission Proposal
Figure 2.13. Source contributions to ambient PM2.5 at urban traffic stations in Italy, in the base year 2009 (A)
and for 2030 assuming adoption of the Clean Air Policy Package proposed by the Commission (B). Source: IIASA
GAINS.
Page 14Lithuania (5 stations)
A. 2009 B. 2030 Commission Proposal
Figure 2.14. Source contributions to ambient PM2.5 at urban stations in Lithuania, in the base year 2009 (A)
and for 2030 assuming adoption of the Clean Air Policy Package proposed by the Commission (B). Source: IIASA
GAINS. As Lithuania has not provided sufficient details for traffic stations in 2009, the street component could
not be properly estimated.
Netherlands (5 stations)
A. 2009 B. 2030 Commission Proposal
Figure 2.15. Source contributions to ambient PM2.5 at urban traffic stations in the Netherlands, in the base
year 2009 (A) and for 2030 assuming adoption of the Clean Air Policy Package proposed by the Commission
(B). Source: IIASA GAINS.
Page 15Poland (142 stations)
A. 2009 B. 2030 Commission Proposal
Figure 2.16. Source contributions to ambient PM2.5 at urban traffic stations in Poland, in the base year 2009
(A) and for 2030 assuming adoption of the Clean Air Policy Package proposed by the Commission (B). Source:
IIASA GAINS.
Portugal (15 stations)
A. 2009 B. 2030 Commission Proposal
Figure 2.17. Source contributions to ambient PM2.5 at urban traffic stations in Portugal, in the base year 2009
(A) and for 2030 assuming adoption of the Clean Air Policy Package proposed by the Commission (B). Source:
IIASA GAINS.
Page 16Romania (2 stations)
A. 2009 B. 2030 Commission Proposal
Figure 2.18. Source contributions to ambient PM2.5 at urban stations in Romania, in the base year 2009 (A)
and for 2030 assuming adoption of the Clean Air Policy Package proposed by the Commission (B). Source: IIASA
GAINS. As Romania has not provided sufficient details for traffic stations in 2009, street components could not
be estimated.
Slovakia (17 stations)
A. 2009 B. 2030 Commission Proposal
Figure 2.19. Source contributions to ambient PM2.5 at urban traffic stations in Slovakia, in the base year 2009
(A) and for 2030 assuming adoption of the Clean Air Policy Package proposed by the Commission (B). Source:
IIASA GAINS.
Page 17Spain (30 stations)
A. 2009 B. 2030 Commission Proposal
Figure 2.20. Source contributions to ambient PM2.5 at urban traffic stations in Spain, in the base year 2009 (A)
and for 2030 assuming adoption of the Clean Air Policy Package proposed by the Commission (B). Source: IIASA
GAINS.
Sweden (5 stations)
A. 2009 B. 2030 Commission Proposal
Figure 2.21. Source contributions to ambient PM2.5 at urban traffic stations in Sweden, in the base year 2009
(A) and for 2030 assuming adoption of the Clean Air Policy Package proposed by the Commission (B). Source:
IIASA GAINS.
Page 18United Kingdom (24 stations)
A. 2009 B. 2030 Commission Proposal
Figure 2.22. Source contributions to ambient PM2.5 at urban traffic stations in the UK, in the base year 2009
(A) and for 2030 assuming adoption of the Clean Air Policy Package proposed by the Commission (B). Source:
IIASA GAINS.
Page 193 Discussion and conclusions
Average urban traffic PM2.5 concentrations decline in solid fuel use for heating together with
exceeded the WHO standards in the vast majority of the introduction of newer stoves would reduce
Member States in 2009. Peak values within each emissions from this sector by ~25% without further
policy interventions. More stringent product
Member State are far higher than this average;
standards could cut emissions by another 66%.
overall, this presents a strong need for emission
Accelerated substitution of inefficient burning of
reductions for both legal compliance as well as
solid fuels in households by cleaner fuels such as
public health considerations. natural gas or efficient biomass combustion could
achieve additional emission reductions that are not
The source allocation presented in Chapter 2 shows considered in the Commission Proposal.
that while source contributions vary strongly
Overall, the Commission Proposal would lead to a
between individual countries, all spatial domains
decline of primary PM emissions by 51% by 2030.
considered play their roles. In particular, it becomes
As a consequence, secondary aerosols are expected
clear that PM pollution cannot be considered a
to become the dominant contributors to the
purely local problem. For several Member States, remaining PM2.5 concentrations.
such as Belgium, Czech Republic, Netherlands,
Many different source sectors are involved in the
Hungary, Austria, transboundary transport of PM
formation of secondary aerosols, and the various
and precursor gases is a major contributor to urban
chemical processes make it difficult to uniquely
PM2.5 levels, and it will be very difficult for these
trace them back to a single source. However, the
countries to decrease their urban PM2.5 to safe formation of ammonium sulphate ((NH4)2SO4,
levels without coordinated international action. On NH4HSO4) and ammonium nitrate (NH4NO3) is
the other hand, several regions show dramatic local critically steered by the availability of NH3.
increments, pointing to the possible effectiveness (Megaritis et al. 2013; Beauchamp et al. 2013).
of local measures to reduce ambient PM2.5. Ammonia (NH3) emissions emerge predominantly
from agricultural sources, and form, together with
Transboundary transport is dominated by SO2 and NOx emissions mainly from power
secondary pollution, while primary PM plays a role generation and industry, secondary inorganic
mostly for local sources. Hence, reductions in both particles.
primary PM and secondary precursor emissions will
be needed to bring down PM2.5 to safe levels. Thereby, the future trends in secondary inorganic
aerosols will depend critically on measures for
Emissions from household heating and road agricultural NH3 emissions. The Clean Air Policy
transport are the dominant sources of primary PM. Package of the European Commission proposes for
In many Member States, especially those with very 2030 a cut of NH3 emissions by 27% relative to
high PM concentrations (e.g., Poland, Czech 2005. NOx should be reduced by 69%, and SO2
Republic, Slovakia, Romania, and Bulgaria), emissions by 81%.
domestic heating is the largest single source sector.
Together with the proposed measures for primary
In the coming years, progressing introduction of particle emissions, this should reduce ambient
particle filters for diesel vehicles is expected to PM2.5 levels by 50% or more in most Member
reduce primary PM from road transport by almost States, as shown in Section 2.2. On average, urban
two thirds. Remaining PM emissions from this roadside PM2.5 levels would then attain the WHO
sector will be mainly from non‐exhaust sources guideline value in seven Member States, although
(road abrasion, brake and tyre wear). Household concentrations at some peak location could still be
heating will remain an important source of PM higher. At such places, however, there will be a
emissions, particularly in areas where coal or realistic chance to control the remaining
inefficient biomass burning is used. The anticipated exceedance by local measures.
Page 20REFERENCES
Amann M, Bertok I, Borken‐Kleefeld J, et al. (2011) the street level in the GAINS integrated
Cost‐effective control of air quality and assessment model: projections under
greenhouse gases in Europe: modeling and current legislation. Atmos Chem Phys
policy applications. EMS 26:1489–1501. 14:813–829. doi: 10.5194/acp‐14‐813‐
doi: 10.1016/j.envsoft.2011.07.012 2014
Amann M, Borken‐Kleefeld J, Cofala J, et al. (2014) Makra L, Matyasovszky I, Guba Z, et al. (2011)
The Final Policy Scenarios of the EU Clean Monitoring the long‐range transport
Air Policy Package. TSAP Report #11. effects on urban PM10 levels using 3D
International Institute for Applied Systems clusters of backward trajectories.
Analysis, Laxenburg, Austria. Atmospheric Environment 45:2630–2641.
doi: 10.1016/j.atmosenv.2011.02.068
ApSimon HM, Gonzalez del Campo MT, Adams HS
(2001) Modelling long‐range transport of Malcolm AL, Derwent RG, Maryon RH (2000)
primary particulate material over Europe. Modelling the long‐range transport of
Atmospheric Environment 35:343–352. secondary PM10 to the UK. Atmospheric
doi: 10.1016/S1352‐2310(00)00143‐6 Environment 34:881–894. doi:
10.1016/S1352‐2310(99)00352‐0
Beauchamp M, Bessagnet B, Guerreiro C, et al.
(2013) Sensitivity analysis of ammonia Megaritis AG, Fountoukis C, Charalampidis PE, et al.
emission reductions on exceedances of PM (2013) Response of fine particulate matter
air quality standards. European Topic concentrations to changes of emissions
Centre on Air and Climate Change, and temperature in Europe. Atmos Chem
Bilthoven, Netherlands Phys 13:3423–3443. doi: 10.5194/acp‐13‐
3423‐2013
EC (2008) Directive 2008/50/EC of the European
Parliament and of the Council of 21 May Menut L, Bessagnet B, Khvorostiyanov D, et al.
2008 on ambient air quality and cleaner air (2013) CHIMERE 2013: a model for regional
for Europe. atmospheric composition modelling.
Geosci Model Dev 6:981–1028.
EC (2013) Proposal for a Directive of the European
Parliament and of the Council on the Pope CA, Burnett RT, Turner MC, et al. (2011) Lung
reduction of national emissions of certain Cancer and Cardiovascular Disease
atmospheric pollutants and amending Mortality Associated with Ambient Air
Directive 2003/35/EC. European Pollution and Cigarette Smoke: Shape of
Commission (EC), Brussels, Belgium the Exposure–Response Relationships.
Environ Health Perspect 119:1616–1621.
Kiesewetter G, Borken‐Kleefeld J, Heyes C, et al. doi: 10.1289/ehp.1103639
(2013) Modelling compliance with NO2
and PM10 air quality limit values in the Pope III CA, Burnett RT, Thun MJ, et al. (2002) Lung
GAINS model. TSAP Report #9. cancer, cardiopulmonary mortality, and
International Institute for Applied Systems long‐term exposure to fine particulate air
Analysis, Laxenburg, Austria pollution. JAMA: the journal of the
American Medical Association 287:1132–
Kiesewetter G, Borken‐Kleefeld J, Schoepp W, et al. 1141.
(2014a) Modelling street level PM10
concentrations across Europe: source Simpson D, Benedictow A, Berge H, et al. (2012) The
apportionment and possible futures. EMEP MSC‐W chemical transport model–
Atmos Chem Phys Discuss 14:18315– technical description. Atmos Chem Phys
18354. doi: 10.5194/acpd‐14‐18315‐2014 12:7825–7865.
Kiesewetter G, Borken‐Kleefeld J, Schöpp W, et al. Tsyro SG (2008) Regional model for formation,
(2014b) Modelling NO2 concentrations at dynamics and Long‐range transport of
Page 21atmospheric aerosol: Study of atmospheric World Health Organization (2006) Air quality
aerosol properties in Europe. Russ guidelines global update 2005: particulate
Meteorol Hydrol 33:300–309. doi: matter, ozone, nitrogen dioxide, and sulfur
10.3103/S106837390805004X dioxide. World Health Organization,
Copenhagen, Denmark
US‐EPA (2013) National Ambient Air Quality
Standards for Particulate Matter; Final
Rule. Federal Register 78, 10:3086–3287.
WHO (2013) Review of evidence on health aspects
of air pollution – REVIHAAP Project.
Copenhagen, Denmark
Page 22A. Technical Appendix: Methodology
Since the number of stations reporting PM2.5 in the regional background, it is not suitable in all
2009 is relatively low compared to PM10, especially places, as it does contain contributions from local
in critical areas in the new Member States, all emissions.
stations covered by the PM10 scheme are included
The basic assumptions behind the re‐allocation are:
in this analysis, regardless whether they report
PM2.5 in 2009 or not. In case roadside PM2.5 EMEP natural dust fields as used in GAINS may
observations are missing, the roadside increment is be too low in some places. E.g. CHIMERE dust
estimated from the NOx traffic increment, scaled fields are usually higher. Thus, parts of the
with the ratio of road traffic PM2.5 emissions over residual may be attributed to natural dust –
road traffic NOx emissions. If PM2.5 urban however, only within certain limits.
background measurements are missing, the urban The residual may contain a regional as well as a
background PM2.5 is estimated as modelled PM2.5 local component. Only the regional component
+ country average scaling factor × PM10 residual. may be partly attributed to higher natural dust,
The PM10 residual is known as PM10 urban while the local component is definitely related
background observations are required for any to either under‐estimated local emissions or
roadside station to be covered by the PM10 model. over‐estimated mixing in the boundary layer.
The scaling factor, representing the fraction of Secondary aerosol formation requires time and
PM2.5 in PM10 residuals, is calculated from country is therefore not considered a local
average PM2.5 in PM10 residuals averaged at all phenomenon. As a simplification, all secondary
stations where both measurements are available. aerosol must be contained in the regional
background, while the urban increment
Figure A.1 gives a schematic overview of the re‐
contains only primary PM.
allocation that is done in a post‐processing step. For
consequently, a re‐attribution of the 28×28km2
this analysis the term “regional background” is
modelled background concentrations into
introduced, which is supposed to contain
regional and local components is only needed
contributions from all sources except the city where
for PPM.
the station is located. While the 28×28km2
modelled background is a good first indicator for
Figure A.3.1. Schema of the post‐processing analysis. Modelled concentrations (left) are taken as basis and
merged with the information on regional background PM2.5 levels. The residual is split up into regional and
local contributions, as well as the PPM part of 28×28km2 modelled concentrations, to arrive at the spatial‐
source allocation as presented in Chapter 2 (right).
Page 23The following base year information is used in the 5) The 28×28km2 national PPM
re‐allocation: concentrations are split up into regional
and local components according to the
Urban background observations as used in the
constraints imposed by regional
model
background and regional residual defined
rural background observations, interpolated to
in steps 1 and 3.
the site
6) Local residuals are sector‐wise attributed
unexplained residuals at rural background sites,
to PPM emissions within a range of 30km
interpolated to the site
from the site, taken from the gridded
Natural dust fields as used in the CHIMERE
CHIMERE 7×7km2 emission inventory.
model runs, which are higher than the EMEP
fields
The re‐allocation distinguishes between cases At stations where the urban background is
where the urban background is underestimated by overestimated, steps 1‐3 and 6 are omitted.
bottom up modelling (which is the case in the Regional background levels are defined as in step 4.
majority of sites), and those where the urban A scaling factor is calculated as
background is over‐estimated.
. .
. .
The process consists of the following steps (here for with . the observations, .
stations in which the urban background is and . the 28km modelled concentrations
underestimated): and the 7km urban increment, respectively, and
1) The unexplained residual is split into a . the natural PM fields as calculated in the
regional part (i.e. interpolated residual EMEP model for 2009. This scaling factor is then
from nearby rural background sites) and a applied equally to all sectoral and chemical
remaining local part. components in . and . , so
2) Out of the regional residual, as much as that their sum plus the unchanged natural dust and
possible is allocated to natural dust (up to sea salt fields match observed PM2.5 levels.
the dust fields used in CHIMERE), the rest
is considered anthropogenic.
3) Anthropogenic regional residuals are
attributed to source sectors and species
(PPM/SIA/SOA) in the same shares as the
domestic 28×28km modelled PM2.5 at the
site
4) A regional background level [PM2.5]RB is
defined as the minimum of:
a. interpolated observed rural
background PM2.5
b. the modelled 28×28km2 PM2.5 +
EMEP natural fields + regional
residual
However, it must contain at least
c. 28×28km2 modelled
transboundary PM2.5 + EMEP
natural fields + regional residual +
28×28km2 modelled domestic SIA
so that
[PM2.5]RB = max(min(a,b),c) .
Page 24You can also read