Urbanization and Floods in Sub-Saharan Africa: Spatiotemporal Study and Analysis of Vulnerability Factors-Case of Antananarivo Agglomeration ...
←
→
Page content transcription
If your browser does not render page correctly, please read the page content below
water
Article
Urbanization and Floods in Sub-Saharan Africa: Spatiotemporal
Study and Analysis of Vulnerability Factors—Case of
Antananarivo Agglomeration (Madagascar)
Fenosoa Nantenaina Ramiaramanana *                       and Jacques Teller

                                           Local Environment Management and Analysis (LEMA), Urban & Environmental Engineering Department,
                                           University of Liège, 4000 Liège, Belgium; Jacques.Teller@uliege.be
                                           * Correspondence: Fenosoa.Ramiaramanana@student.uliege.be

                                           Abstract: Flooding is currently one of the major threats to cities in Sub-Saharan Africa (SSA). The
                                           demographic change caused by the high rate of natural increase, combined with the migration toward
                                           cities, leads to a strong demand for housing and promotes urbanization. Given the insufficiency or
                                           absence of adequate planning, many constructions are installed in flood-prone zones, often without
                                           adequate infrastructure, especially drainage systems. This makes them very vulnerable. Our research
                                           consists of carrying out a spatiotemporal analysis of the agglomeration of Antananarivo (Madagascar).
                                           It shows that urbanization leads to increased exposure of populations and constructions to floods.
                                           There is a pressure on land in flood-prone zones due to the exponential growth of the population at
                                           the agglomeration level. Some 32% of the population of the Antananarivo agglomeration lived in
                                           flood-prone zones in 2018. An analysis of the evolution of built spaces from 1953 to 2017 highlights
                                           that urban expansion was intense over those years (6.1% yearly increase of built areas). This expansion
                                           triggered the construction of built areas in flood-prone zones, which evolved from 399 ha in 1953
                                 to 3675 ha in 2017. In 2017, 23% of the buildings in the agglomeration, i.e., almost one out of every

                                           four buildings, were in flood-prone zones. A share of the urban expansion in flood-prone zones is
Citation: Ramiaramanana, F.N.;             related to informal developments that gather highly vulnerable groups with very little in terms of
Teller, J. Urbanization and Floods in      economic resources. Better integration of flood risk management in spatial planning policies thus
Sub-Saharan Africa: Spatiotemporal         appears to be an essential step to guide decisions so as to coordinate the development of urban areas
Study and Analysis of Vulnerability
                                           and drainage networks in a sustainable way, considering the vulnerability of the population living in
Factors—Case of Antananarivo
                                           the most exposed areas.
Agglomeration (Madagascar). Water
2021, 13, 149. https://doi.org/
                                           Keywords: demographic change; urbanization; flooding; drainage system; vulnerability; Sub-
10.3390/w13020149
                                           Saharan Africa; Antananarivo
Received: 29 October 2020
Accepted: 7 January 2021
Published: 10 January 2021
                                           1. Introduction
Publisher’s Note: MDPI stays neu-               Floods have become more recurrent and usual events in several countries [1]. Com-
tral with regard to jurisdictional clai-   pared to the figures of the 1990s, the number of floods has almost doubled in the world
ms in published maps and institutio-       since the 2000s [2]. They represent a threat with a major impact in terms of victims. In 2018,
nal affiliations.                          floods accounted for 50% of people affected by natural hazards [3]. Floods also have severe
                                           consequences in terms of economic loss and material damage [4].
                                                The upsurge in floods can be explained by various factors, including climate change [5],
Copyright: © 2021 by the authors. Li-
                                           which generates changes in precipitation regimes and intensity [6], and often manifests
censee MDPI, Basel, Switzerland.
                                           in torrential rains. Intense precipitation can cause flooding in small river basins and in
This article is an open access article
                                           rivers [4]. Extreme events in Africa [7], Europe [8], and Asia [9] are examples of the
distributed under the terms and con-       significance of climate change in increasing flooding. However, floods are not exclusively
ditions of the Creative Commons At-        linked to climate change, but also to urbanization dynamics [10]. Jha, Bloch, and Lamond
tribution (CC BY) license (https://        argue that regardless of climate change, urbanization can increase the risk of flooding [11].
creativecommons.org/licenses/by/           With an emphasis on exposure and vulnerability, we would like to highlight this aspect in
4.0/).                                     this paper.

Water 2021, 13, 149. https://doi.org/10.3390/w13020149                                                      https://www.mdpi.com/journal/water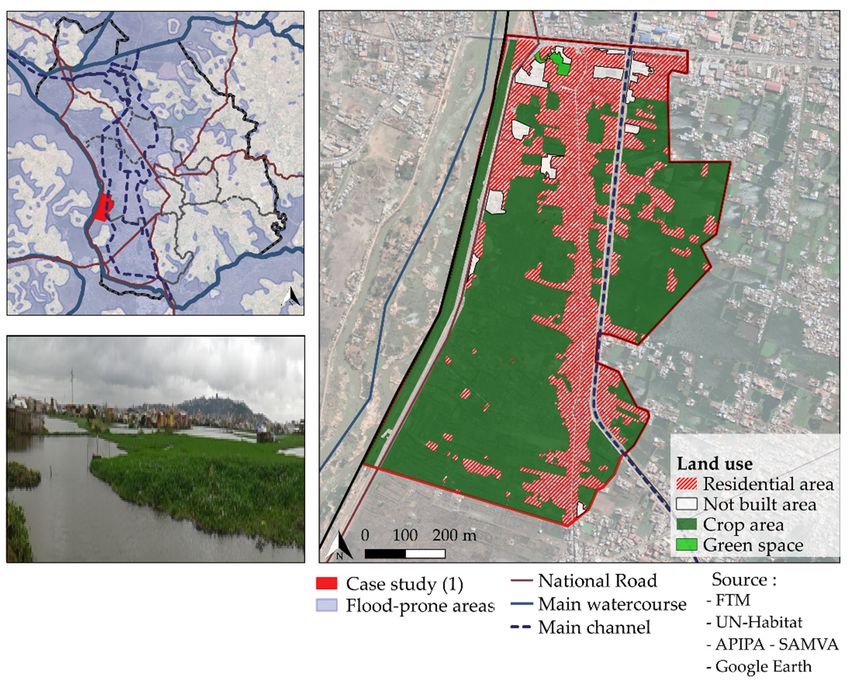
Water 2021, 13, 149                                                                                           2 of 23

                            Urbanization generally leads to an increase in impervious surfaces, which limits the
                      possibility of water infiltration in the soil and increases the volume of water runoff on
                      the surface [12]. Additionally, urbanization is often accompanied by an artificialization
                      of urban rivers, which further increases the risk of water overflows [13,14]. This modifies
                      existing land use not only inside cities but also in the outskirts [15].
                            In 1900, 15% of the world’s population lived in urban areas [16]. Currently the pro-
                      portion is more than 50% [17]. The numbers are increasing by 200,000 people a day, or
                      70 million people a year, and the proportion is estimated to reach 70% in 2050 [17]. This ur-
                      ban growth increases the demand for housing and land to build [16]. Given the competition
                      for urban land, some people are tempted to build on areas exposed to risks [18,19].
                            Controlling exposure to floods implies a combination of urban planning and manage-
                      ment of drainage systems. It requires follow-up of spatial planning policies [11], because
                      risks are partly related to governance [1]. A lack of planning or poor planning can lead
                      to an increase of informal installations and constructions, often exposing vulnerable resi-
                      dents to risks [10,20]. Lower-income residents usually do not have access to services and
                      infrastructures that could mitigate the problems [21]. On the other hand, extending the
                      drainage system should go hand-in-hand with any increase in built spaces, and it should
                      be resilient [22] by having the capacity to evacuate water in the face of flooding. Without
                      an adequate, sufficient, and well-maintained drainage system [23], urbanization cannot be
                      sustainable.
                            Africa is one of the two continents in the world most affected by floods [24]. Floods
                      are the most frequent disaster and remain a threat, especially in Sub-Saharan Africa (SSA)’s
                      cities [25,26]. At the same time, the continent contains a population that is growing
                      twice as fast other regions in the world [27]. Beyond this high growth, management and
                      planning remains a problem throughout the continent and particularly in the region south
                      of the Sahara [23,28]. The absence or ineffectiveness of disaster management plans and
                      the inadequacy of basic systems, infrastructures, and services contribute to increasing
                      vulnerability of urban areas [11]. The inability to accommodate a fast-growing population
                      in decent conditions explains why constructions are located on unsuitable and dangerous
                      sites, exposing cities to natural disasters [18], including floods. The deficiency of the
                      drainage systems means a part of the population is affected by floods [14].
                            In this study, we show that urbanization leads to increased exposure of populations
                      and constructions to floods and tends to add to their vulnerability. In order to reduce
                      exposure and vulnerability to floods, it is important to recognize all aspects related to
                      flooding, including socioeconomic factors that explain why flood-prone zones keep at-
                      tracting a part of the population. We thus adopt a co-evolutionary perspective in order to
                      better understand the long-term bi-directional relations between flood exposure, urban
                      expansion, and vulnerability [29,30].
                            This paper is centered on the agglomeration of Antananarivo, the capital of Mada-
                      gascar. Apart from the extreme climatic hazards the country is exposed to every year [31],
                      it has most of the characteristics of SSA’s cities mentioned above, in particular growing
                      urbanization. According to the Institut National de la Statistique de Madagascar (INSTAT),
                      nearly 5 million Malagasy people lived in urban areas in 2018 [32]. Rapid urban expansion
                      is a problem due to the lack of planning [33]. It is associated with drainage problems
                      plaguing the country. Insufficient capacity and poor functioning of the drainage network
                      due to clogging with solid waste and deterioration are among the causes of floods [34]. The
                      growing urban population is settling more and more in flood-prone areas [35], with the
                      majority in informal spaces with limited services [36]. All of these factors contribute to the
                      vulnerability of low-income groups.
                            The study starts from the birth of the agglomeration and proceeds with an analysis of
                      its demographic growth, and then the evolution of the built-up areas. Two case studies
                      on a finer scale are presented in order to better understand the socioeconomic conditions
                      of urban areas located in lower areas of the city. These sites were selected based on the
                      identification of sensitive areas affected by flooding during the 2018 rainy season by Service
                      Autonome de Maintenance de la Ville d’Antananarivo (SAMVA). They are among the black
                      spots of the city, since they are flooded every year. They have a similar urban dynamic and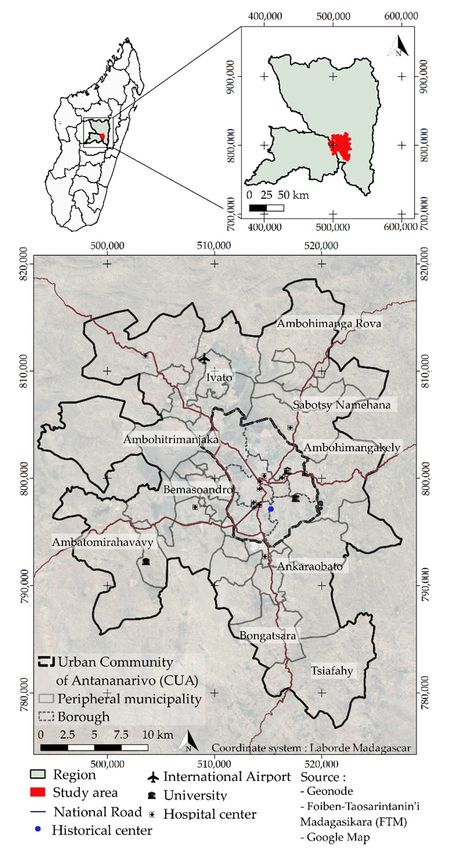
Water 2021, 13, 149                                                                                                  3 of 23

                                socioeconomic situation but differ in terms of the motivation of the people living there.
                                This makes the comparison relevant. The case study analysis is followed by a discussion of
                                results, conclusions, and limitations of the research.

                                2. Study Area: Agglomeration of Antananarivo
                                       The agglomeration of Antananarivo, also called Greater Antananarivo, is located on
                                  the central Malagasy highlands (Figure 1). It covers an area of 76,800 ha and in 2018 had
                                  about 2.9 million inhabitants according to INSTAT. On the administrative and institutional
                                  level, it brings together the Urban Community of Antananarivo (CUA) composed of six
                                  boroughs forming the city of Antananarivo and 37 peripheral municipalities. The whole is
Water 2021, 13, x FOR PEER REVIEW                                                                                   4 of 24
                                  located in the Regions of Analamanga and Itasy and is subdivided into 571 neighborhoods
                                  called Fokontany.

                              Figure 1. Location
                                Figure            of of
                                        1. Location  agglomeration  of of
                                                        agglomeration  Antananarivo.
                                                                          Antananarivo.

                                   Located at an altitude between 1200 and 1500 m above sea level, Antananarivo is
                              characterized by a wide variety of landforms. It is made up of a set of elevated areas with
                              steep slopes to the south, lower areas to the east and center, and a vast alluvial plain in
                              the north and west (Figures 2 and 3).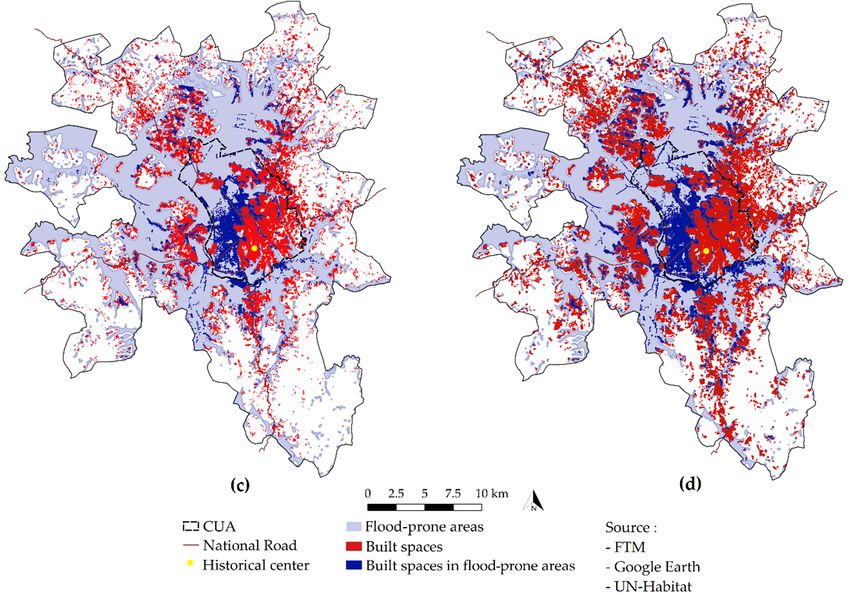
Water 2021, 13, 149                                                                                                 4 of 23

                                         Located at an altitude between 1200 and 1500 m above sea level, Antananarivo is
                                    characterized by a wide variety of landforms. It is made up of a set of elevated areas with
                                    steep slopes to the south, lower areas to the east and center, and a vast alluvial plain in the
                                    north and west (Figures 2 and 3).
                                         The plain is drained by the Ikopa and its tributaries (Figures 2 and 3), flowing mainly
                                    from the south, southeast, and east to the northwest [37]. Upstream, the flow is more fluid,
                                    because the rivers face areas with steep slopes. The river slows down and generates water
                                    retention in the lower parts upon its arrival in the plain. This is due to the slight slope of
                                    about 0.25% [38] as well as the confluence of the rivers. The topography of the site and its
                                    hydrographic network make it very vulnerable to flooding. Almost a third of the urban
                                    area is occupied by flood-prone areas (Figure 3).
                                         These flood-prone zones (Figure 3) were produced from a combination of the topo-
                                    graphic wetness index (TWI), a soil moisture index, and the stream power index (SPI), an
                                    index characterizing the intensity of surface runoff. They are extracted from calculations
                                    carried out based on a digital Shuttle Radar Topography Mission (SRTM) model with geo-
                                    graphic information system (GIS) software. These two indices are important parameters in
                                    flood sensitivity analysis [39].
                                         After the last confluence in the northwest, the Ikopa flows to a single point [34],
                                    characterized by a succession of rock outcrops that reduces the water evacuation capacity
                                    and generates the formation of alluvial deposits at the level of the plain [40]. In the CUA,
                                    the plain forms a polder surrounded by dikes that protect it from overflowing rivers.
Water 2021, 13, x FOR PEER REVIEW   However, as the river levels are often higher than its level during the rainy  5 ofseason,
                                                                                                                         24    it is
                                    very sensitive to flooding [41].

                                    Figure 2.Figure  2. Relief
                                              Relief of        of study area.
                                                        study area.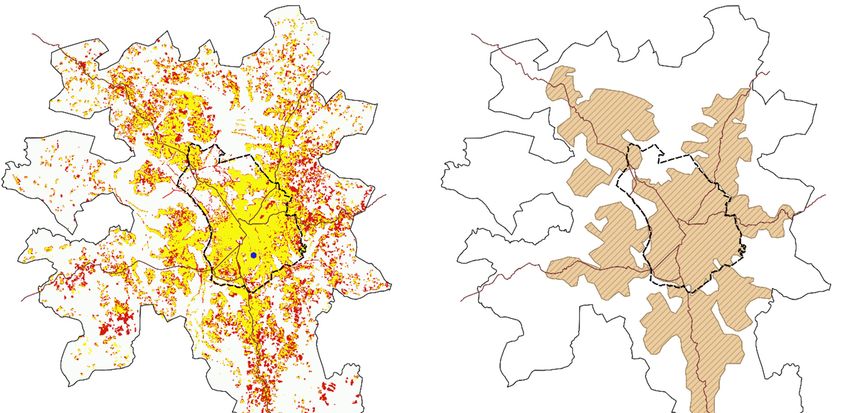
Water 2021, 13, 149                                                                                         5 of 23

                                Figure 2. Relief of study area.

                      Figure 3. Flood-prone areas.
                                 Figure 3. Flood-prone areas.
                           The first hydraulic infrastructures date from the royal period in the 17th and 18th
                      centuries, consisting of river embankments and canals constructed to protect the plain and
                      ensure the evacuation of irrigation water [42]. Currently, the drainage system is denser
                      and more complex. It is structured along three main channels with multiple functions:
                      drainage of rainwater, wastewater, and sewage, as well as irrigation of the agricultural
                      plain. These are the Andriantany, C3, and GR (Génie Rural) channels (Figures 4 and 5).
                      Primary canals, open drains, and buried pipes of various dimensions are connected to
                      these three main channels. Pumping stations and retention basins have been added to this
                      to ensure operation.
                           At the CUA level, the Andriantany and C3 channels are the main drainage channels.
                      The upstream Andriantany runs through the western part of the city to the pumping station
                      to the northwest and collects water from the hills and eastern plain. It collects rainwater,
                      but also wastewater, from some Fokontany [37]. Downstream, it takes up water from the
                      pumping station and drains to its point of confluence with the Ikopa [43]. As for channel
                      C3, it collects water from the southern plain and agricultural drainage flows as well as
                      excess flows from Andriantany [41]. The GR channel irrigates the plain [44] and acts as a
                      drain during the rainy season [45].
                           Despite the existence of this drainage system, water tends to accumulate in the
                      plain. At the pumping station, the flow remains paltry compared to the total flow to
                      be drained [46]. Moreover, the increased intensity and volume of runoff due to soil sealing
                      accelerates the degradation of the drainage system [47]. These problems cause flooding
                      during the rainy season.
                           The peripheral municipalities are not connected to the main drainage network. In
                      these municipalities, water is channeled through sanitation devices along the road network
                      that evacuate rainwater, concrete or earth canals, and drainage ditches leading into the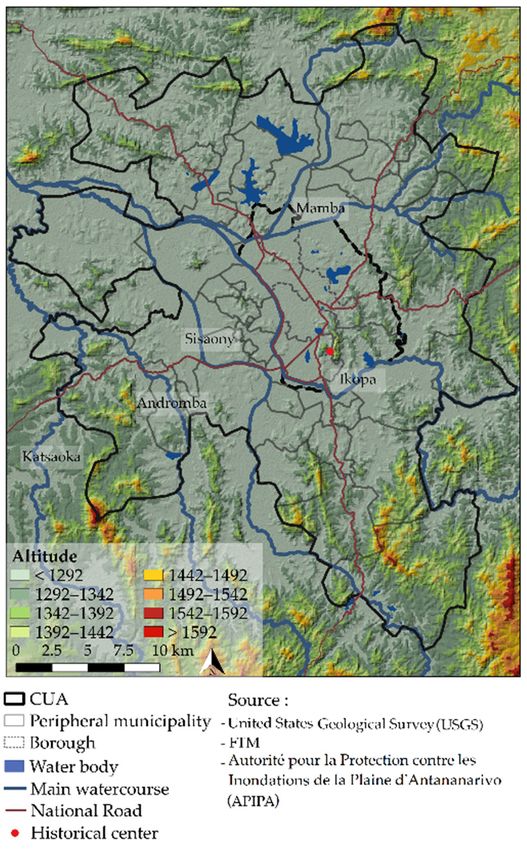
The first hydraulic infrastructures date from the royal period in the 17th and 18th
                                centuries, consisting of river embankments and canals constructed to protect the plain and
                                ensure the evacuation of irrigation water [42]. Currently, the drainage system is denser
                                and more complex. It is structured along three main channels with multiple functions:
Water 2021, 13, 149                                                                                                     6 of 23
                                drainage of rainwater, wastewater, and sewage, as well as irrigation of the agricultural
                                plain. These are the Andriantany, C3, and GR (Génie Rural) channels (Figures 4 and 5).
                                Primary canals, open drains, and buried pipes of various dimensions are connected to
                                these  three
                                  natural     main channels.
                                           environment.      Pumping
                                                          In some     stations and
                                                                   communes,       retentionsanitation
                                                                               a collective  basins have  been does
                                                                                                       system  added to even
                                                                                                                    not  this
                                toexist
                                   ensure   operation.
                                        [34].

Water 2021, 13, x FOR PEER REVIEW                                                                                      7 of 24

                                Figure      Agglomeration’smain
                                 Figure4.4.Agglomeration’s  maindrainage
                                                                 drainagesystem.
                                                                          system.

                                Figure
                                 Figure5.5.Urban
                                            UrbanCommunity
                                                  CommunityofofAntananarivo
                                                                Antananarivo(CUA)
                                                                             (CUA)watershed.
                                                                                  watershed.

                                     At the CUA level, the Andriantany and C3 channels are the main drainage channels.
                                The upstream Andriantany runs through the western part of the city to the pumping sta-
                                tion to the northwest and collects water from the hills and eastern plain. It collects rain-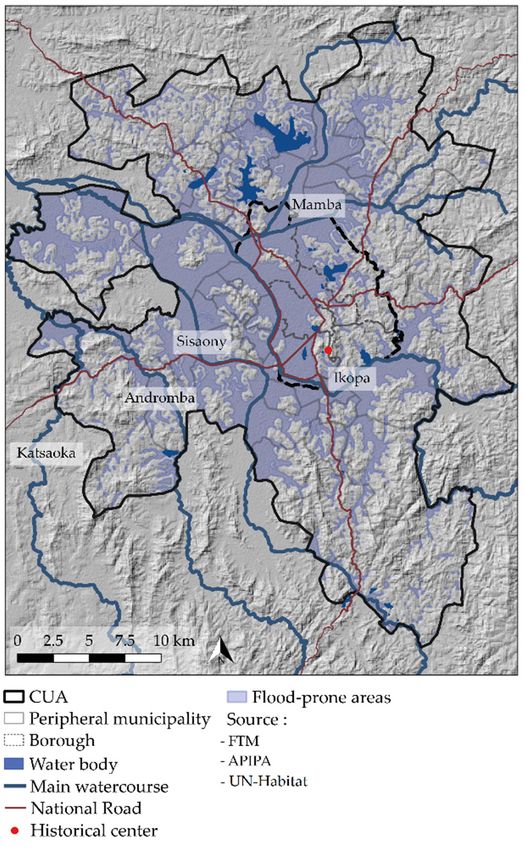
Water 2021, 13, 149                                                                                                            7 of 23

                                 3. Materials and Methods
                                 3.1. Collected Data
                                       The demographic data used for this work were collected from a general population
                                 census based on administrative divisions provided by INSTAT conducted in 1993. For 2018,
                                 the figures are based on estimates, since the current general census is not yet official.
                                       Built spaces correspond to structures that host housing, service, industrial, and eco-
                                 nomic activities. Those represented in this study were digitized based on historical maps
                                 and aerial photos. The first base map are maps of Antananarivo from 1953 and 1975. They
                                 were provided by Foiben-Taosarintanin’i Madagasikara (FTM), a public establishment in
                                 charge of cartography and geographic information in Madagascar. It covers the Greater
                                 Antananarivo area except for a few communes to the north and west of the agglomeration.
                                 The map representing the areas built in 2006 and 2017 was developed through vectorization
                                 of aerial images provided by Google Earth.
                                       The flood-prone zones used in this study are those described in Figure 3 and explained
                                 in Section 2. These data were provided by UN-Habitat Madagascar.
                                       Data related to the drainage system came from two organizations that specialize in
                                 sanitation and flooding in Madagascar, Autorité pour la Protection contre les Inondations
                                 de la Plaine d’Antananarivo (APIPA) and SAMVA.
                                       Table 1 shows the details of these data.

      Table 1. Data used in the analysis. INSTAT, Institut National de la Statistique de Madagascar; FTM, Foiben-Taosarintanin’i
      Madagasikara; APIPA, Autorité pour la Protection contre les Inondations de la Plaine d’Antananarivo; SAMVA, Service
      Autonome de Maintenance de la Ville d’Antananarivo.

    Name of the Data             Spatial Extent              Scale                   Date                        Source
    Demographic data            Agglomeration                  -                 1993 and 2018                   INSTAT
                            CUA and 32 peripheral          1/100,000                 1953
     Topographic map                                                                                              FTM
                               municipalities               1/50,000                 1975
       Aerial images            Agglomeration                  -                 2006 and 2017                Google Earth
    Flood-prone areas           Agglomeration                  -                     2012               UN-Habitat Madagascar
    Drainage network:
                                Agglomeration                  -                     2017                        APIPA
     main channels
     Drainage network:
                                     CUA                       -                     2017                        SAMVA
    secondary channels

                                      In order to cross-check all of the data, cartographic work was carried out. Analysis,
                                 modeling, and display of results was done using QGIS geographic information system
                                 software.

                                 3.2. Method
                                      The number of inhabitants is a first measure of the degree of exposure to flooding.
                                 Demographic data were first mapped at the level of the peripheral municipalities and
                                 boroughs of the CUA. This map was used to identify the annual demographic evolution
                                 between 1993 and 2018 and the population in 2018. Demographic data were then mapped
                                 at the level of the Fokontany in order to obtain the residential population density in 2018
                                 (Scheme 1). Residential population density is defined here as the ratio between the number
                                 of inhabitants and the area of built spaces.
                                      Considering that in 2018 the average residential population density of the Fokontany
                                 of the agglomeration was estimated at 250 inhab/built ha, the following thresholds were
                                 established: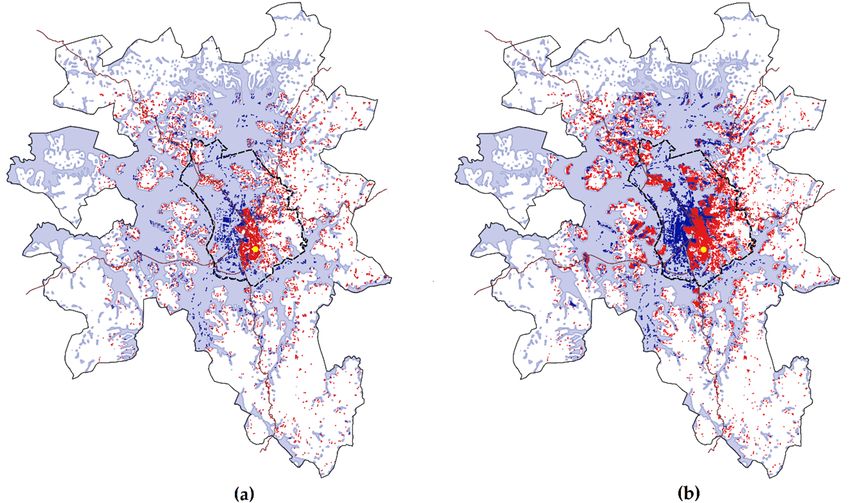
Water 2021, 13, 149 8 of 23
Water 2021, 13, x FOR PEER REVIEW 9 of 24
• Fewer than 25 inhab/built ha: very low density
• 25 to 150 inhab/built ha: low density
• 150 to 350 inhab/built ha: moderate density
3.2. Method
• 350 to 600 inhab/built ha: densely populated
• Theto
600 number of inhabitants
1200 inhab/built is a first
ha: very measure
densely of the degree of exposure to flooding.
populated
•Demographic
More thandata1200were first mapped
inhab/built ha: veryat high
the level
densityof the peripheral municipalities and
boroughs of the CUA. This map was used to identify the annual demographic evolution
The 1993
between density
andmap
2018highlights the overall
and the population geographic
in 2018. distribution
Demographic of thethen
data were population
mapped
throughout the agglomeration. Crossed with the area of flood-prone zones
at the level of the Fokontany in order to obtain the residential population density in of each Fokon-
2018
tany in 2018, it allows estimation of percentage of the population living in
(Scheme I). Residential population density is defined here as the ratio between the number flood-prone
areas (Scheme 1).
of inhabitants and the area of built spaces.
Scheme
SchemeI.1.Overview
Overview of
of method adoptedinin
method adopted thethe study.
study.
Historic
Considering topographic maps
that in 2018 the and recent
average aerial data
residential were used
population to map
density of thetheFokontany
extent of
urbanization
of the agglomeration was estimated at 250 inhab/built ha, the following thresholdsactual
in 1953, 1975, 2006, and 2017. This makes it possible to understand the were
structuring
established:of urbanization and the evaluation of the rate of waterproofing of the soil. The
urbanization
• Fewer than maps were used to
25 inhab/built ha:determine the progress of construction in flood-prone
very low density
zones
• (Scheme 1).
25 to 150 inhab/built ha: low density
• Two groups
150 to of Fokontany
350 inhab/built from the south
ha: moderate density plain of the CUA were studied in order to
understand
• 350 to 600 inhab/built ha: densely populatedin these areas. These Fokontany, Ampe-
the factors underlying urbanization
filoha Ambodirano and Ampandrana-Besarety and Besarety, which were selected based
• 600 to 1200 inhab/built ha: very densely populated
on previous analyses, are located in flood-prone areas and witnessed strong demographic
• More than 1200 inhab/built ha: very high density
growth over the last years. Site visits were made in order to map current land uses and
studyThethe density map highlights
local drainage systems. the
Theseoverall geographic
site visits furtherdistribution
allowed us to of observe
the population
the liv-
throughout the agglomeration. Crossed with the area of flood-prone
ing conditions in these areas so as to better understand the interplay between zones of each Fokon-
flooding,
tany in 2018, it allows estimation of percentage
urbanization, and socioeconomic drivers/challenges (Scheme 1). of the population living in flood-prone
areas (Scheme I).
Historic topographic maps and recent aerial data were used to map the extent of ur-
4. Results
banization
4.1. in 1953,
Demographic 1975,and
Change 2006, and 2017.
Residential This makes
Population it possible
Density in 2018 to understand the actual
structuring of urbanization and the evaluation of
Antananarivo experienced considerable demographic growth the rate of waterproofing
over the oflast
the decades.
soil. The
urbanization maps were used to determine the progress of construction
It was home to more than half of the urban population of the country and around 11.3% in flood-prone
zones
of the (Scheme I).
total population in 2018. Between 1993 and 2018 (25 years), annual growth was
Two groups
estimated at 3.8%.of Fokontany from the south plain of the CUA were studied in order to
understand
In 2018,thethe factors
CUA had underlying urbanization
approximately 50% of the in these areas. These
total population ofFokontany, Ampe-
the agglomeration.
filoha Ambodirano and Ampandrana-Besarety and Besarety,
However, population growth in the CUA between 1993 and 2018 was rather modest which were selected based
on previous analyses, are located in flood-prone areas and witnessed
compared to the growth observed in peripheral municipalities (Figure 6). Population strong demographic
growth over the last years. Site visits were made in order to map current land uses and
study the local drainage systems. These site visits further allowed us to observe the living
conditions in these areas so as to better understand the interplay between flooding, ur-
banization, and socioeconomic drivers/challenges (Scheme I).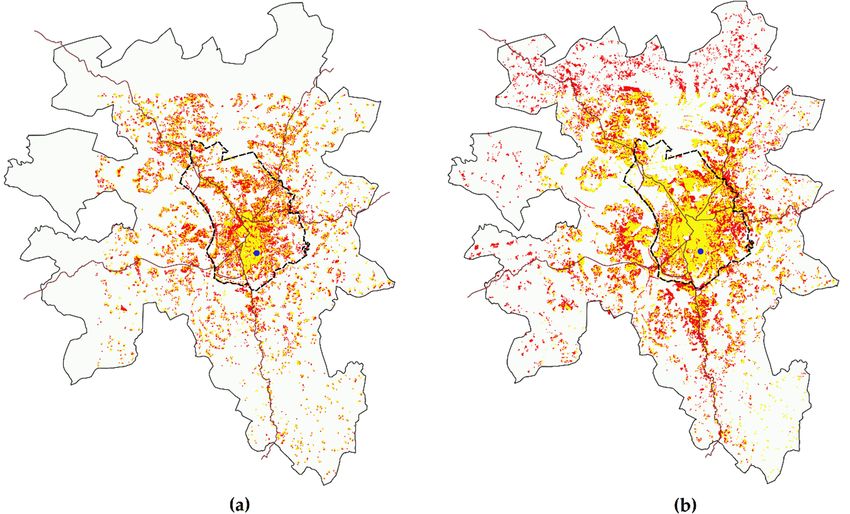
Water 2021, 13, 149 9 of 23
growth in peripheral municipalities was mainly driven by migratory flows from the CUA,
defined as proximity migration [48], but also from other regions of the country [37].
Water 2021, 13, x FOR PEER REVIEW The demographic density was much higher in the CUA than in the peripheral 10 mu-
of 24
nicipalities in 2018 (Figure 7). It can be observed, however, that the distribution of the
population within each commune varies from one Fokontany to another, with some denser
nodes outside the CUA.
4. Results
The highest density values in 2018 are seen in the Fokontany in the center of the
4.1. Demographic
CUA and within aChangeradiusand Residential
of 2.5 km (FigurePopulation
7). TheDensity
densityinpeak
2018reached up 2000 inhabi-
tants/built ha, four times
Antananarivo the average
experienced density ofdemographic
considerable the Fokontany of the CUA
growth andlast
over the eight times
decades.
that of the
It was home agglomeration.
to more thanMost denserpopulation
half of the urban Fokontany of were
thein the western
country floodplain.
and around 11.3%
In the peripheral municipalities, densification was led by national
of the total population in 2018. Between 1993 and 2018 (25 years), annual growth was roads toward five
es-
main axes and
timated at 3.8%. grew with an area of expansion around a 10 km radius of downtown CUA
(FigureIn 7).
2018,In the
these
CUAcommunes, the Fokontany
had approximately 50% were
of theless
totaldense than those
population of theofagglomera-
the CUA.
However, some of
tion. However, them were
population in flood-prone
growth in the CUAareas.
between 1993 and 2018 was rather modest
Based on
compared to the
theresidential population
growth observed in density andmunicipalities
peripheral the size of the built-up
(Figure areas in flood-
6). Population
prone
growth in peripheral municipalities was mainly driven by migratory flows from theofCUA,
areas in each Fokontany, it is estimated that about 32% of the population the
agglomeration and 43% of the population of the CUA lived in flood-prone
defined as proximity migration [48], but also from other regions of the country [37]. areas in 2018.
Figure6.6.Annual
Figure Annualgrowth
growthrate
ratebetween
between1993
1993and
and 2018
2018 and
and population
population in in 2018
2018 byby borough
borough in the
in the CUA
CUA and by commune in the outskirts.
and by commune in the outskirts.
The demographic density was much higher in the CUA than in the peripheral mu-
nicipalities in 2018 (Figure 7). It can be observed, however, that the distribution of the
population within each commune varies from one Fokontany to another, with some
denser nodes outside the CUA.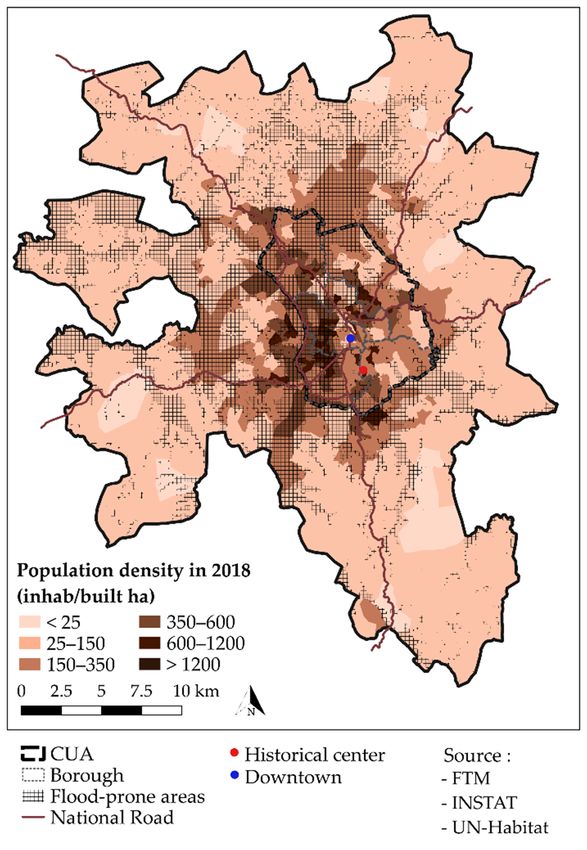
Water 2021, 13, 149 10 of 23
Water 2021, 13, x FOR PEER REVIEW 11 of 24
Figure7.7.Residential
Figure Residentialpopulation
populationdensity
densityinin2018.
2018.
4.2. Evolution of Built Spaces
The highest density values in 2018 are seen in the Fokontany in the center of the CUA
andAntananarivo
within a radius developed
of 2.5 kmin the center7).ofThe
(Figure the historic
density region of Imerina
peak reached up(Figure 8), an
2000 inhabit-
ethnic group in the central highlands of Madagascar. The first settlement
ants/built ha, four times the average density of the Fokontany of the CUA and eight times was the Rova,
athat
royalofpalace established during
the agglomeration. Most the 17th
of the century,
denser on the highest
Fokontany were in hill
theinwestern
the city [49]. Other
floodplain.
constructions were progressively
In the peripheral erected
municipalities, around the
densification waspalace
led by[50]. Some
national timetoward
roads later, the
five
30,000 inhabitants of city [51] settled on this first urbanized terrace
main axes and grew with an area of expansion around a 10 km radius of downtown CUA of the city, called the
“upper
(Figurecity” [52].
7). In Thecommunes,
these extension continued
the Fokontanybeyond the less
were limitdense
of thethan
hill and
thosespread
of theonCUA.
the
flanks and ridges of neighboring hills,
However, some of them were in flood-prone areas. in the north and west, toward the second half of
the 19th century and formed the “medium city” [50]. It then gradually developed into the
Based on the residential population density and the size of the built-up areas in flood-
plain, with the installation of small settlement cores in the middle of rice fields [53].
prone areas in each Fokontany, it is estimated that about 32% of the population of the
Under the French regime, the extent of this encroachment became more important,
agglomeration and 43% of the population of the CUA lived in flood-prone areas in 2018.
and Antananarivo underwent its first major urban transformations. Some 20 hectares
were backfilled in order to form the first Fokontany in the “lower town”, and other new
4.2. Evolution of Built Spaces
neighborhoods were created [54,55]. Between 1896 and 1903, 35 km of paved roadways
Antananarivo
were opened, tunnelsdeveloped
were dug, in the center
places wereof the historic
created region
[56], and ofworkImerina (Figurelines
on railway 8), an
started [57]. This was only the beginning of the urbanization that would occupy the entire a
ethnic group in the central highlands of Madagascar. The first settlement was the Rova,
royal area
lower palace established
a few during the 17th century, on the highest hill in the city [49]. Other
years later.
constructions
In 1953, thewerebuiltprogressively erected around
space mainly occupied elevated theareas
palace
and[50]. Some
covered time later,
around the
1806 ha,
30,000 inhabitants of city [51] settled on this first urbanized terrace
i.e., 2.4% of the area of the present agglomeration (Table 2). In the CUA, urbanization was of the city, called the
“upperoriented
mainly city” [52]. The extension
toward continued
the east, around the beyond the limit
historic center of the8).
(Figure hillOnand
thespread on the
other hand,
the development of buildings in the lower town of the west continued. 10% of the CUA areaof
flanks and ridges of neighboring hills, in the north and west, toward the second half
the urbanized,
was 19th century andand
someformed
2.6%the “medium
of the area was city”
then[50]. It then
covered bygradually
built areas developed
located ininto the
flood-
plain,zones
prone with (Table
the installation
2). Outside of the
small settlement
CUA, cores in the
the development middle
line of ricegradually
progressed fields [53].to the
east and northwest. Throughout the agglomeration, spatial development operated through
the densification of spaces that were already built and through “fingerprint” urbanization,Water 2021, 13, 149 11 of 23
where most constructions were arranged along the main national axes (Figures 8 and 9).
Water 2021, 13, x FOR PEER REVIEW 12 of 24
Among all built areas, 22% were in flood-prone zones, covering an area of 399 ha (Table 2).
Figure8.8. Urbanized
Figure Urbanizedcells:
cells: (a)
(a) 1953–1975;
1953–1975; (b)
(b) 1975–2006;
1975–2006;(c)
(c)2006–2017;
2006–2017;(d)
(d)2017.
2017.
Under the French regime, the extent of this encroachment became more important,
and Antananarivo underwent its first major urban transformations. Some 20 hectares
were backfilled in order to form the first Fokontany in the “lower town”, and other new
neighborhoods were created [54,55]. Between 1896 and 1903, 35 km of paved roadwaysIn 1953, the built space mainly occupied elevated areas and covered around 1806 ha,
i.e., 2.4% of the area of the present agglomeration (Table 2). In the CUA, urbanization was
mainly oriented toward the east, around the historic center (Figure 8). On the other hand,
the development of buildings in the lower town of the west continued. 10% of the CUA
area was urbanized, and some 2.6% of the area was then covered by built areas located in
Water 2021, 13, 149 12 of 23
flood-prone zones (Table 2). Outside the CUA, the development line progressed gradually
to the east and northwest. Throughout the agglomeration, spatial development operated
through the densification of spaces that were already built and through “fingerprint” ur-
banization, where most constructions were arranged along the main national axes (Fig-
Table 2. Extent and increase of urbanized cells and built areas in flood-prone zones.
ures 8 and 9). Among all built areas, 22% were in flood-prone zones, covering an area of
Built Areas 399 ha (Table 2). Built Areas in Flood-Prone Zones
Date TotalTable 2.Yearly Total
Extent and increase of urbanized cells and built Yearly zones.
areas in flood-prone Compared to
CUA Agglomeration CUA Agglomeration
Increase Increase Increase Increase Built Spaces
Built Areas Built Areas in Flood-Prone Zones
(%) (%) (ha) (%) Agglome-(%) Total (%)
In- (%) In-
Yearly (ha) (%)
Agglome- (%) In- Yearly(%)
Total In- Compared to
Date CUA CUA
1953 10 2.4 1806 ration crease
2.6 crease
0.5 399 ration crease crease22 Built Spaces
1975 25.5 5.4 4143 (%) 129(%) (ha)5.9 (%)8.3 (%)
1.4 (%)
1101 (%) 176 (ha) 8(%) (%)26.5 (%)
2006 48.2 10.5 1953
8048 10 94 2.4 1806 3 13.9 2.7 2.6
2038 0.5 85 399 2.7 25 22
2017 55.3 21.2 1975
16,250 25.5 1025.4 41439.3 12919.8 5.9
4.8 8.3
3675 1.4 80 1101 176
7.3 8 23 26.5
1953– 2006 48.2 10.5 8048 94 3 13.9 2.7 2038 85 2.7 25
2017 55.3 21.2 6.1
16,250 102 9.3 19.8 4.8 3675 680 7.3 23
2017
1953–2017 6.1 6
Water 2021, 13, x FOR PEER REVIEW 14 of 24
Figure 9. Urbanized cells in flood-prone zones: (a) 1953; (b) 1975; (c) 2006; (d) 2017.
Figure 9. Urbanized cells in flood-prone zones: (a) 1953; (b) 1975; (c) 2006; (d) 2017.
From the 1960s, the period of independence, backfilling continued in the flood plain
(Figures 8 and 9). Several new urban areas were built, and this did not protect the city
from flooding. Urbanization continued until 1975, with approximately 2330 ha more of
built areas than in 1953, and built areas then covered 5.4% of the agglomeration. The in-Water 2021, 13, 149 13 of 23
From the 1960s, the period of independence, backfilling continued in the flood plain
(Figures 8 and 9). Several new urban areas were built, and this did not protect the city
from flooding. Urbanization continued until 1975, with approximately 2330 ha more of
built areas than in 1953, and built areas then covered 5.4% of the agglomeration. The
increase compared to 1953 is estimated at 129%, an annual increase of 5.9% (Table 2). Inside
the CUA, built areas grew considerably and covered 25.5%. These are divided into two
distinct parts: to the east toward the elevated areas and to the west in the flood plain
(Figure 9). Built areas in flood-prone zones then represented 8.3% of the CUA, a sharp
increase compared to the situation in 1953. In peripheral municipalities, urbanization
mainly occurred through the filling of voids and the densification of existing areas. In
addition to this urban expansion at the agglomeration level, the share of built areas located
in flood-prone zones increased very rapidly. Compared to 1953, built areas located in
flood-prone zones increased by 176%, an annual increase of 8%, covering 26.5% of the
entire built area at the agglomeration level (Table 2).
From 1975 to 2006, urban expansion progressively shifted toward peripheral mu-
nicipalities, especially in the neighboring municipalities of the CUA (Figure 8). It was
guided by national roads and showed five centers of urban growth. In the CUA, urban
consolidation continued and densified the area to the east and northwest. Built areas then
occupied 48.2% of the CUA. In the whole agglomeration, between 1975 and 2006, the built
areas increased by 94%, corresponding to an annual increase rate of 3%. The built areas
then occupied 10.5% of the agglomeration, i.e., 8048 ha. It can be seen from Table 2 that 25%
of built areas were then located in flood-prone zones. This is equivalent to an 85% increase
compared to the situation of 1975, i.e., a 2.7% yearly increase over the period 1975–2006
(Table 2).
Between 2006 and 2017, urban expansion further intensified, especially in peripheral
areas. Constructions was dispersed in areas far from the CUA. Approaching the CUA,
the urban fabric became denser, especially in the northwest and the south (Figure 8). In
the CUA, despite high density, urbanization continued to progress, to a large extent at
the expense of rice fields in the lower town (Figure 8), by filling interstices to the west
and rising slightly toward empty spaces to the north (Figures 8 and 9). A total of 55.3%
of the CUA was occupied by built areas and 19.8% was occupied by built areas located in
flood-prone zones. At the agglomeration level, built areas covered 16,250 ha, or 21.2% of
the territory. It doubled over the years 2006–2017. The increase of built areas since 2006
was estimated at 102%, i.e., an annual increase of 9.3%. Constructions kept settling in the
flood plain, and 23% of the total built areas was located in flood-prone zones in 2017. With
an increase rate of 80%, or 7.3% yearly, built areas located in flood-prone zones occupied
4.8% of the agglomeration (Table 2).
Between 1953 and 2017, the annual rate of increase of built areas in the agglomeration
was 6.1%. In flood-prone zones, it was estimated at 6% (Table 2). Urban expansion in
flood-prone areas developed in parallel with that in other areas of the agglomeration.
Practically, it means that building in flood-prone zones in Antananarivo was driven by the
general expansion of the city, which was intense.
4.3. Case Studies
4.3.1. Case Study 1: Fokontany of Ambodirano Ampefiloha
The lower neighborhoods of the west, including the Fokontany of Ambodirano Am-
pefiloha, are the Fokontany located in the lower town on the left bank of the Andriantany
canal (Figure 10). They constitute the extension of backfilled spaces in the plain of Antana-
narivo during the colonial period. Urbanization in these places accelerated following major
subdivision operations in the 1970s. Apart from these constructions and a few service
buildings, most houses are made of recycled materials such as wood, plastic, or brick and
are in very poor condition [43] and underserved. The area gathers populations with low
income, which prevents them from accessing other housing [54]. Homes are cramped
and overcrowding prevails. They are exposed to flooding due to river floods and evenpefiloha, are the Fokontany located in the lower town on the left bank of the Andriantany
canal (Figure 10). They constitute the extension of backfilled spaces in the plain of Anta-
nanarivo during the colonial period. Urbanization in these places accelerated following
major subdivision operations in the 1970s. Apart from these constructions and a few ser-
Water 2021, 13, 149 vice buildings, most houses are made of recycled materials such as wood, plastic, or14brick
of 23
and are in very poor condition [43] and underserved. The area gathers populations with
low income, which prevents them from accessing other housing [54]. Homes are cramped
and overcrowding prevails. They are exposed to flooding due to river floods and even
overflows
overflows of
ofdrainage
drainagecanals,
canals,and
andtoto
health risks.
health These
risks. areare
These notnot
negligible duedue
negligible to the
to almost
the al-
permanent accumulation of water during the rainy season.
most permanent accumulation of water during the rainy season.
Figure 10.
Figure 10. Map
Map of
of Fokontany
Fokontany of
of Ambodirano
Ambodirano Ampefiloha
Ampefiloha in
in CUA.
CUA
Ambodirano Ampefiloha covers an area of 63 ha. It is crossed in the east by the GR
channel, the irrigation channel of the agricultural plain, and bordered by the Ikopa in the
west. It has a flat topography with areas that form basins accumulating large volumes
of water.
Between 1993 and 2018, the population almost tripled. With the growing population,
this Fokontany is densely populated, with a residential density estimated at 484 inhabi-
tants/built ha. The dynamics of family migration based on family support to overcome
the difficulties encountered in the rural world is a main source of this considerable densi-
fication [43]. The residential area occupies 30% of the total area and rice fields 60%. The
Fokontany does not have a specific drainage network (SAMVA).
This large urban space should contribute to the storage of water during rainy peri-
ods [58]. Nevertheless, it is increasingly invaded by constructions.
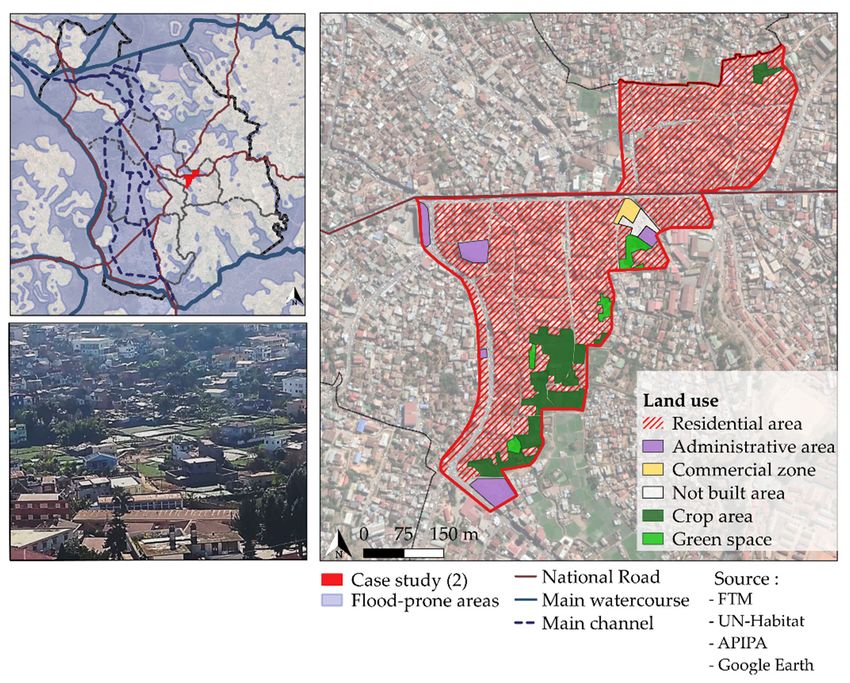
4.3.2. Case Study 2: Fokontany of Ampandrana-Besarety and Besarety
The Fokontany of Ampandrana-Besarety and Besarety are classified among the
working-class neighborhoods at the foot of the upper town (Figure 11). They are located at
altitudes between 1251 and 1252 m and extend over 22 ha. As in most of the Fokontany in
the lower areas, backfilling allowed a progressive urbanization of the zone [59]. Floods are
mainly linked to the overflow of drainage channels.
With a residential population density of 548 inhab/built ha, well above the CUA
average, these Fokontany are categorized as densely populated. Population growth was
2.9% per year between 1993 and 2018. This upsurge was due to the high birth rate and the
arrival of new migrants. The proximity to the city center and industrial zones explains why
new inhabitants have come to settle there.4.3.2. Case Study 2: Fokontany of Ampandrana-Besarety and Besarety
The Fokontany of Ampandrana-Besarety and Besarety are classified among the
working-class neighborhoods at the foot of the upper town (Figure 11). They are located
Water 2021, 13, 149 at altitudes between 1251 and 1252 m and extend over 22 ha. As in most of the Fokontany
15 of 23
in the lower areas, backfilling allowed a progressive urbanization of the zone [59]. Floods
are mainly linked to the overflow of drainage channels.
Figure
Figure 11.
11. Map
Mapof
ofFokontany
Fokontanyof
ofAmpandrana-Besarety
Ampandrana-Besarety and
and Besarety
Besarety in
in CUA.
CUA.
Mainly
With residential population
a residential activities and constructions
density are developing,
of 548 inhab/built to the
ha, well detriment
above the CUA of rice
av-
fields. Two categories of settlements can be identified here: traditional
erage, these Fokontany are categorized as densely populated. Population growth was or modern concrete
constructions
2.9% and small
per year between constructions
1993 made
and 2018. This of sheetwas
upsurge metal
dueortowood. Currently,
the high dwellings
birth rate and the
cover 75% of the total area, and 7% is occupied by cultivated areas. However,
arrival of new migrants. The proximity to the city center and industrial zones explains the whole
area new
why has ainhabitants
waterproofing
haveratecomeof more than
to settle 80%, which generates large runoff.
there.
The drainage system works differently
Mainly residential activities and constructions on botharesides of the area
developing, (SAMVA).
to the detrimentIt of
is
operated through underground networks to the west and provided by gutters
rice fields. Two categories of settlements can be identified here: traditional or modern con-in the east.
The whole system is subsequently taken up by primary channels. Despite the existence of
crete constructions and small constructions made of sheet metal or wood. Currently,
this system, the primary network remains constrained by the accumulation of water with
an important flow upstream of the site and by the weak slopes of the plain. Furthermore,
the sections of these channels are heterogeneous. In certain sections, the load is much
greater. In addition, the flow of water is hampered by the congestion of gutters and the
obstruction of manholes by deposits of sand or waste [43]. Some installed structures also
make it more difficult for water to flow during rainy events [60]. All of this, together with
the proximity of the constructions to the drainage network and even their encroachment
on the network, makes these Fokontany areas with recurrent floods.
5. Discussion
In SSA, several urban areas have experienced high population growth in recent
decades. Gardi has shown that 12 of the top 30 fastest-growing urban agglomerations
in the world are in SSA [17]. Antananarivo ranks 20th in the world and 9th in SSA in
this ranking, right next to the major cities of Nairobi, with an annual rate of 3.87%, and
Kinshasa, with 3.89% [17]. This growth is due to the high rate of natural increase and the
rural exodus to and near urban areas [36]. In SSA, internal growth has been a determining
factor for many years [16,61,62]. Nevertheless, migration is also part of the driving force
behind population growth and urban sprawl [63–65]. For sociocultural, economic, political,
and environmental reasons, whether it is a choice or a necessity, this migration seems to
be a way to allow better living conditions for rural migrants [63,66]. In South Africa, due
to inadequate social services and the lack of employment in rural areas, people migrate
to urban areas [66,67]. In the Democratic Republic of Congo, it is because of conflicts andWater 2021, 13, 149 16 of 23
insecurity [65,68]. In Burkina Faso and Kenya, it is due to climatic disturbances [69]. The
expansion of informal activities [66] and the concentration of services and facilities in cities
also easily attract the rural population [65,70]. In Madagascar, social and land insecurity
in the countryside [45] as well as economic difficulties [71] due to declining agricultural
productivity [34] are pushing rural populations to migrate to Antananarivo. Due to the
accessibility of services and infrastructure, students, civil servants, and people involved in
small trade migrate and increase the size of the city’s population [53].
This demographic growth creates unease for urban centers, since the supply of housing
and spaces to be built does not meet the growing demand [63,72–74]. The fragility of urban
governance, manifested in the lack of support and prioritization of urban infrastructure and
land-use management initiatives by governments, is one of the reasons for this [75]. Parnell,
Pieterse, and Watson also refer to a lack of good planning [20] due to poorly conceived
planning laws and standards for construction as well as insufficient funding [16]. As a
result, many informal settlements are developed [18]. The proliferation of these informal
settlements is also related to increasing urban poverty and leads to the involvement of
many poor people in the informal economy [65,76]. On the other hand, it is produced by
the proximity of informal employment, which pushes migrants and poor households to
settle nearby [77,78]. It is also accompanied by the development of new housing areas
in flood-prone areas [18,19,79]. These settlements are generally precarious, with poor
infrastructure, and are heavily impacted by flooding [18,70,80]. For Antananarivo, given
the weakness of urban planning and the absence of housing policies, the demand greatly
exceeds the supply that the city can offer [81]. This has led to illegal installations and
constructions in the west of the city, in the flood plain [82]. In order to overcome this deficit,
public authorities indirectly approved and anticipated the extension of urbanization in the
plain [83].
In SSA, most of the urban population live in informal settlements in areas at risk [23],
such as floodplains, swamps, and riverbanks [84,85]. This population group mainly consists
of the urban poor [84]. They are often excluded from the land market due to unaffordable
prices and imposed standards and regulations that they are unable to follow, and that force
them to occupy these dangerous lands [11,21,86]. In addition to this group are refugees
and persons who are displaced due to forced displacement in cities who settle in these
areas for various reasons [87–90]. These situations and the increased population density in
these areas make them more vulnerable to flooding [84,89,91].
This set of processes is linked to the history of urbanization in SSA. In the region,
the pre-colonial period is characterized by a low level of urban development [76] that
intensified during the period of colonization [16,65,76]. The occupation of colonial cities by
settlers [76,79] favored the development of informal settlements formed by the indigenous
population, who were excluded from planning [92]. In Nairobi, this led to the construction
of several illegal settlements by homeless Africans who were only allowed to be in the
city for work [92]. It also promoted the development of habitats in flood-prone areas,
as in the case of Antananarivo. In the 1930s and 1960s, development of the colonial city
led to the displacement of several population groups, who took refuge in low areas [93].
In addition, the overcrowded hills of the middle city and the conveniences of the plain
attracted inhabitants of the upper city to the lower city [53]. In the 1950s and 1960s,
urbanization was mainly fueled by the development of industrial facilities [43], part of the
orientation of the 1954 colonial-era urban plan [83]. These works changed the hydraulic
regime of the plain and led to densification of the flood plains [59]. Flood-prone zones
also became more favorable for speculators and real estate developers. Actually, building
is less onerous and investments more profitable in low lands, given the more suitable
topography [83]. By contrast, the extension of existing habitats and the widening of service
roads were more expensive in the eastern part, given the steep slopes (up to 20%) [40,94].
There are also landslide risks in this part of the city [95].Water 2021, 13, 149 17 of 23
In the years following independence, around 1960 and 1970, many cities in SSA
experienced rapid population growth [65,79,96]. This growth can be linked to policies
adopted after independence, which were related to the deployment of jobs, the establish-
ment of several industries in city centers [65,97], and investment in public works [98].
The average annual population growth rate in urban areas was approximately 5% [99].
However, the cities inherited from the colonial era were not designed to accommodate such
a massive population [20,76]. This reinforced the proliferation of informal settlements [76]
that are more exposed to flooding [74]. In Accra, Ghana, the informal development of
some communities in watersheds around rivers and lagoons increased their exposure to
flooding [100]. In addition, the economic crisis that hit Africa in the 1970s fueled such
difficulties throughout the region [101]. There has been a decline in investment in urban
infrastructure and housing [76]. For Antananarivo, the 1970s were characterized by the
completion of development and subdivision work to replace the thousands of homes de-
stroyed following the devastating 1959 floods [83,102]. Other districts were then created in
the lower town to accommodate the affected populations [94]. As these social housing units
were not affordable for vulnerable populations, the construction of precarious housing
proliferated. Antananarivo was also plunged into a lasting multifaceted crisis [56]. The
construction sector was strongly affected. Materials were more expensive and scarcer. This
led to the proliferation of informal habitats in flood-prone zones [43]. This was favored by
the absence or inadequacy of urban land management tools [103]. It is difficult to access
land due to expensive administrative procedures and a lack of updated information about
the legal status of the land [45].
From the 1990s, urban development accelerated, especially in the peripheral areas
around cities [62]. This is partly due to the decline in land values in these areas [104].
However, these habitats are often built outside of planning and regulations [65,104,105],
and are places where various risks, including flooding, are prevalent [23]. For Antana-
narivo, the emergence of several peri-urban cores outside the CUA was supported by the
establishment of the city’s 2004 urban plan, which proposed unclogging the city center [37].
The migratory flow consequently became more important toward peripheral municipali-
ties. This is further related to the limited accommodation capacity of CUA houses linked
to their architecture [106] and the lack of available land for development in residential
areas [107]. Peripheral areas were more attractive for residential installations in terms of
both availability of building land and cost of living [108]. The establishment of industrial
buildings [46] and the proliferation of infrastructure projects led to the acceleration of
urbanization, which is increasingly taking place in flood-prone areas where land is cheaper
and rents moderate [82,106]. The proximity of these settlements to industrial areas attracts
the population, as shown in the case studies. These factors were favored by the absence of
urban planning for a long period (from 1968 to 2004) [83].
This growing urbanization in SSA is also accompanied by a lack of infrastructure,
including drainage systems, which makes cities vulnerable [19,79,91]. In Antananarivo,
the case studies reveal this. The proximity of constructions to drainage canals and informal
encroachments on these canals progressively reduce their capacity [60]. As the load on
the existing network increases, this leads to greater susceptibility to the effects of further
flooding [74].
Scheme 2 synthetizes the co-evolution of urbanization and vulnerability of poorly
managed urban environments. The demographic pressure leads to urban sprawl around
major cities (1). Due to the lack of housing and appropriate urban management (2), the
expansion of the city occurs through informal settlements (3). It is more the case that
incoming populations, especially from rural areas, are usually associated with low eco-
nomic resources (4). Flood-prone areas are associated with the development of informal
settlements (5): land is cheaper, and constructions are not authorized by planning docu-
ments. Furthermore, flood-prone areas located near canals and rivers are well adapted to
maintaining subsidence urban agriculture, especially for inhabitants coming from rural
areas. The construction of precarious settlements in flood-prone areas (6) by low-incomemanaged urban environments. The demographic pressure leads to urban sprawl around
major cities (1). Due to the lack of housing and appropriate urban management (2), the
expansion of the city occurs through informal settlements (3). It is more the case that in-
coming populations, especially from rural areas, are usually associated with low economic
resources (4). Flood-prone areas are associated with the development of informal settle-
Water 2021, 13, 149 18 of 23
ments (5): land is cheaper, and constructions are not authorized by planning documents.
Furthermore, flood-prone areas located near canals and rivers are well adapted to main-
taining subsidence urban agriculture, especially for inhabitants coming from rural areas.
groups
The (7) obviously
construction exacerbates
of precarious the vulnerability
settlements of theseareas
in flood-prone groups
(6) and their habitat;
by low-income even
groups
more
(7) as the drainage
obviously exacerbatessystem in these areas
the vulnerability ofisthese
often insufficient
groups (8),habitat;
and their which canevenpartly
more be as
explained
the drainage bysystem
the fastinurban growth
these areas witnessed
is often by SSA
insufficient (8),cities
which(9)can
andpartly
the lack of adequate
be explained by
integration
the fast urbanof drainage in urban planning
growth witnessed by SSA policies
cities (9)(10).
andThethe lack
lack of
ofdrainage
adequatecombined with
integration of
urban sprawl and soil-sealing further contribute to increasing floods at
drainage in urban planning policies (10). The lack of drainage combined with urban sprawl the agglomeration
levelsoil-sealing
and (11). further contribute to increasing floods at the agglomeration level (11).
Scheme II. 2.
Scheme Flood
Floodvulnerability factors,aaco-evolutionary
vulnerability factors, co-evolutionary perspective.
perspective.
6. Conclusions
Flooding is an occurrence that plagues most countries in the world, particularly in
urban centers in SSA. Over time, poorly planned urbanization, combined with several
other factors, expose people and buildings to flooding and increase their vulnerability. The
agglomeration of Antananarivo is a clear example. Like many African urban agglomer-
ations, it faces strong demographic pressure due to the high rate of natural growth and
population migration toward urban areas. The city progressively expanded in the lower
zone without much control. Our analysis shows that around 32% of the population of the
agglomeration lived in flood-prone zones in 2018. The annual growth of built-up areas in
flood-prone zones between 1953 and 2017 is estimated at 6%. In 2017, 23% of the buildings
of the agglomeration, i.e., almost one out of four buildings, were in flood-prone zones.
The dynamics of urbanization inherited from the colonial era led over time to the
proliferation of informal settlements, which are more exposed to flooding. This led to a
modification of the hydraulic system of the city and a high degree of vulnerability in the
flood plain. Given the inadequacy of the drainage infrastructure, the agglomeration is
suffering from increasingly harsh flood events, especially during the rainy period. This is a
trend known and present in the literature on urban agglomerations in SSA.
Faced with the rapid growth of the population, which leads to high demand in terms of
constructions, urban planning and management are essential to avoid installations in flood-
prone areas. This concerns dwellings as well as other structures that may attract inhabitants.
The inadequacy or even the absence of planning, most of the time accompanied by a lack
of provision of adequate services and equipment, leads to concentrated precariousness in
flood-prone zones, where land is obviously cheaper. Integrating flood risk management
in spatial planning policies is essential to curb this phenomenon. It should be combinedYou can also read